
Discovery Boards
Overview
Discovery boards is a visual data analysis tool available within Workday. This tool allows you to perform ad hoc analysis on data sources in a drag-and-drop interface. You can export the visualizations you create using Discovery Boards for consumption as a Workday report.
Discovery boards is for data analysts who need to deliver insights regarding specific business questions to their leaders. Using Workday Drive, data analysts can create discovery boards, explore data in an intuitive interface, and share the resulting visualization to the appropriate audience.
In this chapter, you will explore an overview of discovery boards. We will explore discovery boards benefits, Workday Drive, and the difference between dashboards and discovery boards. You will create a discovery board and add visualization boards to it. Also, you will learn about some advanced discovery board features such as filters, curated data sources, and curated field lists. Lastly you will share a discovery board and visualization and learn how to add a discovery board to your home page.
Objectives
By the end of this chapter, you will be able to:
- Define the benefits of using discovery boards.
- Compare using dashboards to using discovery boards.
- Understand the components of the discovery board workspace.
- Explain how to find an optimal data source and data source filter.
- Create a discovery board and visualization.
Benefits of Discovery Boards
The Discovery Boards tool enables you to create visual analytics. A discovery board is your starting point for data analysis and the canvas for discovering and sharing data insights.
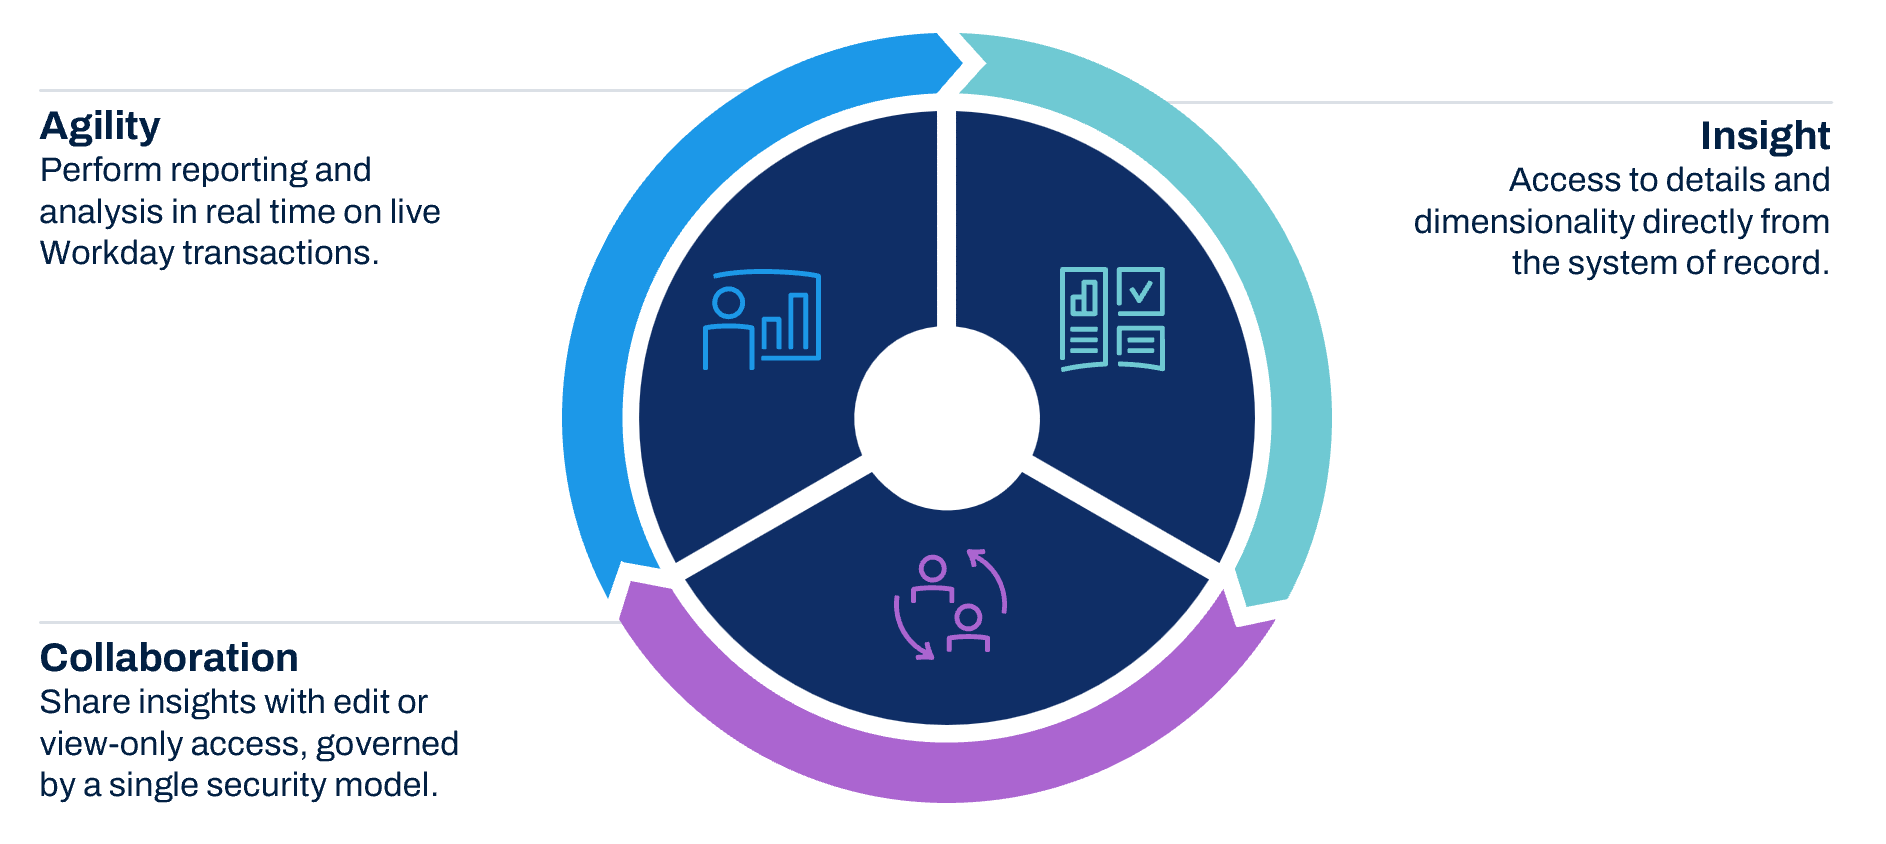
Discovery boards provide three unique benefits to Workday users:
- Agility to quickly pivot and stay ahead of the curve.
- Insight that answers operational questions.
- Collaboration with teams.
Discovery Boards vs. Dashboards
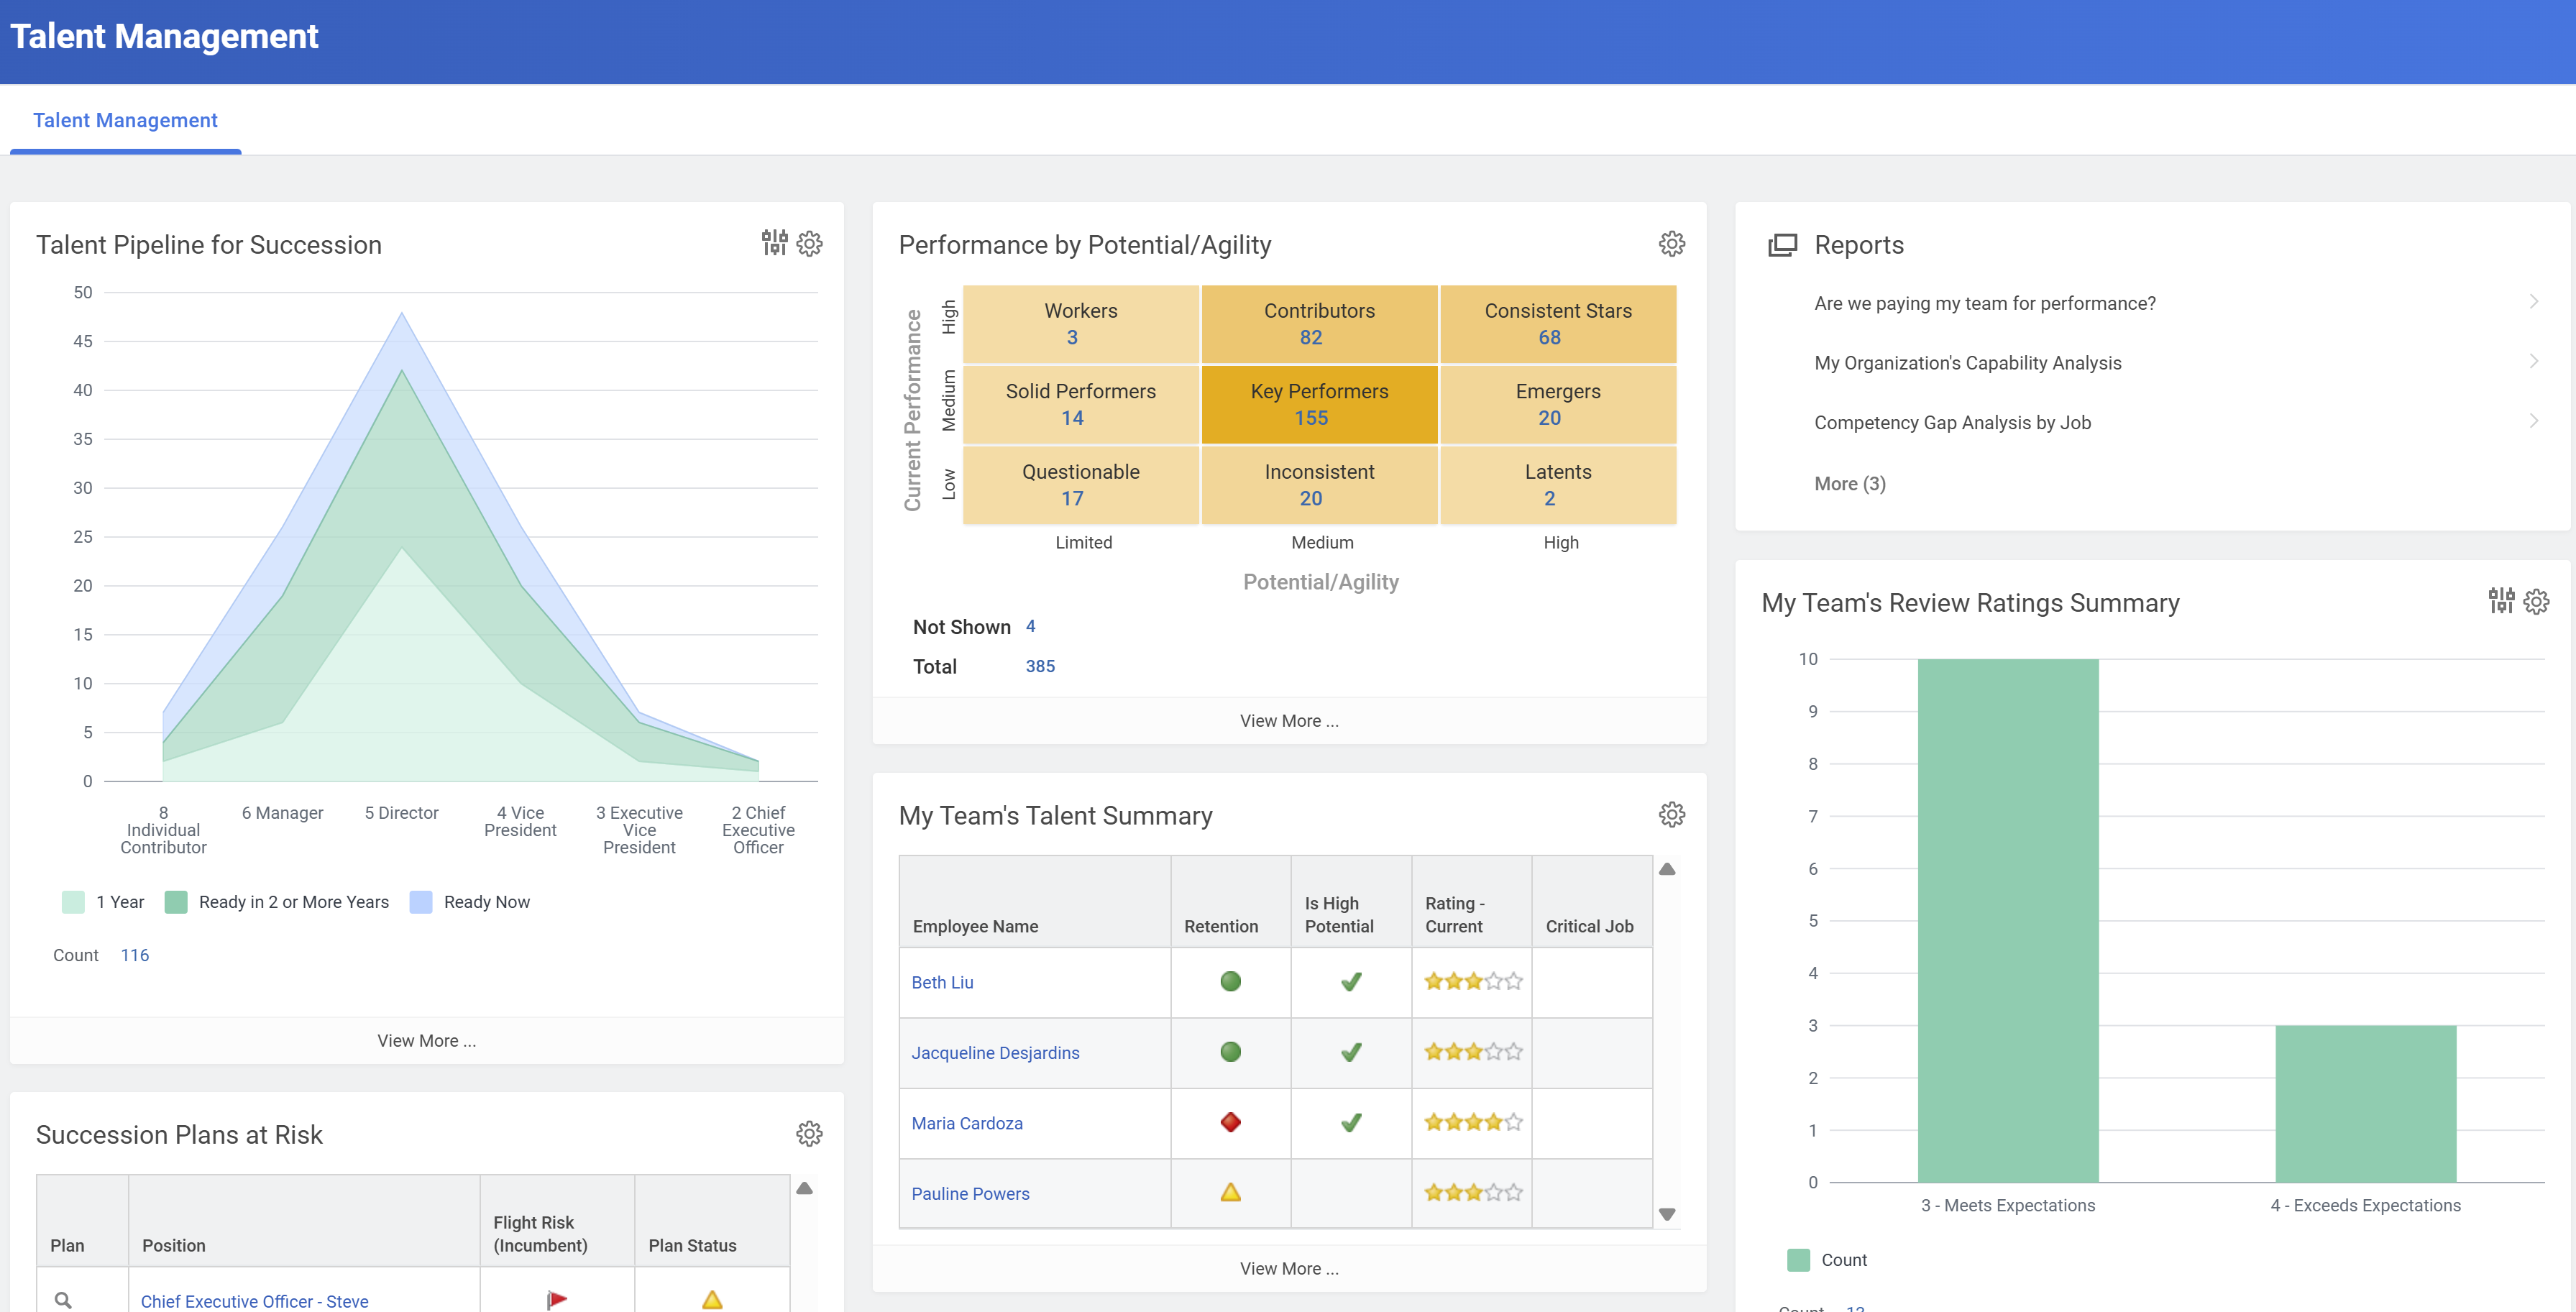
Dashboards allow you to easily organize and deploy data to target audiences. You can configure Workday-delivered dashboards, and custom dashboards to display groups of custom reports enabled as worklets. You can build custom reports using the Report Writer tool. You can enable reports as worklets and display them on dashboards. You can display different reports that provide configured results around a particular topic.
For example, this image demonstrates a dashboard titled Talent Management. The dashboard consists of different worklets, each representing reporting results related to talent performance. When you access the dashboard, several worklets display. There is information such as talent pipeline for succession, performance potential and agility, and the team's talent summary. Each of the worklets represents a corresponding custom report added to the dashboard.
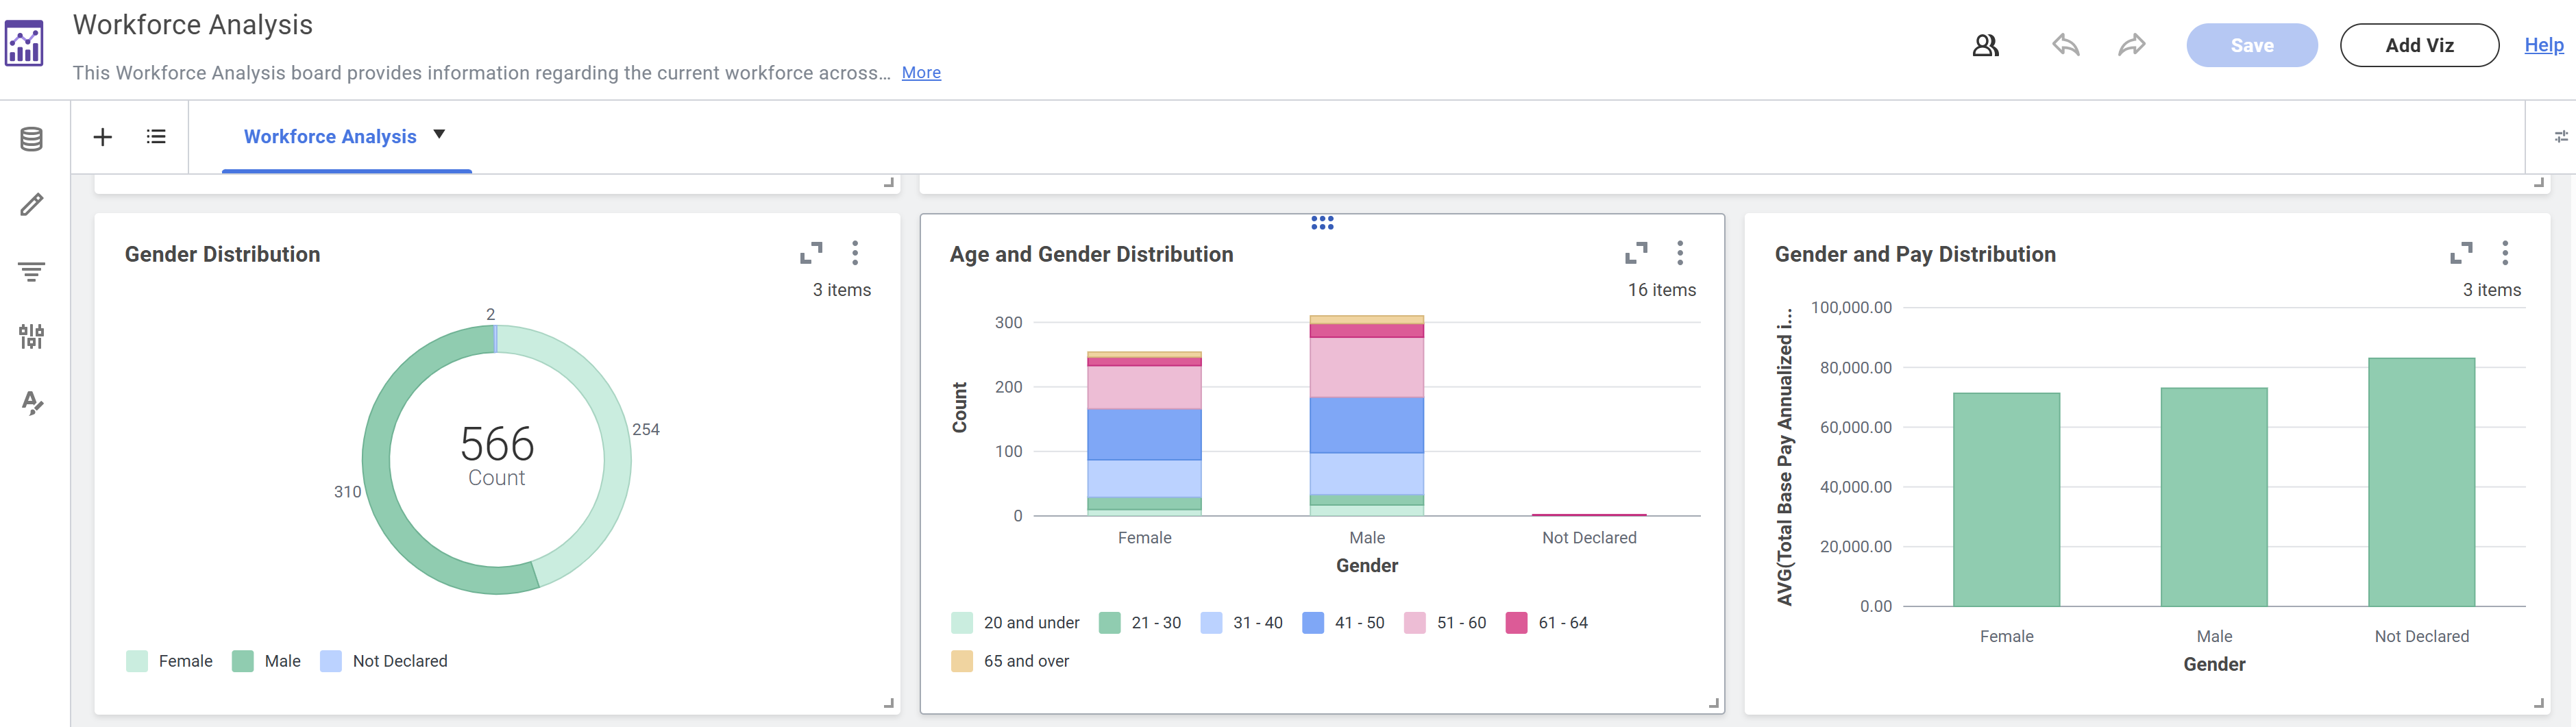
By using Discovery Boards, you can perform impromptu analysis on data sources and business objects. Doing so changes your report outcome on the spot by using the drag-and-drop interface. In other words, you can render your data output from different angles by changing the parameters by which you configure your discovery boards. The visualization that corresponds to your data would update in real time without having to reconfigure a report. In that respect, dashboards are much more static. In dashboards, viewing results from different data parameters requires you to change your Report Writer report. You would have to change the configuration each time you wanted to report on the same information from a different perspective.
In the example, the discovery board for Workforce Analysis displays several different visualizations. These visualizations represent the percentage of females in leadership, age and gender distribution, pay for performance, headcount walk, and more. From the discovery board, you can use the Data Source, Builder, Filter, Configuration, and Formatting panels to change the parameters for each visualization and immediately view the results accordingly.
Use the information on this table to help you decide which is the best option for your use case.
Property | Dashboards | Discovery Boards |
|---|---|---|
Menu Support for Workday Tasks | Yes | No |
Support for Announcements and Messages | Yes | No |
Prompting | Prompt set used to tie the prompts from the various worklets into a single set. | Expose prompt and sheet filters to viewers using controls. (Note: A sheet filter only applies to visualizations sharing the same data source and data source filter combination. If you have two Location filters from different data sources, the view will need to input the Location value twice.) |
Max Visualizations/Worklets per Sheet | 6 | 10 |
Max Number of Sheets/Tabs | 6 | Unlimited |
Access | Accessed through the Search bar, as a worklet, or through a direct URL. | Accessed through the Search bar, Workday Drive, as a worklet added to the Global Navigation menu, or a direct URL. |
The Discovery Board Workspace
As a graphical data representation tool, a Discovery Board has different menus and options to help you configure the discovery board and its corresponding visualizations. You can update the discovery board from the Discovery Board workspace. You can also configure visualization options by selecting the visualization types.
Components of a Discovery Board Workspace
Components of the Discovery Board workspace include the following, as labeled in the image below:
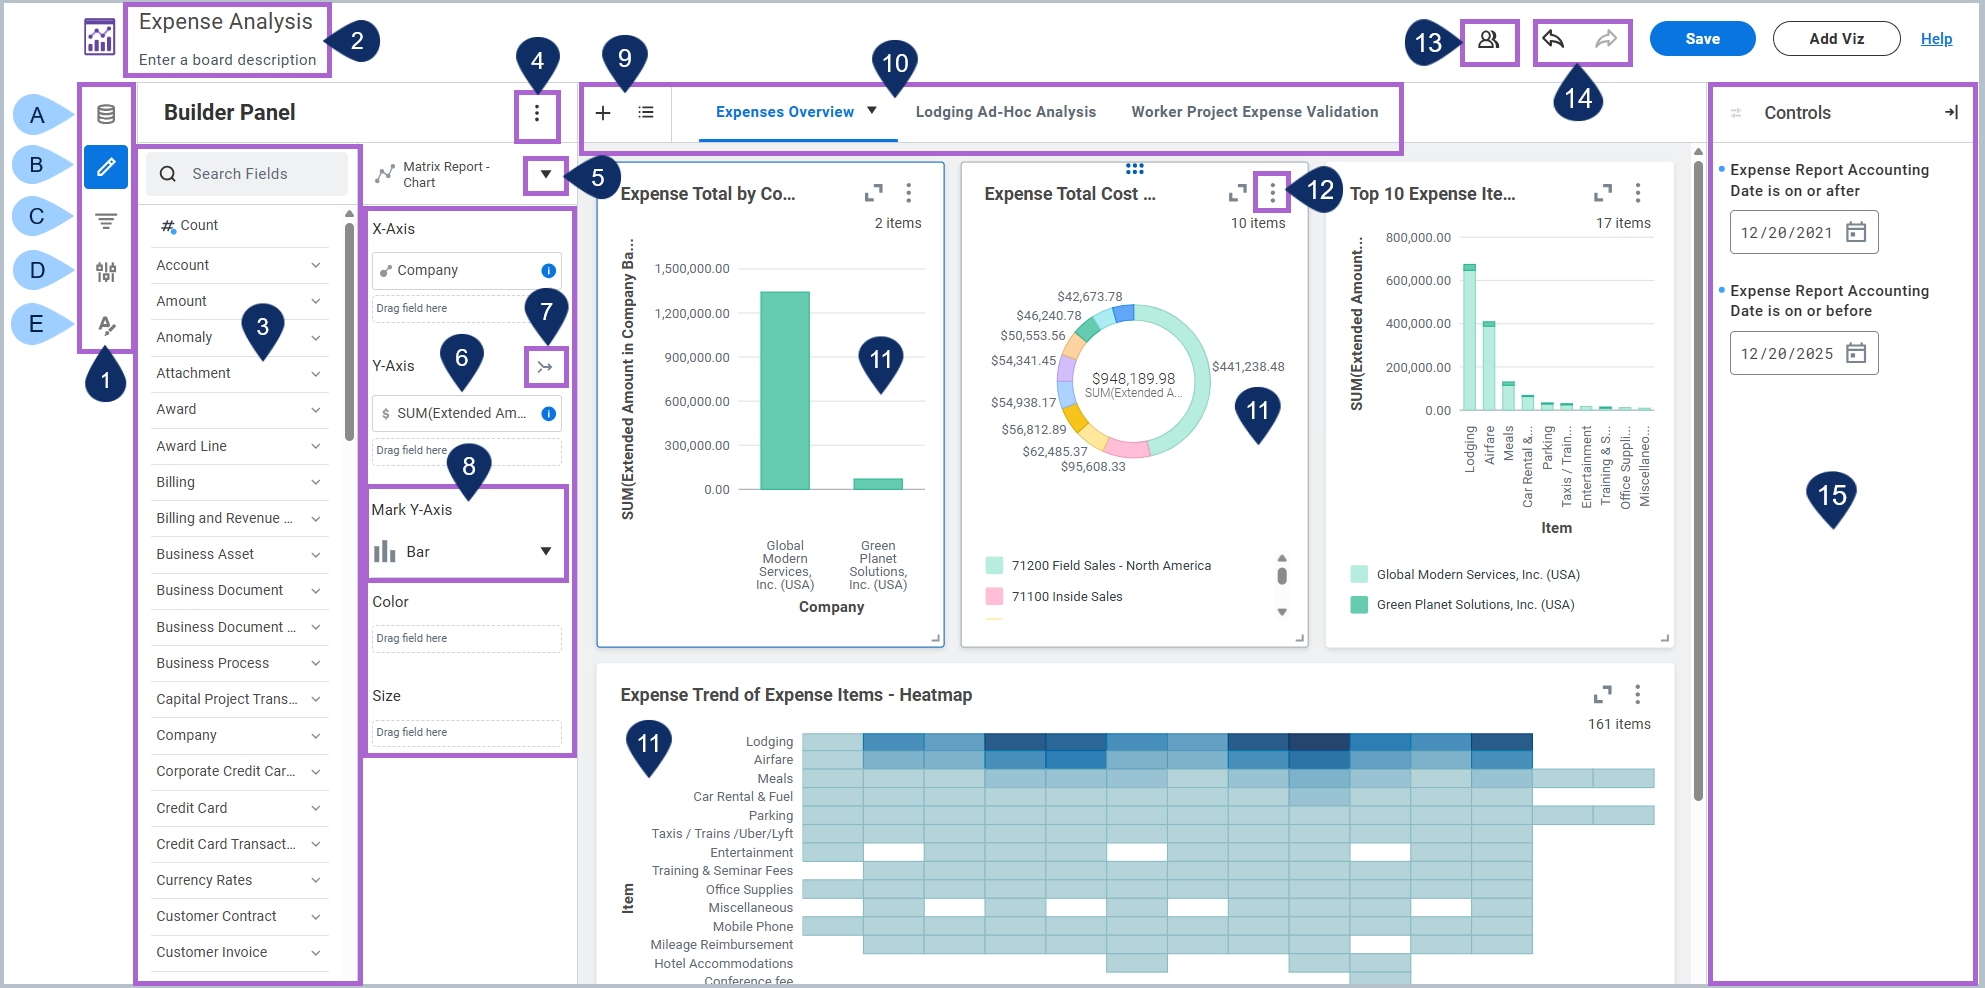
The Discovery Board Workspace
- Panel Selection: Toggle between the Data Source, Builder, Filter, Configuration, and Formatting Panels.
- Data Source Panel: The data source for the viz displays a list of data source options and fields within those same data sources that you can use to analyze your data.Note: If you wish to change the data source, select the arrow icon next to the data source name. You can search for and select a new data source from the data source list.
- Builder Panel: Choose a viz type and build the viz by placing fields into compatible dimensions.
- Filter Panel: Displays filters for the selected viz and the entire sheet. Select the Add icon to define a filter.
- Configuration Panel: Configure how vizzes display data, such as managing the sort order of fields or overriding populated Drill By and Show Details values.
- Formatting Panel: Enables you to change the discovery board's color palette or override specific field value colors (not configurable with Matrix or Advanced Report type vizzes).
- Discovery board title and description.
- Field list: Numeric and currency fields in the data source display all summarization fields underneath the field. Select the field to expand and view the summarization options.
- Panel options: Collapse or expand the panel display. In the Data Source panel, enable or disable the 'Show only curated data sources' toggle. In the Builder Panel, enable or disable the 'Show only curated fields' toggle.
- Viz type options: Choose a viz type such as Chart, Bar, Table, Donut, KPI, Waterfall, Heatmap, Scatterplot, and more.
- Drop zones: Drag and drop fields into available drop zones to render a visualization.
- Dual or merge option: Select a dual or merged Y-axis (Area Chart, Bar Chart, Chart, and Line Chart vizzes only).
- Mark type: Select a mark type (Chart viz only).
- Sheet Controls: Add a sheet or view a list of all sheets.
- Sheets.
- Visualization or viz.
- Viz Related Actions: Select an action from the menu such as Download as PNG or Download as CSV.
- Share: Share with individuals or groups and adjust sharing permission levels.
- Undo and Redo buttons.
- Control panel.
Workday Drive
Workday Drive, a tool within our Productivity Suite of products, is the home of all your collaborative documents in Workday, including workbooks, presentations, discovery boards, and media files. It can also house non-Workday files as authorized.
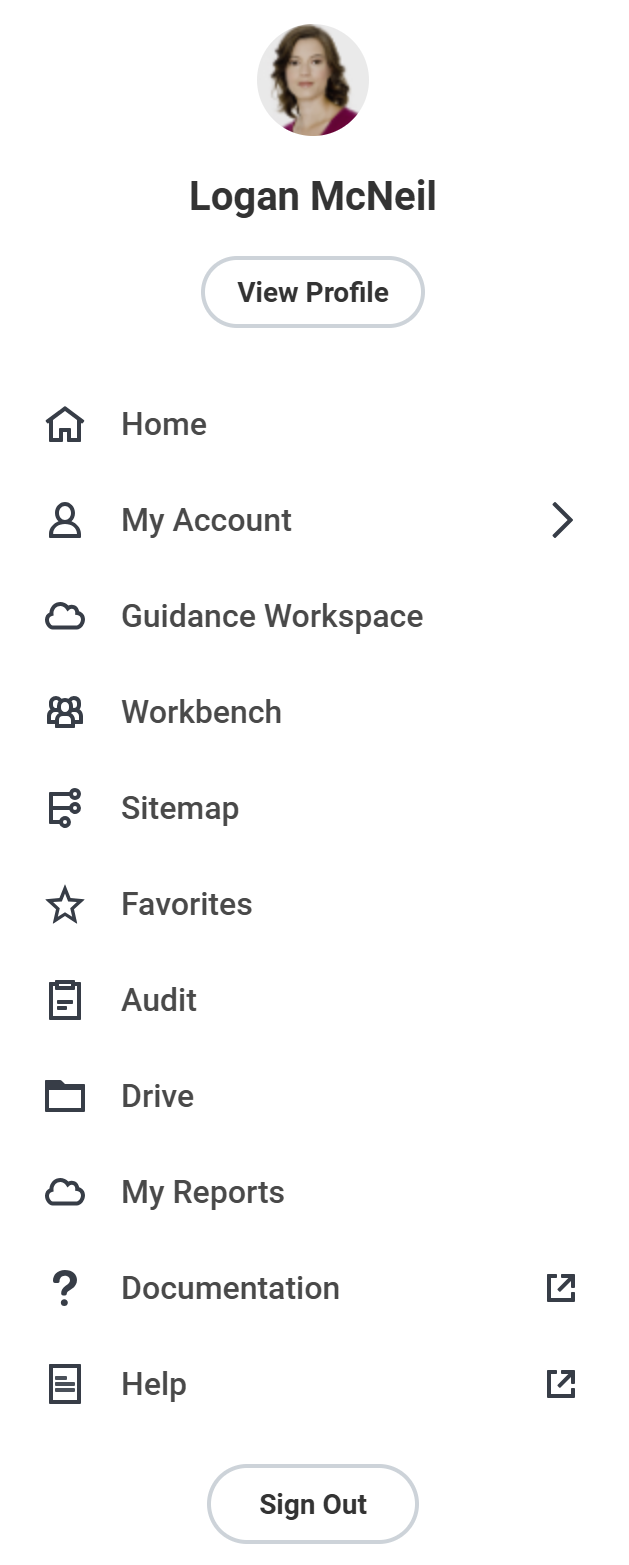
The Drive option from Logan McNeil's profile menu
You can access the Workday Drive by selecting the user's profile picture on the top-right corner of the Home page. The option for the Workday Drive appears as an option in the Profile menu.
The features of Workday Drive for users allow users to:
- Create and upload items.
- Organize files and folders.
- Share with various permissions in context of Workday security.
- Control permissions of individual files or folders (view, comment, and edit who has what permissions).
Tip
: Some users may experience a Web Socket Connection Failed error when trying to access Drive. This is typically due to a network or firewall configuration. Those that come across this error need to work with their local IT team to resolve the issue.Planning Discovery Boards
Once you establish the purpose for retrieving data, you can better determine the data sources available to best probe into the data. A data source defines a set of business object instances for reporting purposes. Also, it allows reporting access to all business objects related to those in the data source.
Data Source Selection
As a review, Workday stores data in business objects. That business object has fields and instances, which are similar to rows and columns in a spreadsheet. Each row is an instance, and each column represents an attribute or field related to that instance. Each data source contains instances of a business object, which serves as the primary business object of the data source. In other words, a data source allows reporting access to all business objects related to those in the data source. Multiple data sources can have the same primary business object.
Some data sources return all instances of the primary business object, while some data sources also include:
- Built-in filters that limit the number of business object instances.
- Prompts that you can use when running the report.
Workday secures data sources and data source filters by security domains. Different domains might secure a data source and its data source filters.
Report
: An excellent Workday-delivered resource is the Data Sources
report. From this report, you can explore data sources by name, primary business object, description, type, built-in prompts, category, and related data source filter information.The data source you select for your discovery board determines which fields you can access, so make sure that you have considered the following questions:
- What fields do you need?
- Have you consulted the Workday-deliveredData Sourcesreport? If so, did you filter by Category to help find a data source?
- Does the target audience for the discovery board have access to the data source and fields you are using?
Not all data sources are available for use with Discovery Boards. However, Workday maintains a curated list of Workday-delivered report data sources from product areas such as Workday HCM, Workday Financial Management, and Workday Student.
Set Up the Visualization Data Source
Every visualization in a discovery board analyzes data in a data source. Workday applies the selected data source and displays the Builder Panel so you can analyze the data in the data source you selected.
When you create a discovery board, you select the data source to analyze in the first visualization. When you add a new visualization or duplicate an existing visualization, Workday automatically selects the same data source as the previously selected visualization.
You can change the data source used in a visualization using the Data Source Panel. Here, Workday lists the supported Workday-delivered data sources to which you have access.
Note
: If your tenant has Prism Analytics enabled, you will have access to both Prism data sources and Workday-delivered data sources.For Workday-delivered data sources, you have more options to configure for the data source, such as data source filters and prompts built into data sources or fields.
Business Objects in Discovery Boards
Because you can have multiple visualizations in your discovery board, you can have different data sources and primary business objects in one discovery board.
To locate the primary business object that a visualization is based on, follow these steps while in Edit mode:
- Select the visualization that you want to locate the primary business object for.
- Select the Data Source Panel icon.
- If you have already selected the data source, select the back arrow to return to the data source list.
- From the data source list, search for the data source you want to use.
- Hover over the data source. A data source description appears to the right of the data source list.
- From the data source description pop-up, select the external link icon (box with an upper-right pointing arrow), as shown in the Trended Workers data source example below.
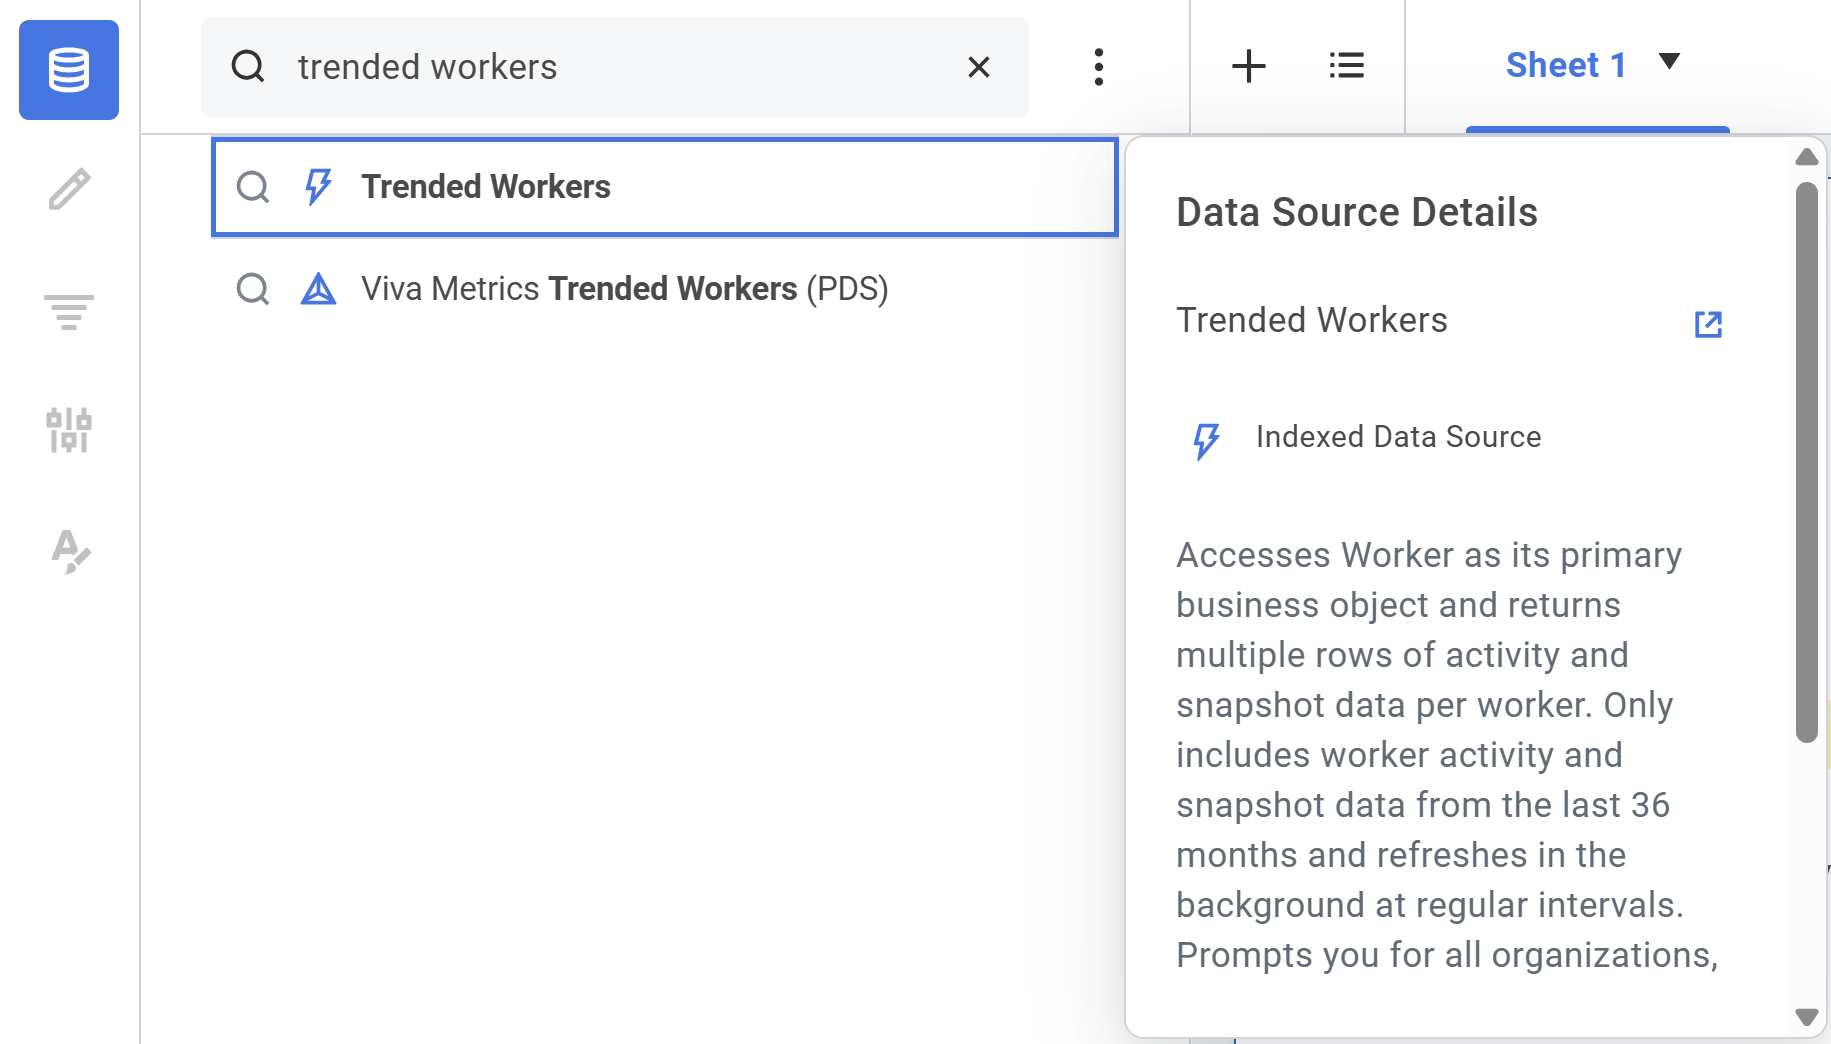
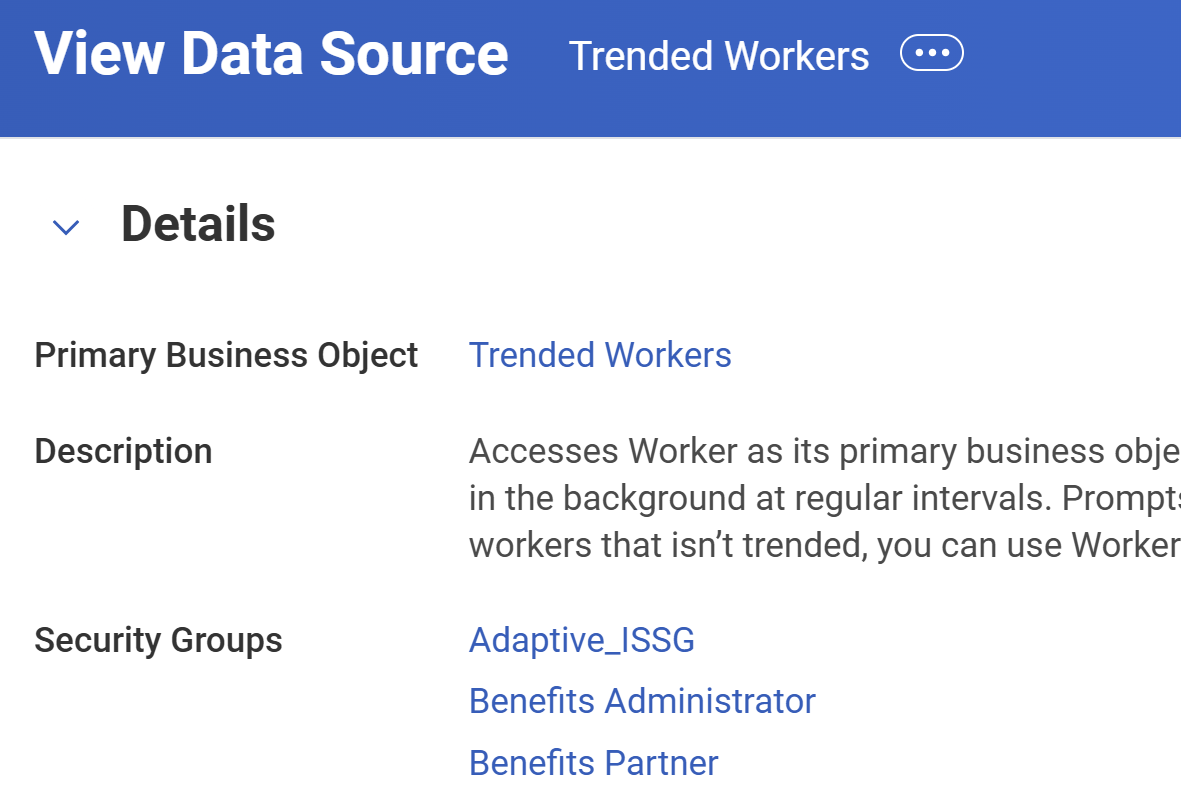
- An external link will open in a new tab with theView Data Sourcereport.
- From the report, you can review all the data source's details, including its primary business object, as shown in the image below.
Visualizations Defined
A visualization is a graphical or textual representation of certain fields selected from a data source. Visualizations might be charts, tables, or more. You would use visualizations to explore and analyze your data interactively.
Each visualization on a sheet can be:
- Related: Use same underlying data source and data source filter.
- Unrelated: Use different data source and data source filter.
The first step to creating a visualization on a discovery board is to select a data source. To display data in that visualization, drag and drop fields into the appropriate drop zones. Visualizations display inside panels (or boxes) in the workspace area of a Discovery Board sheet.
Visualization Configuration
To configure your visualizations, select the Edit button, as highlighted in the image below.
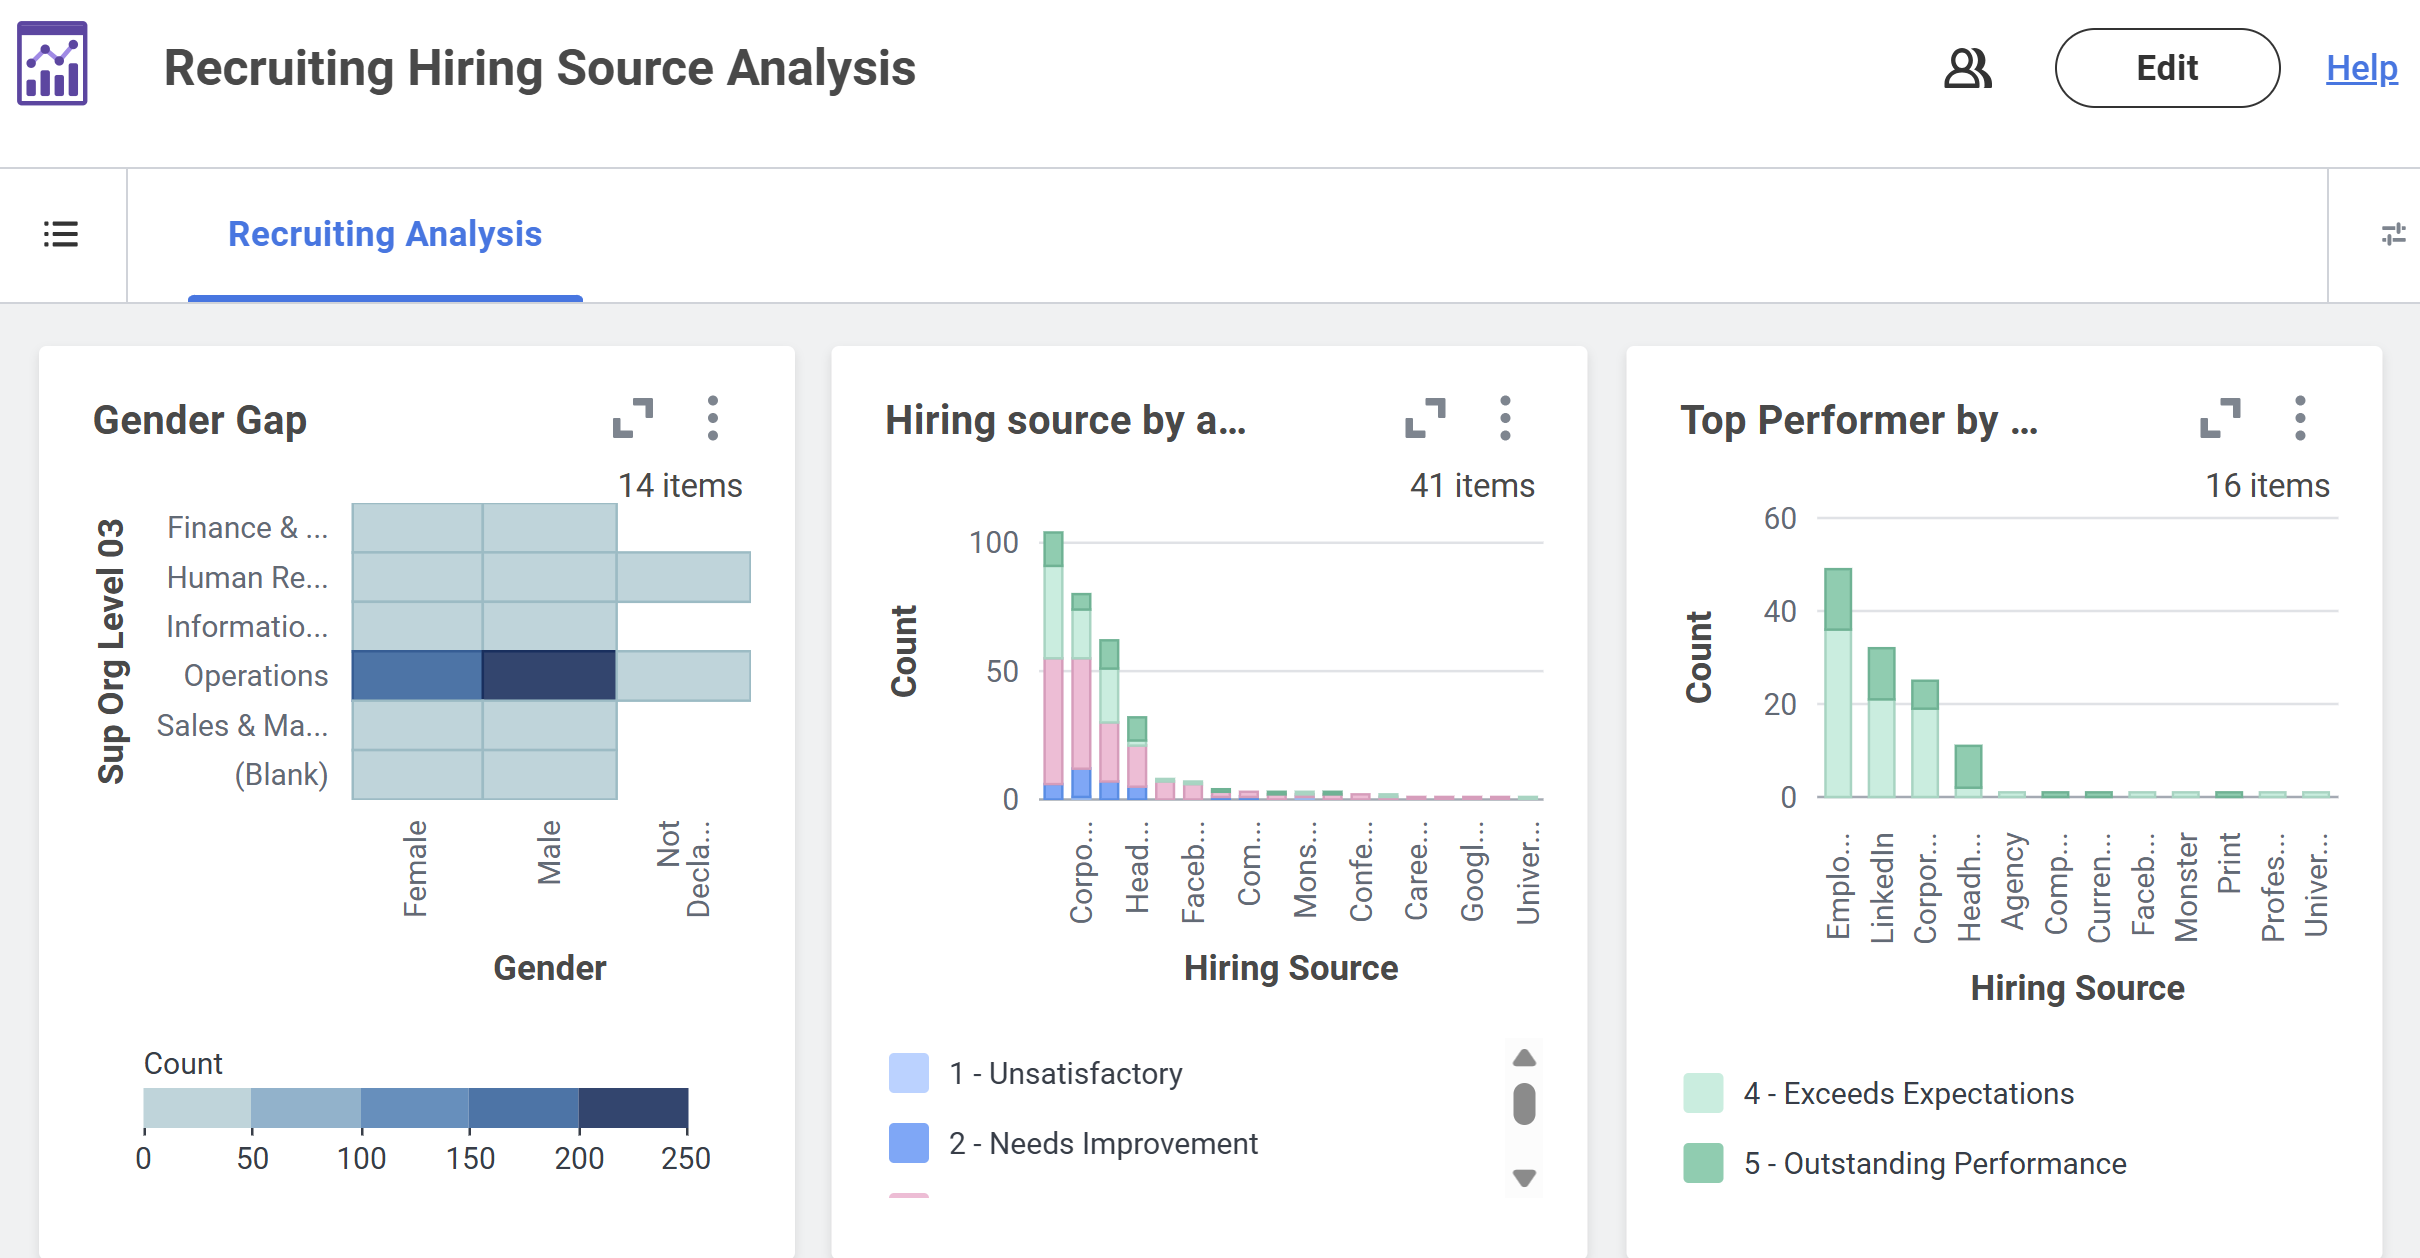
Edit button for a discovery board
Once you select Edit, the system provides you the option to:
- Add visualizations to a sheet. (Note: Each sheet can display up to 10 visualizations.)
- Change the viz type.
- Change the data source, data source filter, or fields on a viz.
- Format the dimensions (X-Axis, Y-Axis, Color, etc.) on a viz.
- Apply a filter to your sheet or viz.
- Create or edit a control.
- Format a compatible visualization.
- Edit the discovery board name.
- Enter or edit the discovery board description.
Visualization Types
The visualization type determines the drop zones in the Builder Panel and how the data is visually displayed in the visualization. There are many types of visualizations available in Discovery Boards.
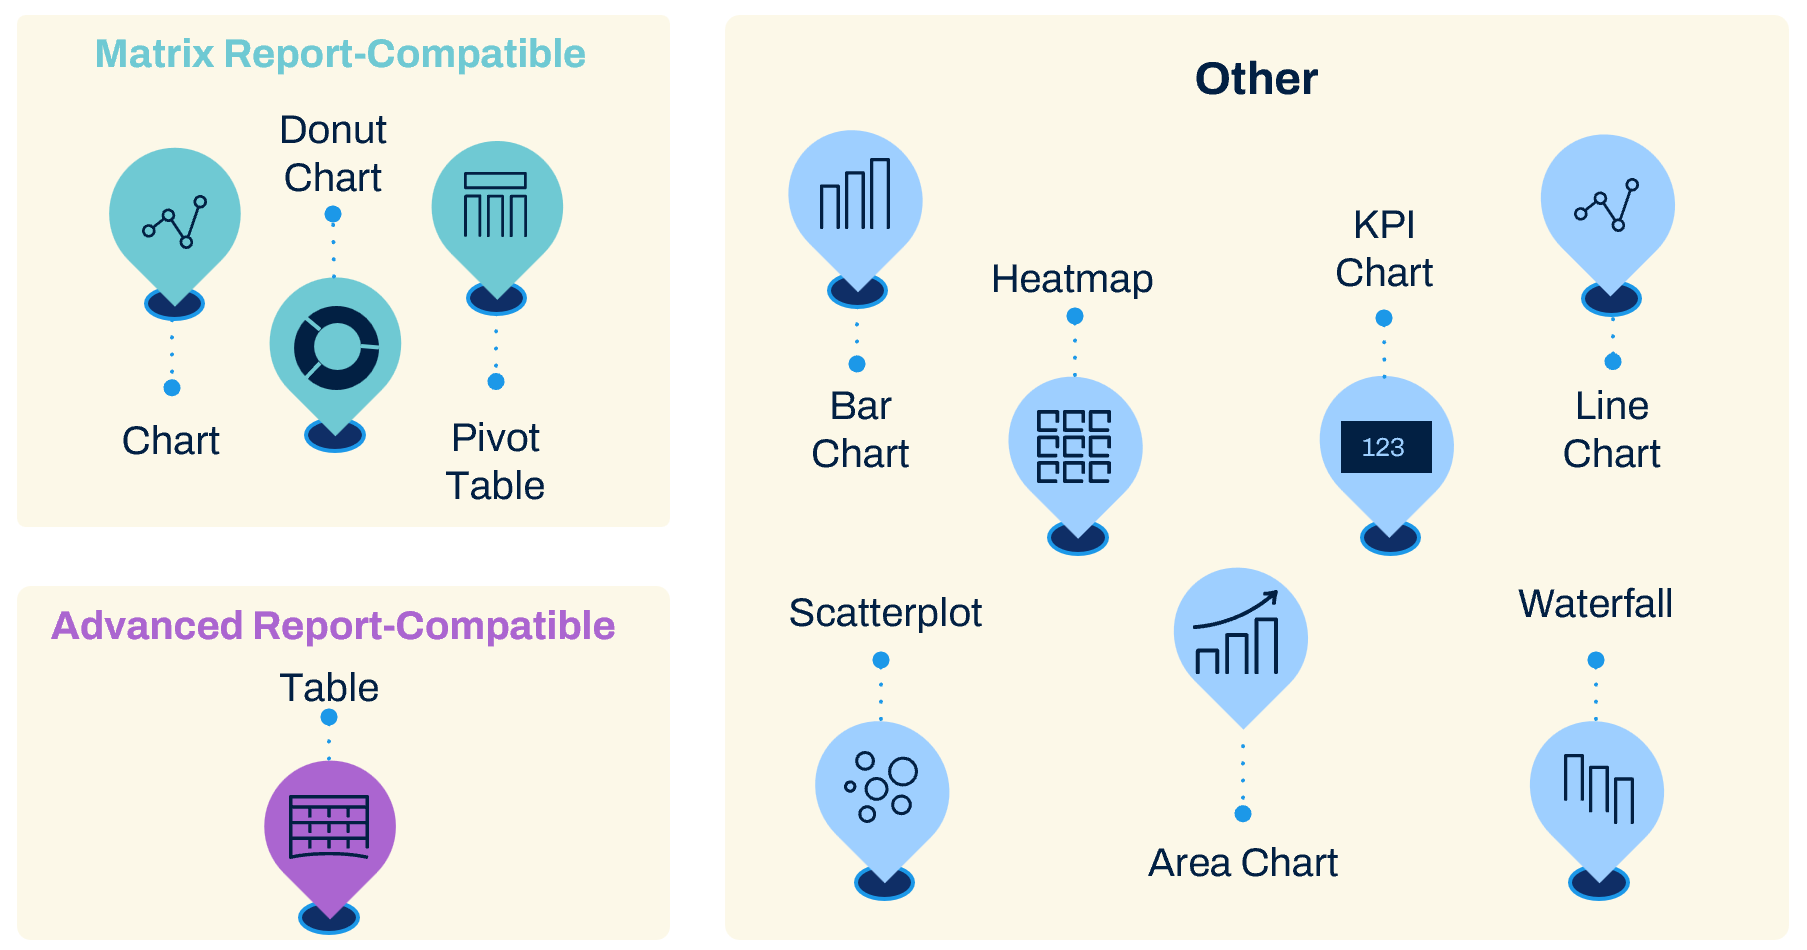
Workday provides several visualization types that enable you to decide how to explore and display the data. Some visualization types are compatible with custom reports, enabling you to export the visualization to either a Matrix or Advanced report. The system optimizes other visualization types for use in Discovery Boards only. You are not able to export these types to custom reports.
Matrix Report-Compatible
When you export a matrix report-compatible visualization type to a custom report, Workday creates a matrix report. The matrix report-compatible visualizations for Discovery Boards include:
- Chart
- Donut Chart
- Pivot Table
Visualization Type | System Icon | Description |
|---|---|---|
Chart | 
|
|
Donut Chart | 
|
|
Pivot Table | 
|
|
Chart Visualization Mark Types
In a Chart visualization, Workday displays the data as a collection of marks. A mark is the visual representation of a metric value calculated for a group of input rows. The mark type controls the shape of data in a chart visualization and how the system will visually represent those data points. When you create a chart in a discovery board, you can select the mark type from the Marks menu. How Workday renders a particular chart depends on the mark type and placements of summarization and attribute fields in the drop zones.
The following table displays the different mark types you can use in a Chart visualization:
Mark Type | Description |
|---|---|
Area |
|
Bar |
|
Line |
|
Point |
|
Auto | The system selects the best mark type based on the fields in the drop zones. |
You can adjust the size of Point mark types in the Chart and Scatterplot visualizations. To adjust the size based on the field value per mark, add a summarization field to the Size drop zone.
- Select a Scatterplot visualization or a Chart viz with Point as the mark type.
- Drag a summarization field from the field panel to the Size drop zone.
Advanced Report-Compatible
This Table visualization type exports to an advanced custom report. Its format is closest to a Comma-Separated Values (CSV) file or plain text format.
Visualization Type | System Icon | Description |
|---|---|---|
Table | 
|
|
Other Visualization Types
Workday optimizes the following visualization types for use in Discovery Boards. You will not be able to export these visualization types to custom reports:
Visualization Type | System Icon | Description |
|---|---|---|
Area Chart | 
|
|
Bar Chart | 
|
|
Heatmap | 
|
|
KPI Chart | 
|
|
Line Chart | 
| Line Charts display metrics connected by line segments as a continuum, typically as a trend over time. |
Scatterplot | 
|
|
Waterfall | 
|
|
KPI Setup Options
When you create or edit a KPI visualization, you can configure the following KPI-specific options:
- The variance (difference) between the base measure and the comparison measure.Note: To display the variance, include a field in the Comparison Measure drop zone.
- The variance (difference) between the metrics from a base time period and a comparison time period.Note: To display the variance, you must include a field in the Date drop zone.
- A visual indicator showing progress toward the intended result.
- Visual indicators use color and shape to indicate progress.
- You can add rules that define when the current value is:
- Expected
- Warning
- Critical
Follow these steps to configure a KPI visualization:
- Select a KPI visualization.
- Select the Configuration Panel icon.
- In the Comparison Measure or Period Comparison section, define how to calculate the variance.
- (Optional) Choose how to display the variance. You can display it as a numeric value, percentage, or none. For percentages, set the number of decimal places to display in the Decimal Precision field.
- (Optional) Define the base and comparison periods for time period comparison using dynamic or static dates. To configure dynamic dates, select the Base Period or Comparison Period's Related Actions and enable or disable the Use Dynamic Dates toggle.
- (Optional) From the Base Period or Comparison Period's Related Actions menu, enable or disable Show Date Ranges of Visualization toggle. This allows you to view or hide the date ranges for the base period and/or comparison period on the viz.
- (Optional) Select the Indicators section, and add one or more rules that define progress toward the intended result.
- Select which value to evaluate against in each rule, either the Base measure value or Percentage of target. For date values, select Base Measure Value, Variance as a Value, or Variance as a Percentage.
- In the first rule, define the rule conditions by selecting the comparison operator, comparison value, and visual indicator to display.
- (Optional) Select Add Rule to add another rule.
- To change the order of rules, select the handle on the right side of a rule and drag the rule into the desired position.
Important
: Workday evaluates the rules in order, starting at the top. The visualization displays the indicator for the first matching rule.Waterfall Setup Options
When you create or edit a Waterfall viz, you can configure how to display the data and labels the visualization.
You can create a Waterfall viz using either of these methods:
- One field each in the Measures and Dimensions drop zones. Workday displays how the values of a dimension field incrementally increase or decrease the value of a measure field.Example: You can perform expense analysis by the categories defined in a single dimension field. You can change the sort order of the dimension field values.
- Multiple fields in the Measures drop zone. Workday displays each field in order on the x-axis, using the top field as the starting value. You can change their order by changing the order of the fields in the Measures drop zone.
The method you use to create a Waterfall viz determines the viz options you can configure.
After selecting your fields and placing them in the appropriate drop zones, you can further configure your waterfall visualization. To do this, follow these steps:
- Select the Waterfall visualization.
- Select the Viz Options button.
- Depending on the configuration of your Waterfall viz, the system displays the following options:OptionDescriptionShow data labelsDisplay the data value as text above each incremental increase or decrease.Display start labelIn a waterfall viz, the system always shows the first value as the start value (represented in the viz legend). You can hide the start value and represent the first value as an increase or a decrease instead.Hide totalHide the total value, which displays the cumulative effect of all increments in the last bar using a separate color.Sort Order(Dimension drop zone only) Select how to sort the values from the field in the Dimensions drop zone.You can sort the data alphabetically, logically, or numerically in ascending or descending order.Limit(Dimension drop zone only) You can apply a limit on the number of field values displayed on the axis with the dimension field.Explore the Workday Community Administrator Guide for details on how to limit a viz to the top N values. Search for Limit Viz to the Top N Values.Axis display namesOverride the default names that display on the x-axis and y-axis of the viz.Measure display namesOverride the default display names for each field in the Measures drop zone.When the viz has multiple fields in the Measures drop zone, Workday uses these display names for the first measure and each incremental measure.Label display nameOverride the default display name for the total value (if included).
Tip
: Select the Reset to default option to reset an overridden display name.Create a Discovery Board and Visualizations
When you create a new discovery board, Workday adds it to your list of files on the My Files tab in Drive. The discovery board contains one empty visualization to begin your analysis. Once you have set up the discovery board, you may open it to edit the empty visualization and add more visualizations as desired.
Steps to Create a Discovery Board
Follow these steps to create a new discovery board:
- Access Drive from your profile menu on the Home page.
- Select the Add New (+ New) button and select Discovery Board.Note: You can also duplicate an existing discovery board by right-clicking it and selecting Make a Copy.
- Enter a name for your new discovery board.
- Select Create.
Steps to Create or Edit a Visualization
Once you have created the discovery board, you can open it and edit the empty visualization and add more visualizations as desired. Follow these steps to create a visualization:
- Access Workday Drive from the profile menu on the Home page.
- Select the discovery board you want to edit.
- Select the Edit button on the right side of the Discovery Board workspace.
- From the Data Source Panel, set up the visualization data source from the list of data sources provided. You may have to choose a required data source filter or prompt value.
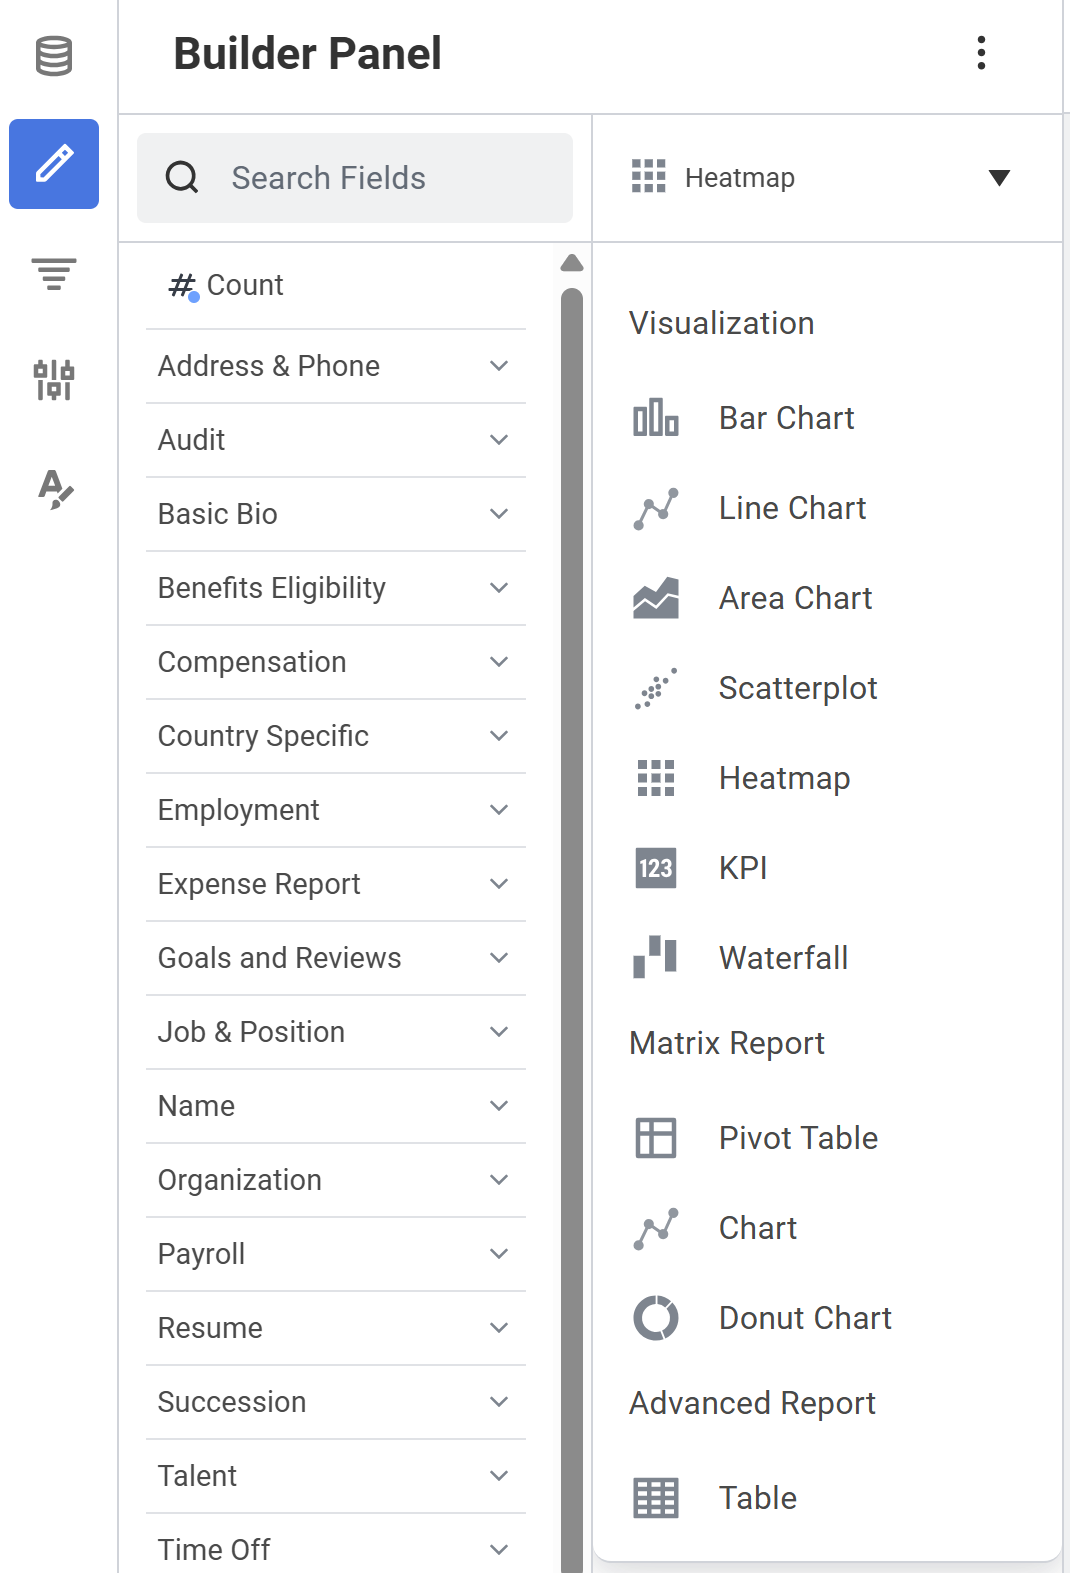
- From the Builder Panel, select the Visualization Type Options arrow to select a visualization type. Choose from: Bar Chart, Line Chart, Area Chart, Scatterplot, Heatmap, KPI, Waterfall, Pivot Table, Chart Donut Chart, and Table, as shown in the image.
- Drag and drop the fields into the drop zones to analyze the data. In the image of the Bar Chart below, you can drop any compatible field from the field list into the X-Axis, Y-Axis, and Color drop zones to build your viz.
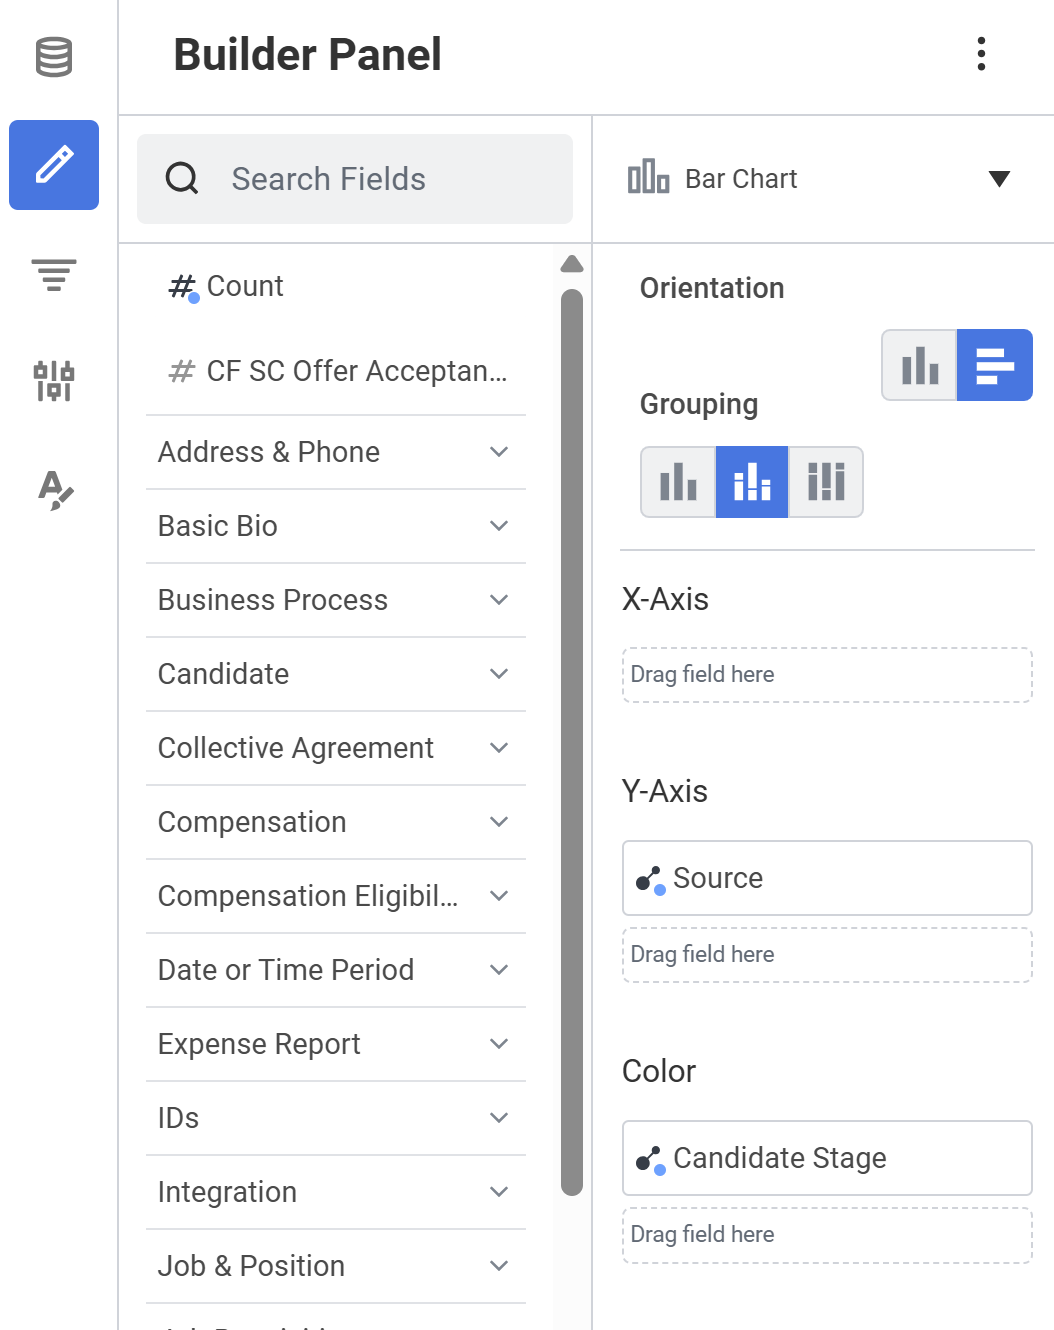 Note: You may need to select a summarization field in order to successfully drop the field into a drop zone. Expand the field options by selecting the double chevron icon to the right of the field name. Then choose your summarization field (e.g. SUM, AVG, MIN, MAX, MEDIAN, and PERCENTILE).
 - Optionally, you can display administrator-configured curated field or data source lists. Select the Data Source Panel or Builder Panel's Related Actions (three vertical dots) and enable the 'Show only curated fields' or 'Show only curated data sources' toggle. When you disable these options, Workday displays all available fields and data sources to the Discovery Board user.
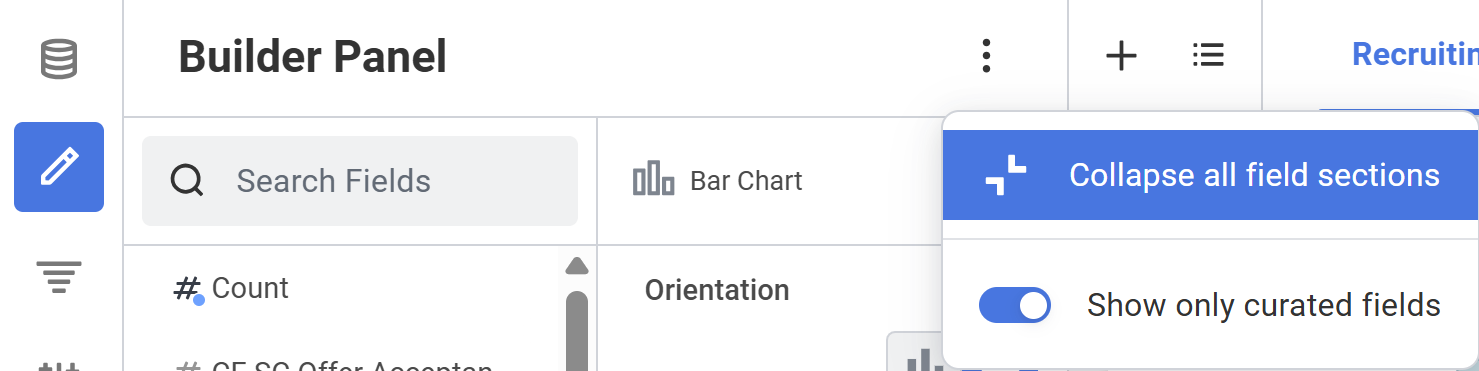 Note: Discovery Board administrators can configure curated field lists for the primary business object of the data source using theMaintain Field Lists for Reportingreport. You can also configure curated data source lists for the primary business object using theMaintain Data Source list for Discovery Boardsreport.
Group Data by Color in a Viz
For some visualization types, you can add a field to the Color dimension to encode the marks so the groups are visually differentiated. Each group's color displays as a legend in the visualization. Most visualization types, such as Chart and Donut Chart, accept an attribute field in the Color dimension, which creates additional groupings. Heatmap visualizations accept a summarization field in the Color dimension.
Steps:
- For Area Chart, Bar Chart, Chart, and Line Chart visualizations, select a visualization with at least one attribute field in the X-Axis drop zone.
- For Donut Chart visualizations, select a visualization with a summarization field in the Angle drop zone.
- Drag and drop a field in the Color drop zone.
Example
: In a Chart visualization, you can place the Hiring Source field in the x-axis and the Rating - Current field in the Color drop zone. The visualization groups workers by hiring source. Workday assigns a different color for each current rating, and defines each color in the legend below the viz, as shown in the image.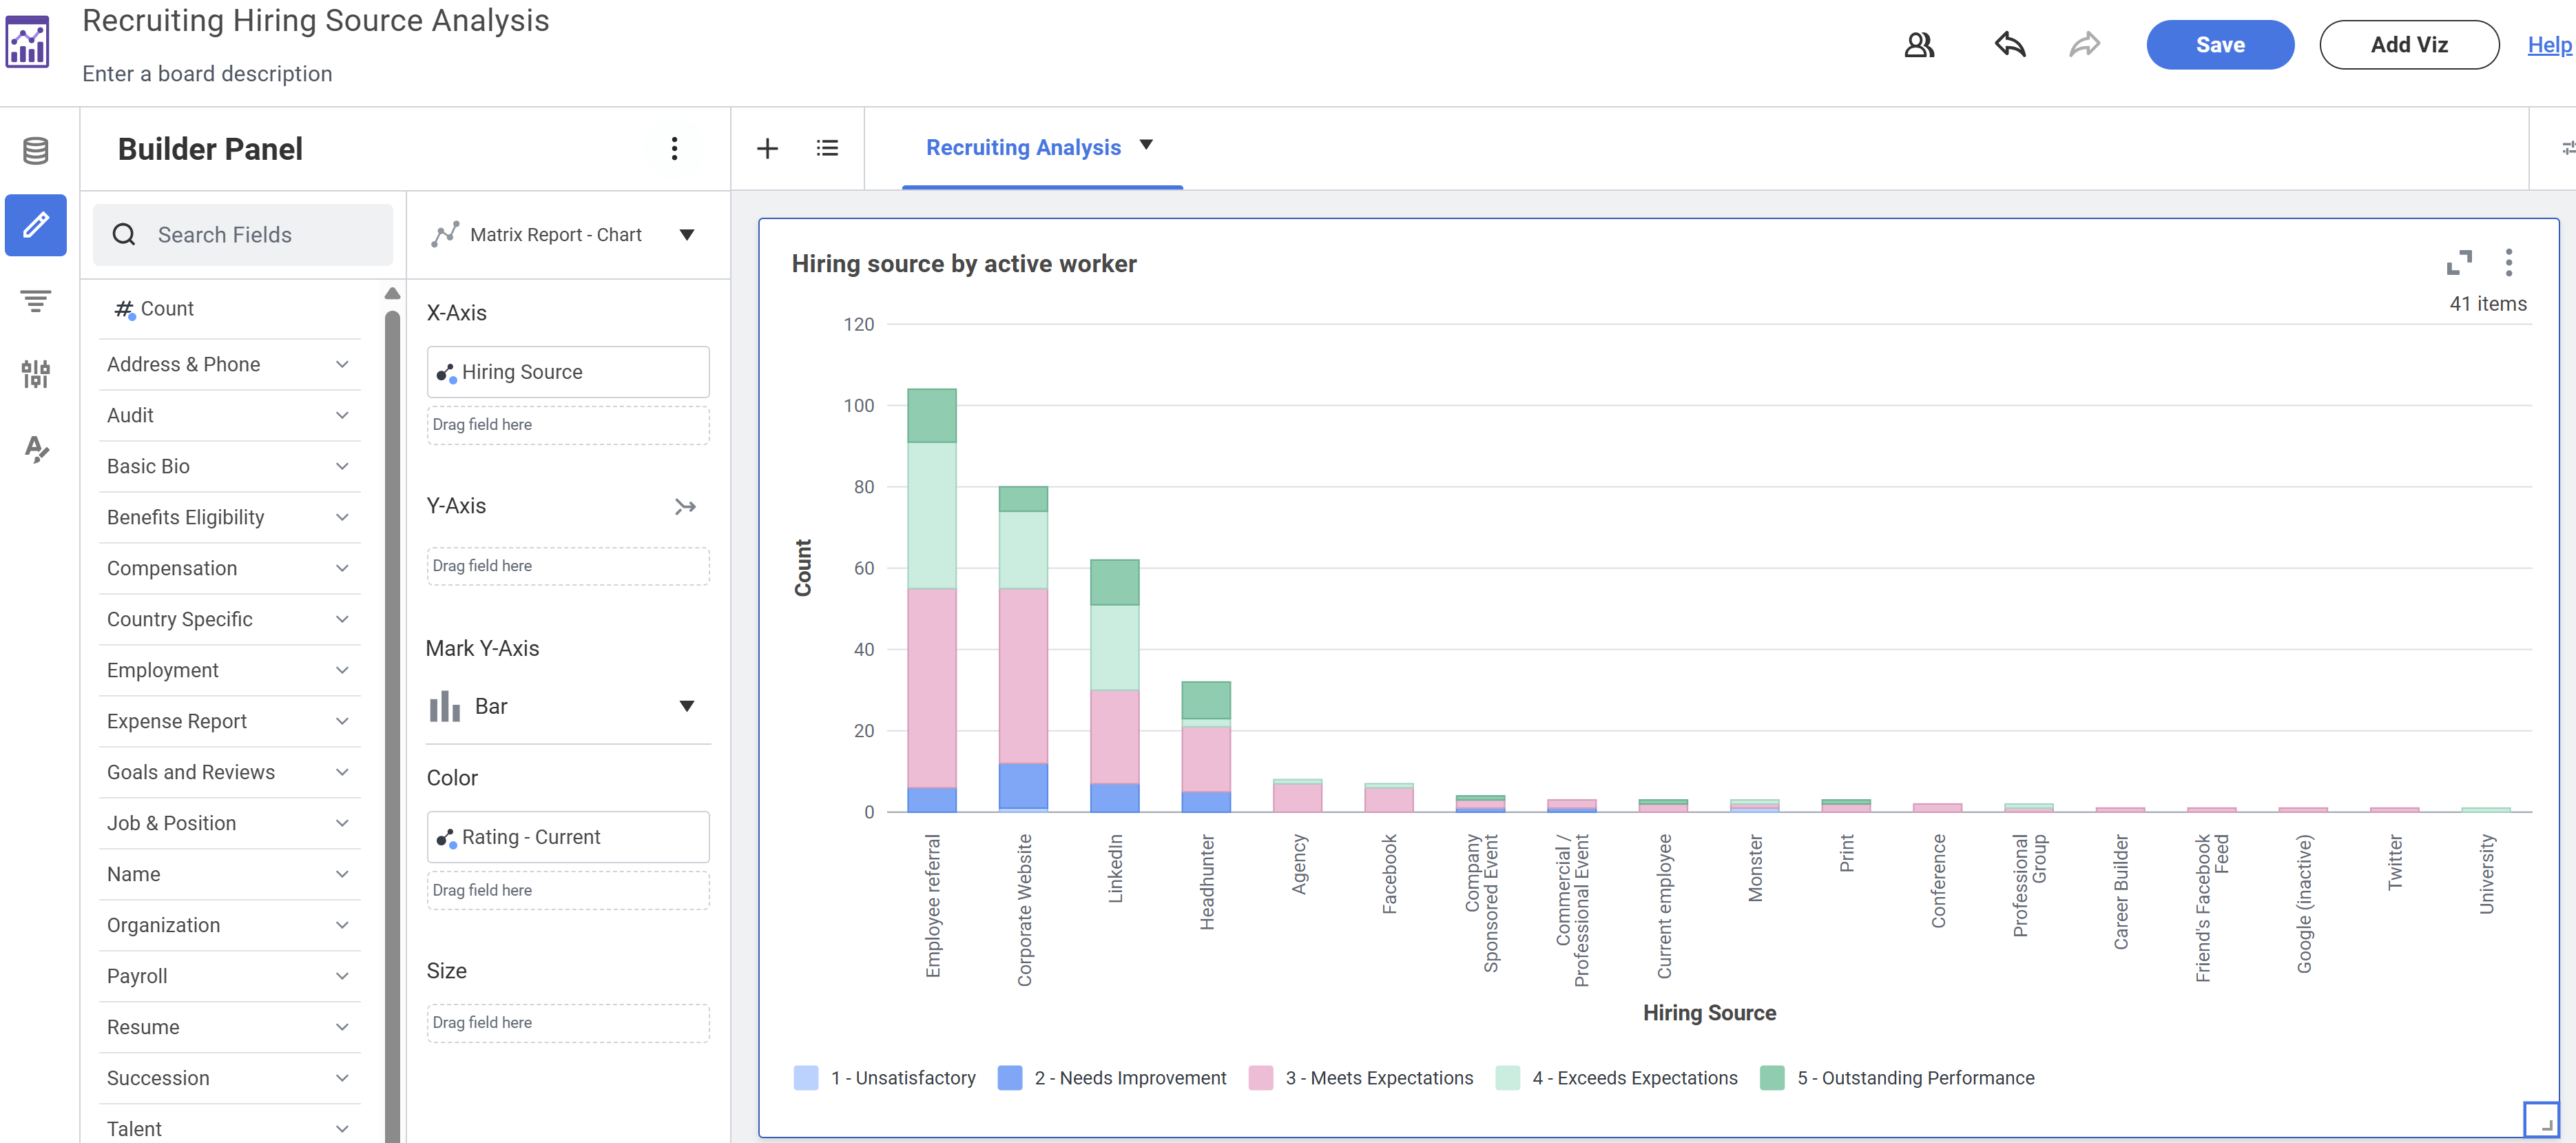
Change Field Name in a Visualization
When you add a field to a visualization, Workday displays the field name in the visualization. You can change the display name of any field used.
Changing the field name depends on the visualization type.
- For all graphical visualization types (except KPI and Waterfall), expand the X-Axis, Y-Axis, Angle, or Color section from the Configuration Panel.
- For a Table and Pivot Table visualization, hover over the field in the drop zone. Select Field Options in the field menu of a field placed in the Rows, Columns, or Summary Fields drop zone.
- Enter a display name.
Configure the Displayed Data
In the Configuration Panel, you can configure how the data displays in a visualization (except tables). You can edit the axis display name, limit the number of groupings, summarize the remaining values, and change the sort order of the data. You can also configure a field's options from the Builder Panel. To do this, hover over the field in the drop zone and select the Field Options button. The available options will depend on the viz type and dimension you are configuring.
Depending on the viz you select, the following options may appear in the Configuration Panel:
Sort the Data
Limiting data in a visualization works with how you sort the data. So, you can change how you sort the data when you edit the limit settings.
You can sort attribute data in a visualization to arrange the data in a meaningful order for analysis. When you add fields to a visualization, Workday automatically sorts the data alphabetically (chronologically and numerically for date and numeric fields) in ascending order.
Select a visualization with at least one attribute field in a drop zone. For each visualization type, complete the given step:
If the Visualization Type is... | Perform this action: |
|---|---|
Area Chart, Bar Chart, Chart, Heatmap, and Line Chart |
|
Donut Chart and Scatterplot |
|
Pivot Table |
|
Table |
|
Finally, select the Sort Order.
Filter the Data
You can constrain data in a visualization by filtering on an attribute field. Visualization filters enable you to filter data in a single visualization. Sheet filters enable you to filter data on all visualizations in the sheet that use the same data source and data source filter.
Note
: As you filter data in a visualization, keep in mind that some filter operators will be slower than others. Also, Workday applies the filters in the order listed in the filter panel. Therefore, consider placing filter conditions that constrain the largest amount of data toward the top of the filter panel for better performance.You can create multiple sheet and visualization filters on a field. You can apply an AND or OR condition to all filters that apply to a visualization.
After you create a sheet or visualization filter, the Filter Panel enables you to:
- Determine the value dynamically. You can then select a dynamic field on the Global business object to determine the value dynamically.
- Apply the filter to a different level. For example, you can convert a visualization filter from the viz level to the sheet level by selecting Move to Sheet.
- Create a control to make the filter visible in view mode.
- Remove the filter from the discovery board.
- Temporarily disable the filter. You might want to disable a filter to view the unfiltered data without removing the filter.
Another way to filter data in a visualization is to apply a limit on the number of attribute values displayed. You can limit attribute values in the following viz types:
- Area Chart
- Bar Chart
- Chart
- Donut Chart
- Heatmap
- Line Chart
- Scatterplot
- Pivot Table
Steps to Filter Data in a Visualization
To filter data in a visualization, follow these steps:
- Access your discovery board from Drive.
- Select a visualization that uses the combination of data source and data source filter you want to filter.
- On the left side of the workspace, select the Filter Panel icon.
- In the Sheet Filters or Viz Filters section, select Add Filter.
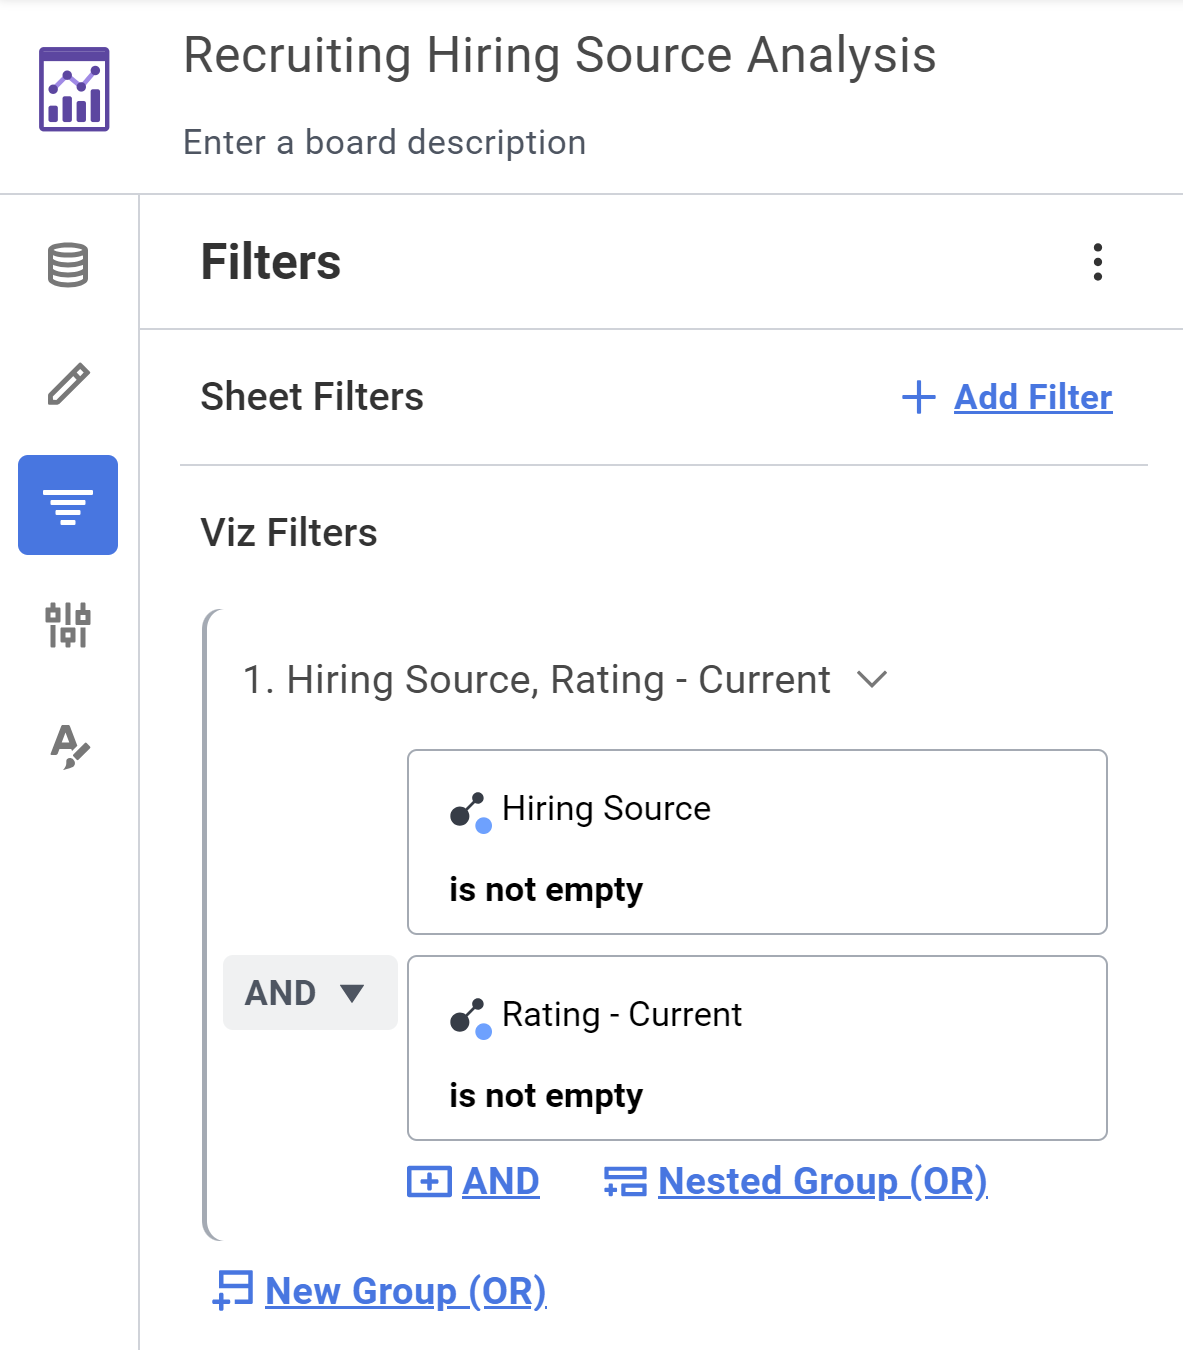
- Add fields and values. The example below shows two viz level filters for the Hiring Source and Rating - Current fields with an AND condition.
- Consider the following as you complete the task:OptionDescriptionFieldSelect the field you want to evaluate based on the related business object. Workday does not support lookup date rollup calculated fields on sheet or viz filters.Filter OperatorAvailable operators depend on the field.Filter ValuesAvailable options depend on the field and filter operator.AND/OR Filter ConditionsUse a combination of AND/OR filter conditions on viz or sheet level.Nested GroupAdd a nested filter group at each filter level.
- (Optional) You can enable the Determine Value Dynamically toggle from the filter menu to change the field to a dynamic field. When selected, adjust the dynamic filter field, operator, and values according to your needs.
- (Optional) You can select Create Control and Link from the filter's options menu to create a control in the Control panel. You cannot add a dynamic filter as a control.
Tip
: You can temporarily turn off the filter without removing it by selecting Disable from the filter menu. From the filter menu, select:- Move to Sheet to promote a visualization filter to a sheet filter.
- Move to Viz to demote a sheet filter to a visualization filter.
Dynamic Filters
Rather than specifying a static date or date range, you can dynamically determine a discovery board filter value. You can apply dynamic data in two places on a discovery board:
- The viz or sheet's filter in the Filter Panel.
- A data source prompt on the Data Source Panel.
Note
: The selected dynamic field must be on the Global business object. You cannot link dynamic filters to the Control panel.To apply a dynamic filter:
- Select the Related Actions (three vertical dots) next to the added filter or prompt.
- Enable the 'Determine value dynamically' toggle.
- Select a valid dynamic value.
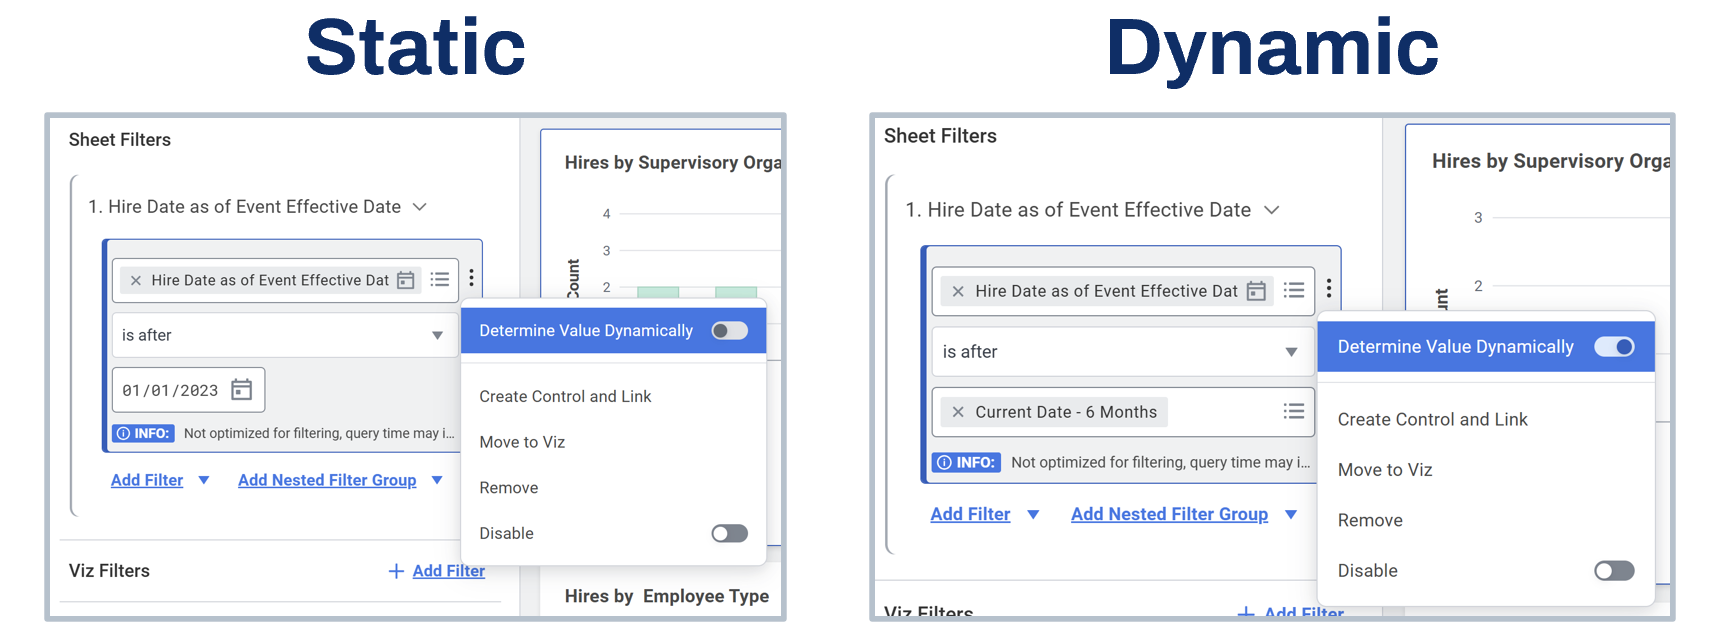
The example comparison shows a sheet filter on a viz that analyzes hires by supervisory organization. When you disable the Determined Values Dynamically toggle (the default option), the returned data displays hires with a hire date after the static date of 01/01/2023. However, when you enable the Determine Values Dynamically toggle, the returned data displays hires with a hire date after the current date minus six months.
Curated Data Sources
You can curate the data sources that the system lists in the Data Source Panel in the discovery board workspace. It may be helpful to curate a list if you want to make it easier for discovery board users to view data sources available to them. If you create a data source list, the system displays the curated list by default. Users can disable the Show only curated data sources toggle to display all data sources. This option is available on the discovery board's Related Actions (three vertical dots) next to the Share icon.
Security Note
: To set up curated data source lists, you must first have permissions to the Discovery Boards: Manage Curated Data Source List subdomain in the System functional area.You can review all available data sources in Discovery Boards by:
- Creating a custom report on the All Data Sources data source and filtering using the new field Is Valid for Data Discovery = Yes.
- Accessing theMaintain Data Source list for Discovery Boardstask and selecting Add Data Sources.
Steps to Set Up Curated Data Sources
Follow these steps to create a curated data source list:
- Access theMaintain Data Source List for Discovery Boardsreport.
- Select Add Data Sources.
- Select the data sources to display on your discovery board.Note: The Data Sources to Add grid only displays data sources that Discovery Boards supports.
- Select Enable in Discovery Boards.
When you create a discovery board, Workday will now display the curated data source list in the Data Source Panel by default.
To modify the list:
- Access theMaintain Data Source List for Discovery Boardsreport.
- Select the Add Data Sources or Remove Data Sources button.Note: The Data Sources to Remove grid displays the data sources currently on the curated data sources list.
To disable the list:
- Access theMaintain Data Source List for Discovery Boardsreport.
- Select Disable in Discovery Boards.
Curated Field Lists
A curated field list is a grouping of carefully chosen organized fields that display in the Discovery Board workspace. These field lists are curated on the object level. Each business object has its own curated Field list, Drill By field list, and Show Details field list, which you can enable or disable. You can configure curated field lists to make it easier for Discovery Board editors to find the correct fields when building visualizations. For all visualizations, except tables, you can perform better ad hoc analysis and reporting by configuring fields to drill into and view details for.
Security Note
: To set up curated field lists, you will need security permissions to these domains in the System functional area:- Discovery Boards: Manage Curated Data Source Field List
- Discovery Boards: Manage Drilling Field Lists
Workday displays curated fields when you build visualizations if the data source has a primary business object with a curated field list configured. Also, you will have options on the visualization to drill into and view details for your data.
Tip
: When you select your data source, view the Data Source Details section to determine what the primary business object is for that data source.Steps to Set Up Curated Field Lists
To set up a curated field list on the object level, complete the following steps:
- Access theMaintain Field Lists for Reportingreport.Note:The course videos reference theMaintain Field Lists for Discovery Boardsreport. As of 25R2, this report has been replaced with theMaintain Field Lists for Reportingreport.
- In the Functional Area field, select Discovery Board.
- Select a business object on which to base the curated field list.Note: All data sources with the primary business object you select share the same curated field list.
- Complete the Data Source Fields tab:OptionDescriptionEnable in Discovery Boards(Available after you add fields to the curated field list)Select to enable the curated list that you configured in Discovery Boards. Once selected, you can select Disable in Discovery Boards to disable the curated field list. From the discovery board's Related Actions menu (three horizontal dots), you can disable the "Show only curated fields" toggle to display all available fields. Enable the toggle to display only the fields configured in the curated field list.Add FieldsSelect to access theAdd Fields to Data Source Field List for Discovery Boardstask. The Fields to Add grid displays all fields available to populate the curated field list.Remove Fields(Available after you add fields to the curated field list)Select to access theRemove Fields from Data Source Field List for Discovery Boardstask. The Fields to Remove grid displays the fields currently on the curated field list.Selected FieldsThe grid displays all fields in the curated field list that users view when creating visualizations. The Where Used column displays a usage count for each curated field. The count includes Workday internal development usages.
- In the Drill By Fields tab, select Edit Drill By Field List to access theEdit Drill By Field List for Discovery Boardstask.Note: You can manage the fields you use to drill into visualization measure data. If you do not configure fields on the Drill By Fields tab, Drill By will not display on visualizations.
- Complete the tab:OptionDescriptionEnable in Discovery BoardsSelect to enable the Drill By field list that you configured in Discovery Boards. Once selected, you can select Disable in Discovery Boards to display all available Drill By fields for the business object you selected.Selected Grouping FieldsThe grid displays all fields added to the Drill By field list that users view when creating visualizations. You can select the Default Sort for each field that determines the display order for the drill by fields. For example, when you select a drill by field in a visualization, Workday displays a new table. The new table displays the Default Sort you selected for the Drill By data.
- Discovery Boards does not support drilling on:
- Blank or Other values.
- Fields that you cannot filter on.
- Lookup prior value calculated fields.
- On the Show Details Fields tab, select Edit Show Details Field List to access theEdit Show Details Field List for Discovery Boardstask. You can manage the fields Workday displays when you view the details of a data point to the transaction level. If you do not configure fields on the Show Details Fields tab, Show Details will not display on visualizations.
- Complete the tab:OptionDescriptionEnable in Discovery BoardsSelect to enable the Show Details field list that you configured in Discovery Boards. Once selected, you can select Disable in Discovery Boards to disable the Show Details field list.Selected FieldsThe grid displays all fields added to the Show Details field list that users view when creating visualizations. You can select the Default Sort for each field that determines the display order for fields when you view details. For example, when you select Show Details on a visualization data point, Workday displays a new table. The new table displays the Default Sort option you selected for the show details data. To change the order of the Show Details fields displayed in a visualization, remove the fields, then add them in the desired order.
Drill By and Show Details Fields
You can drill into or show details for visualizations. When you do this, the system will display the data in a pivot table or table.
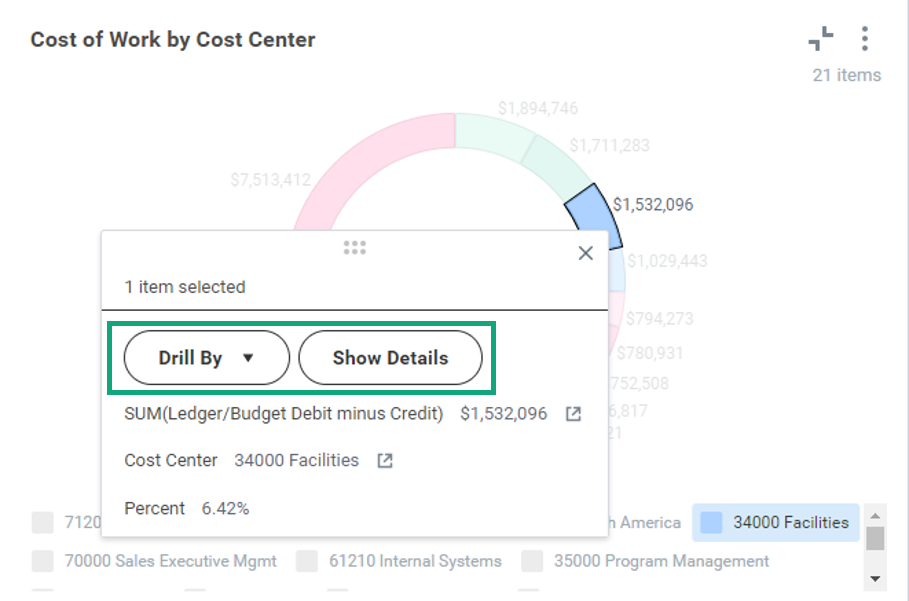
Drill By and Show Details options for a visualization
Select Add to Sheet to add a visualization of the tabular data to a sheet. If the visualization you drill into or view details for includes a lookup date rollup calculated field, Workday disables the Add to Sheet option.
Reminder
: Each sheet can display up to 10 visualizations.You can also select Create Report to create a custom report from a viz. However, keep in mind that Workday disables this option if the visualization you drill into or view details for includes a lookup date rollup calculated field. It will also disable the Create Report option if you do not have access to the Analytics Data: Report Fields and Values domain.
Finally, you can select the Download as CSV option to download your tabular data into a CSV format.
Override Drill By and Show Details
You can override the curated default Drill By and Show Details lists on the viz level, rather than editing the default lists on the object level. From the Configuration Panel in the Discovery Board workspace, you can customize which fields on the viz users can drill by or view detail data for. You can also choose to enable or disable Drill By or Show Details on a viz.
To override the Drill By and Show Details lists on a viz:
- Enable Drill By or Show Details from theMaintain Field Lists for Reportingreport.
- Navigate to the discovery board.
- Select Edit.
- Select the viz for which you want to override the Drill By or Show Details list.
- Select the Configuration Panel icon.
- Expand the Drill By or Show Details section.
- Enable the 'Override default fields and settings' toggle.
- To add a field to the overriding field list, select Add +. Select a field and sort order.
- To remove a field from the overriding field list, hover over a field and select the Related Actions (three vertical dots). Select Remove.
- To arrange the order of the fields, hover over field. Select the handle (an array of six dots) and drag and drop it to its new position.
To disable or enable Drill By or Show Details lists on a viz:
- Select the Configuration Panel icon.
- Select the 'Enable Show Details for this viz' toggle to turn the feature on or off.
- Select the 'Enable Drill By for this viz' toggle to turn the feature on or off.
Any changes you make in the Configuration Panel affect the viz immediately.
Sharing Discovery Boards
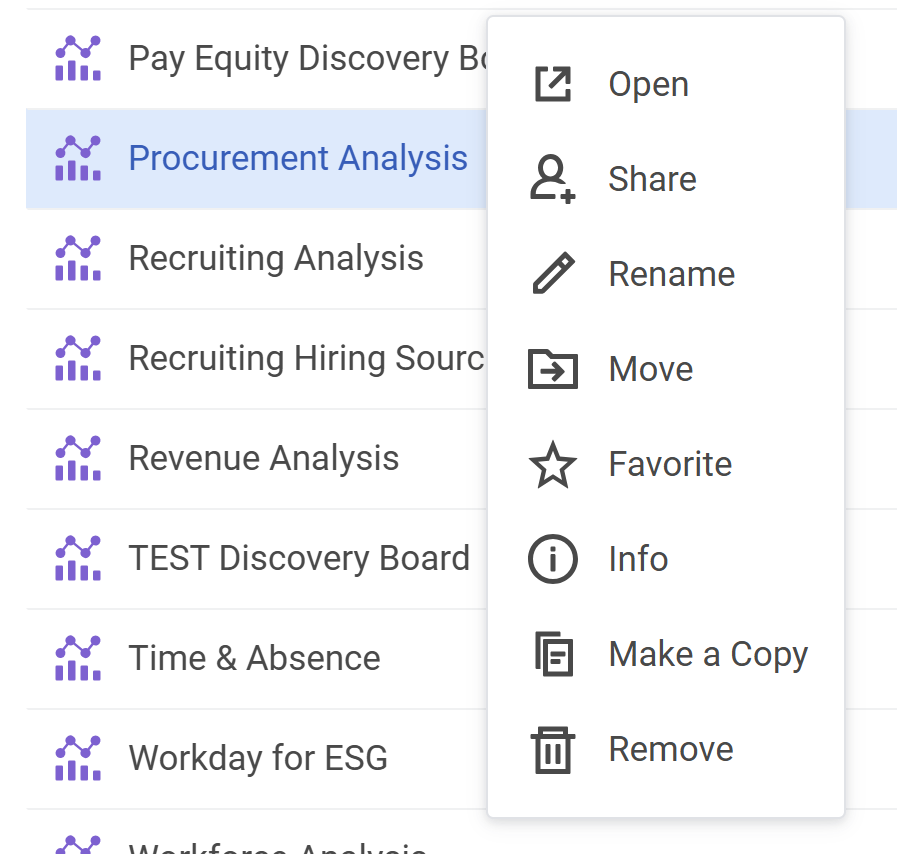
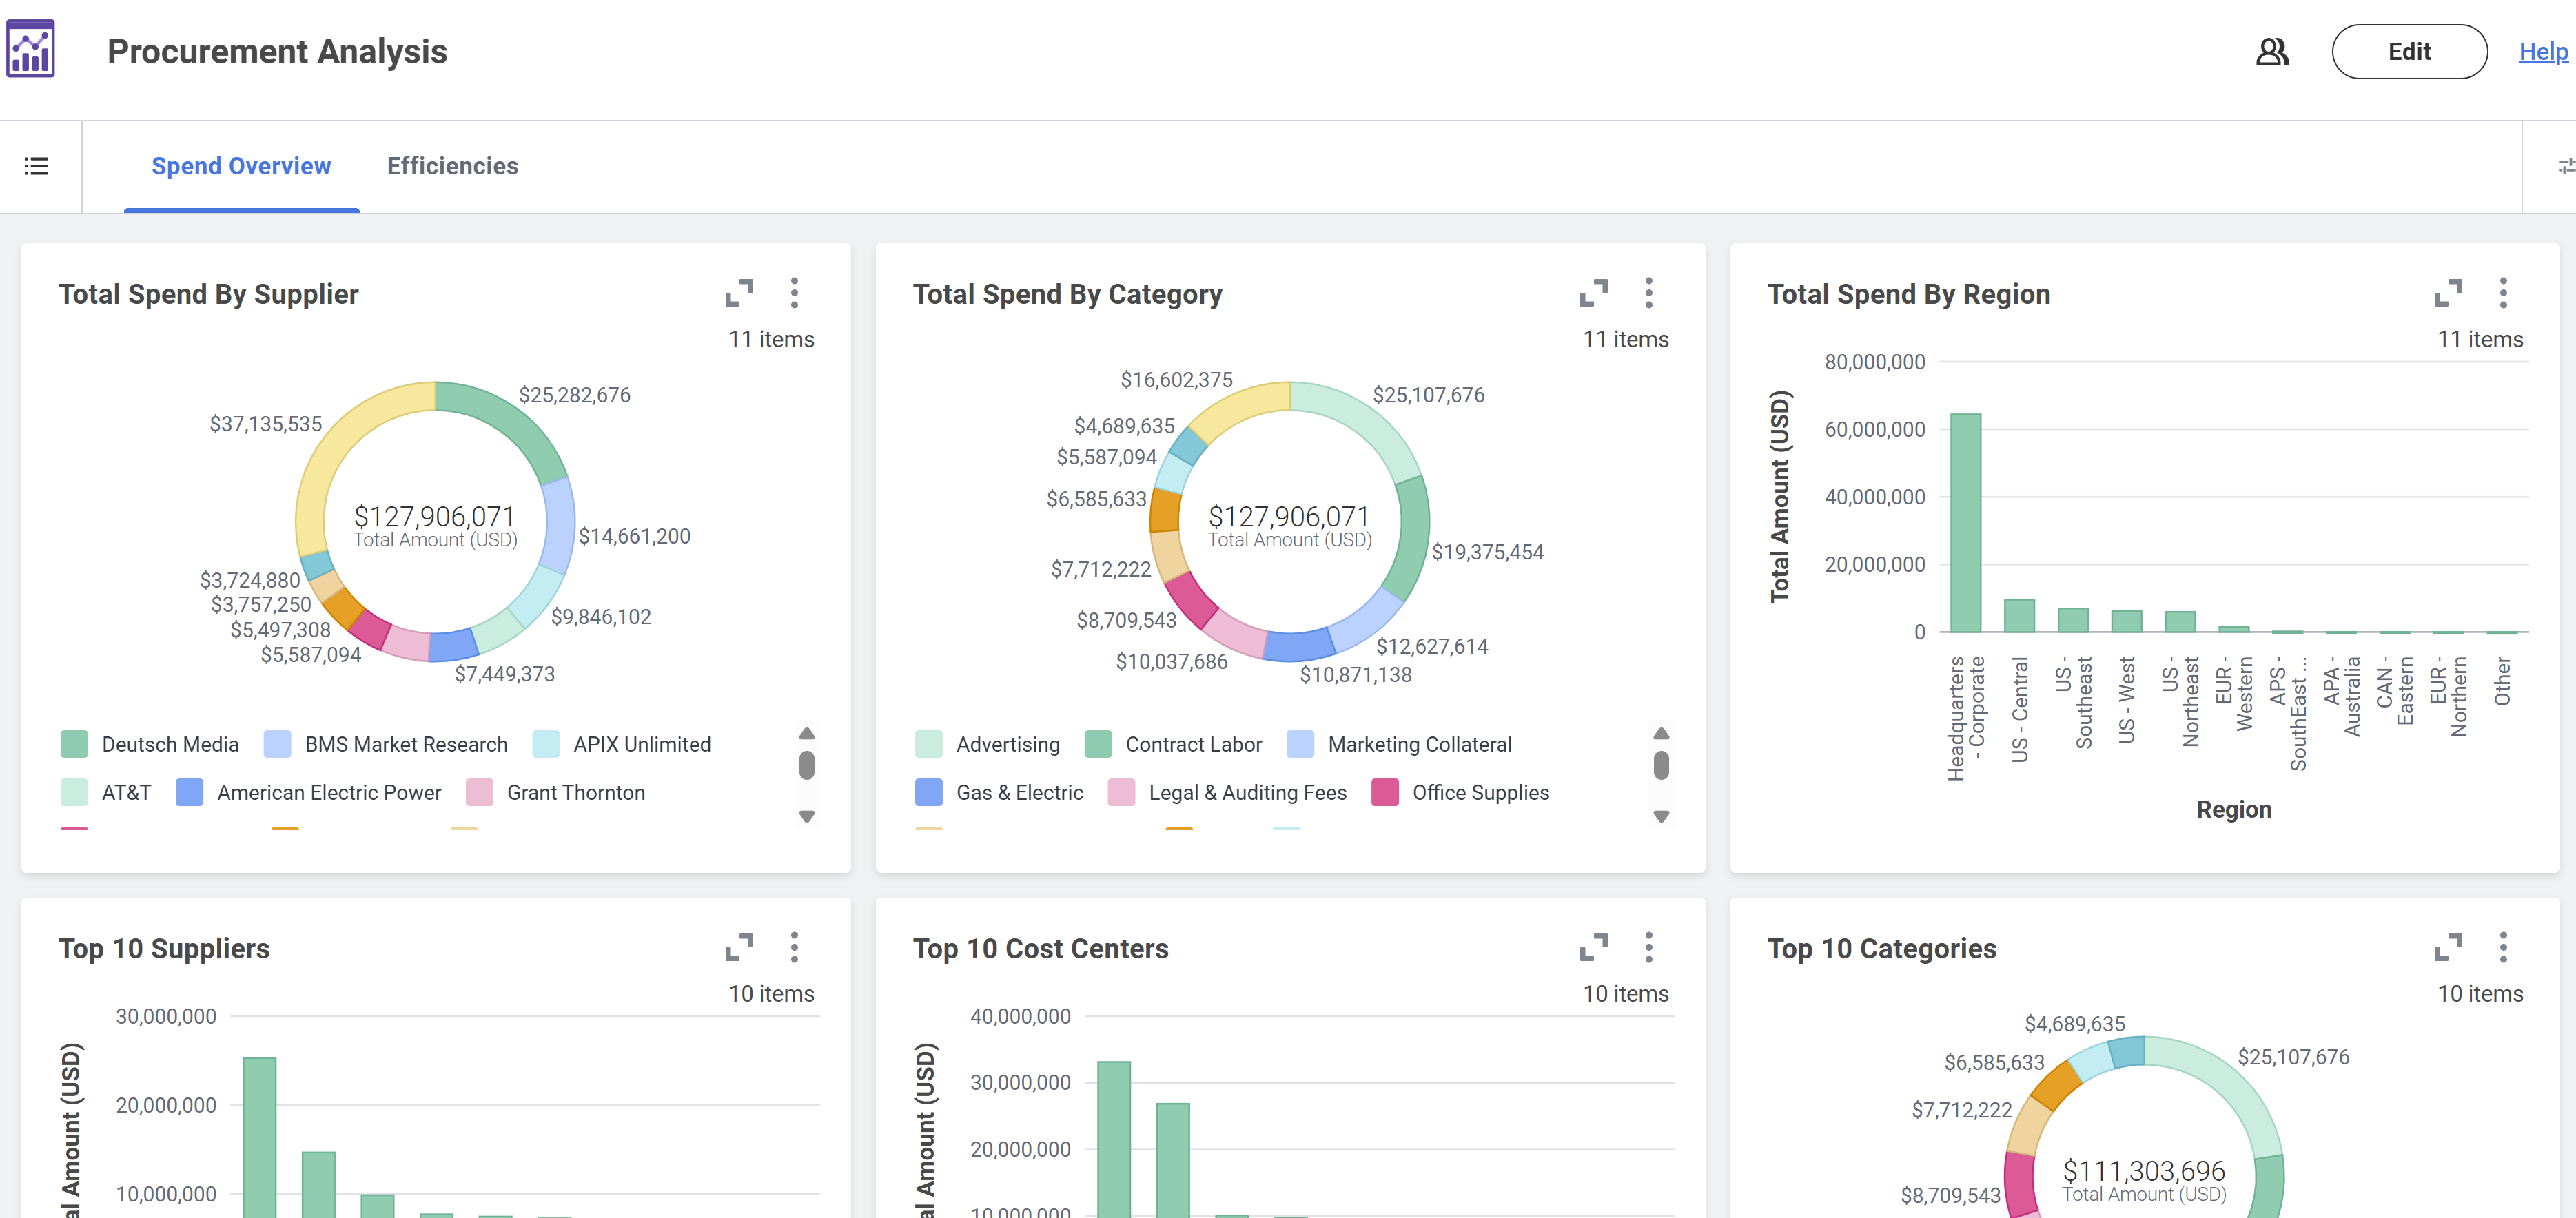
You can share discovery boards. By default, the creator of a discovery board is the owner. The owner can share a discovery board with other users by right-clicking (or selecting Shift + F10 on your keyboard) the discovery board and selecting Share. The owner can also share directly from the workspace by selecting the Share icon, as shown in the images below.
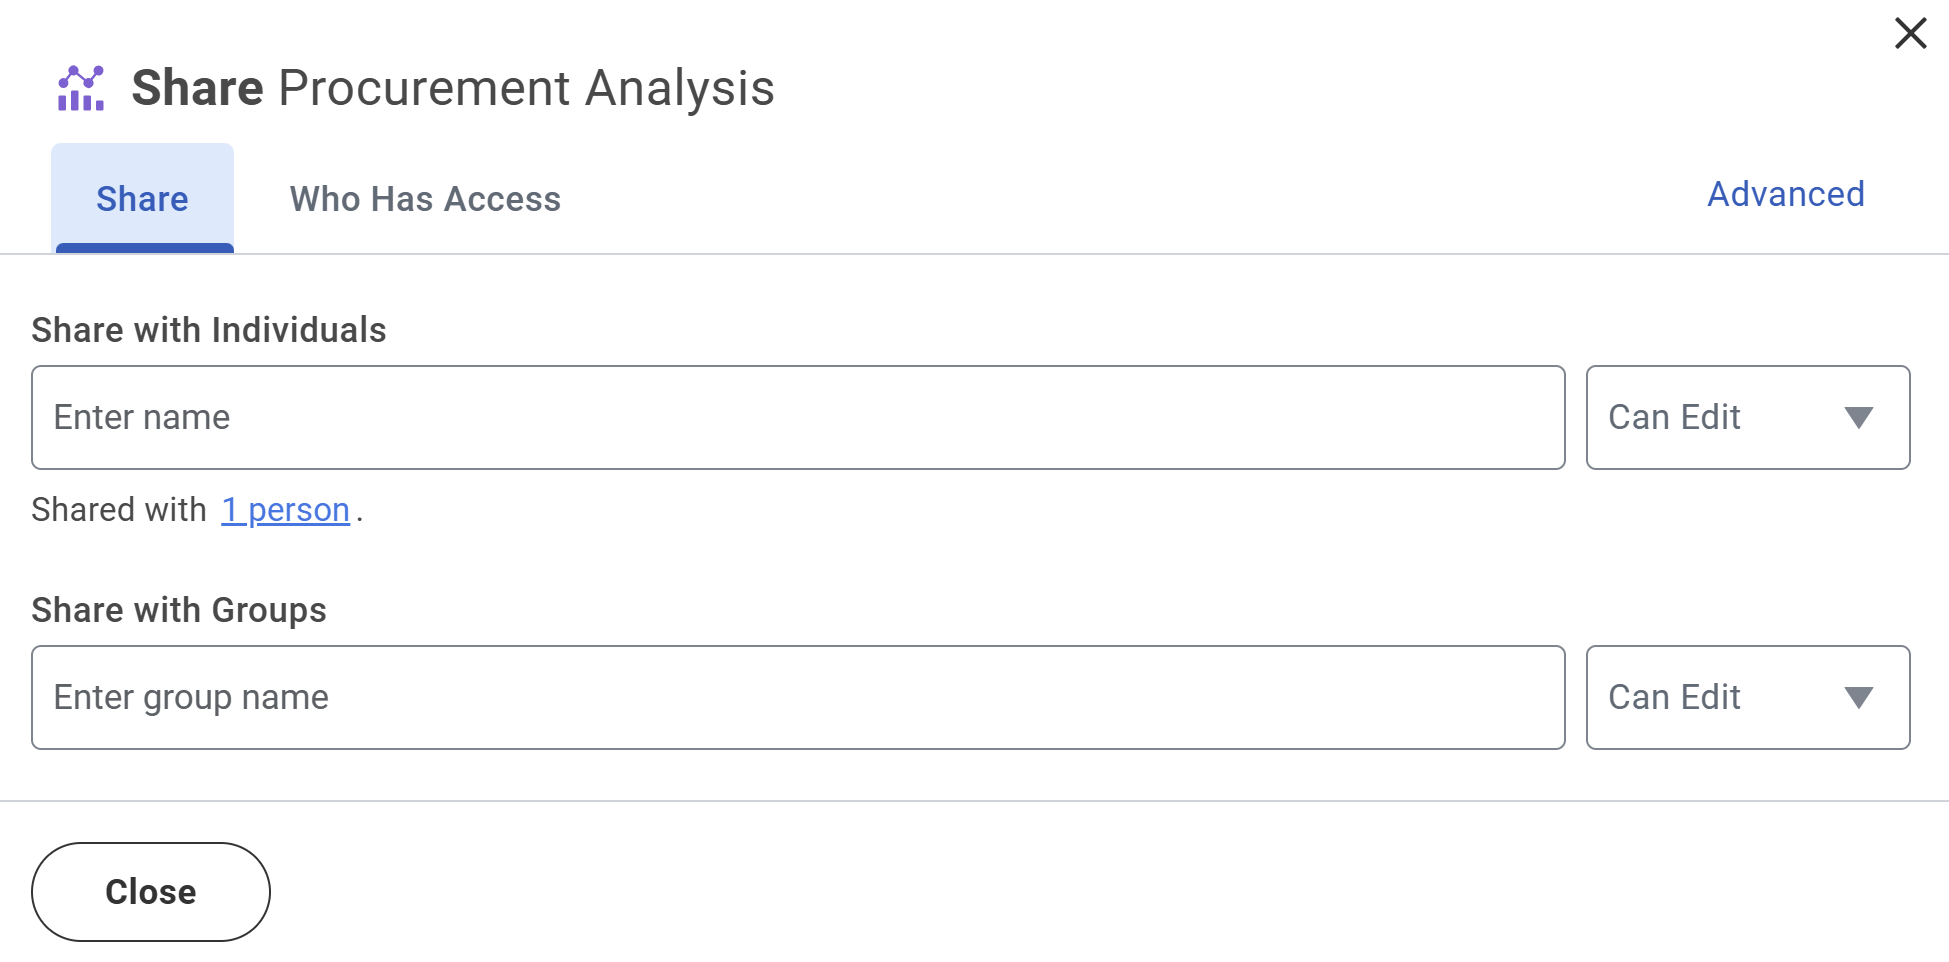
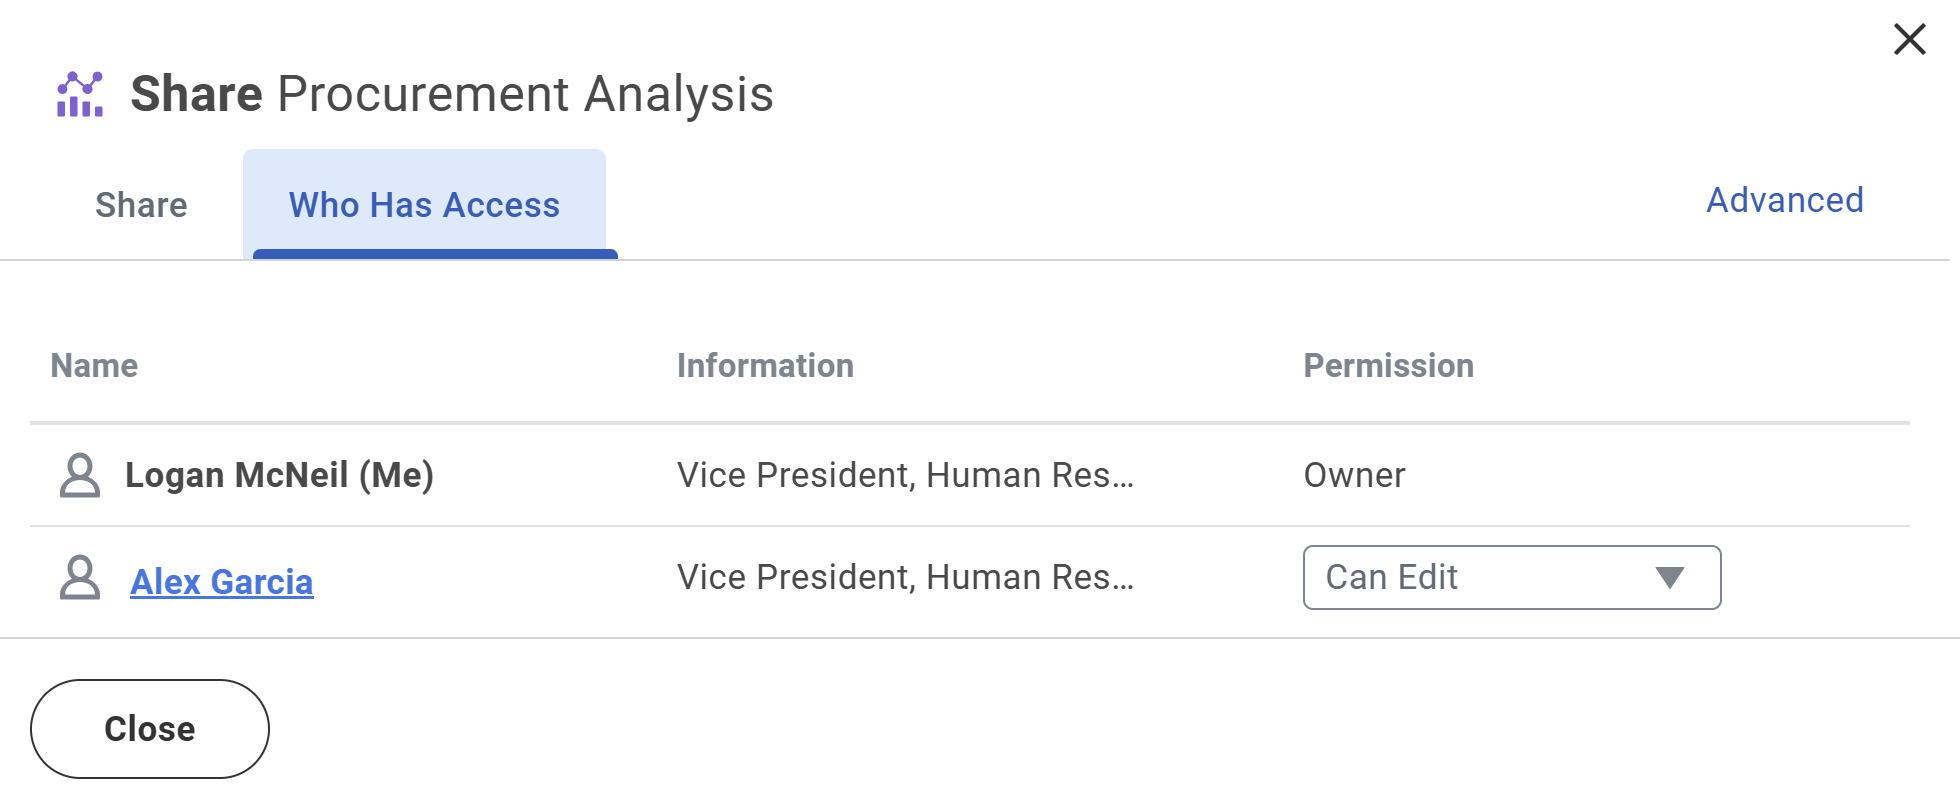
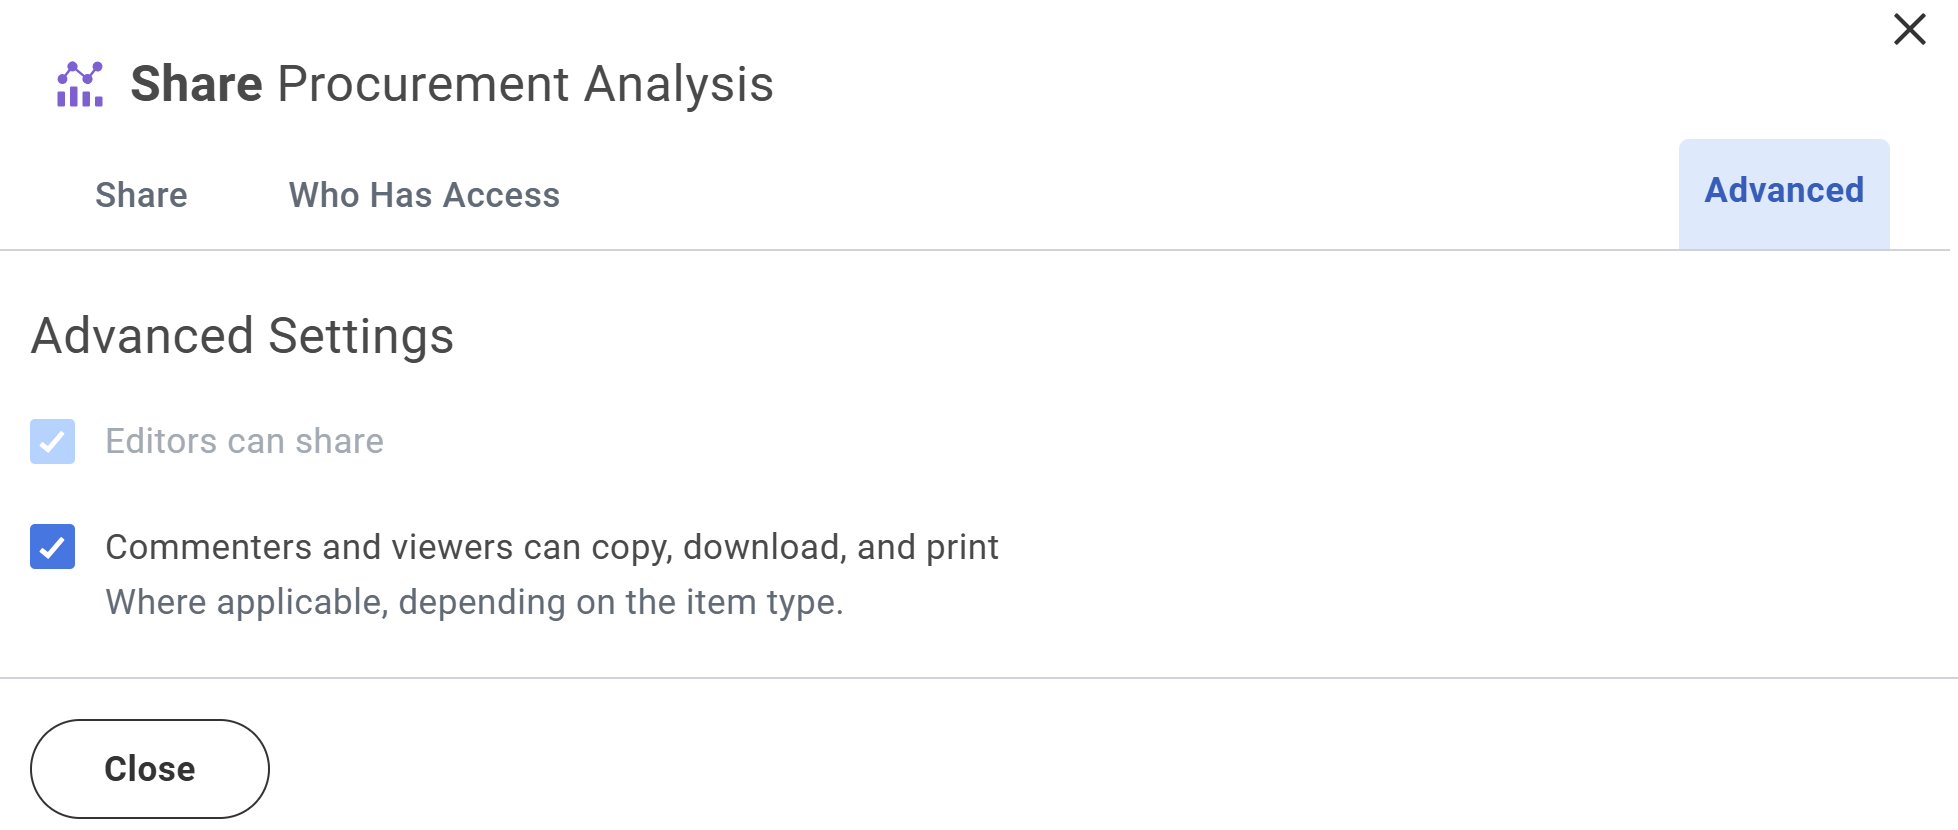
The sharing permissions for Discovery Boards align with the permissions available in Drive. The images below show the three tabs in the Share menu: Share, Who Has Access, and Advanced. In the Share tab, you can specify the individuals or security groups with whom you would like to share the discovery board. You can set the permissions to Can Edit or Can View. In the Who Has Access tab, you can view who has access to the discovery board and their permission settings. Finally, in the Advanced tab, you can select whether viewers can copy, download, and print a discovery board. The owner can also allow or deny editors the ability to share the discovery board with other users.
Only the owner can delete the discovery board, which moves the discovery board into the trash. Only the administrator can permanently delete the discovery board from the trash using the
Drive Permanent File Delete
task.Sharing Security
To share a discovery board with a security group, you must set up your tenant for group sharing on Drive using the
Configure Group Sharing in Drive
task. In addition, discovery boards must be shareable with the security group.You can give users and groups Can View or Can Edit permission. To give Can View permission, the user or group you share with must have permission on at least one data source used in the discovery board. Also, to give Can Edit permission, the user, or group must have access to the Discovery Boards: Create domain.
Discovery Boards Security Domains
Configuring Discovery Boards requires the following security domains:
Security Domain | Allowed Security Group Types | What It Enables |
|---|---|---|
Custom Report Creation | Unconstrained Groups | Access to export a visualization to a custom report. |
Discovery Boards: Administration | Unconstrained Groups | Access to administer discovery boards, such as defining field lists. |
Discovery Boards: Create | Unconstrained Groups Public Groups | Access to create and edit discovery boards. |
Discovery Boards: Manage Curated Data Source List | Unconstrained Groups | Access to manage a curated data source list, including adding and removing data sources, and enabling/disabling the list. |
Discovery Boards: Manage Delivered Discovery Boards | Unconstrained Groups | Manage access to tasks for viewing, copying, and deploying Workday-delivered discovery boards. |
Discovery Boards: Manage Drilling Field Lists | Unconstrained Groups | Access to manage the drill down field list and detail data field list of a business object, including adding and removing fields. |
Discovery Boards: Set up Discovery Board as a Worklet | Unconstrained Groups | Manage access to configure a discovery board as a worklet within the Maintain Dashboard task. |
Drive | All Role-Based Groups Unconstrained Groups | Access to the Drive user interface to create and manage Workday files associated with workbooks and media files. |
Drive Administrator | All Role-Based Groups Unconstrained Groups | Access to audit-related tasks for Drive items, such as viewing all user items, transferring ownership, permanently deleting items, and removing sharing data for terminated or inactive accounts. |
Set Up: Tenant Setup - Worklets | Access within the Tenant Setup tasks to the Worklets section. Users must also have access to the parent domain of Set Up: Tenant Setup - General in order to have access to this domain's contents. |
In addition, sharing permissions are also available. By default, the creator of a discovery board is the owner. You can share a discovery board with other users by right-clicking and selecting Share. The sharing permissions for Discovery Boards align with those available in Drive:
Permission | What it Enables |
|---|---|
Can View | Can view the contents of a discovery board in preview mode. Can perform lightweight data analysis using Discovery Board controls. |
Can Edit | Allows editing of discovery boards in edit mode and can save edited content. Can share the discovery board with other users, if the owner permits. |
Owner | All the Can Edit capabilities plus the ability to move the discovery board to trash and rename the discovery board. |
Setup for Group Sharing for Drive
For each item type that Drive supports, you can choose whether to let self-service users share that item type with specific security groups. If you specify that a particular item type is sharable with a security group, Drive users will be able to share items with that group. Users will be able to share items of that type with the group, even if the user who shares the item is not a member of the group.
If you decide not to configure group sharing, the option will not display in the Share card. Drive will continue to allow only sharing with individuals, and sharing using a link.
Important
: Drive does not support group sharing with Intersection Security Groups.Educate your self-service users on when group sharing is appropriate. When configuring groups for group sharing, make sure all the group members know about their own membership in the group. Also make sure they are familiar with who else is in the group. If you are creating security groups to configure for group sharing, give them meaningful names that are understandable by self-service users. If you used a large group like All Workers to grant access to an application, consider adding more granular groups to meet your needs for group sharing use cases.
Example
: Instead of selecting to enable group sharing for the All Workers security group, you might want to limit it to the Recruiters group.Follow these steps to configure group sharing in Drive:
- Access theConfigure Group Sharing in Drivetask.
- Optionally, select the Only Admins Can Group Share checkbox. When selected, the configuration that you set up in the rest of these steps will apply only to Drive administrators; group sharing search will not be visible to self-service users. If you limit group sharing to administrators, then:
- Only Drive administrators who have Edit access or higher to a Drive item can share that item with a security group.
- Self-service users will not have the Share with Group option in the Share dialog.
- Self-service users can be the recipients of group-shared items, and they can notice shared items as part of a group, but they cannot modify or remove their sharing permissions.
- Add each item type that you want to be shareable with a security group, then select which security groups with whom you can share the items.Note: By default, after you select the item type, all unconstrained security groups with access permission for that item type automatically display.
Delete any security groups that you do not want users to share with. You can enable group sharing only for unconstrained security group types.
The File item type is associated with any file type that does not fall into a more specialized category in Drive. In other words, these file types enable you to use the
Edit Tenant Setup - System
task in Workday from the File Type Setup Instructions section. When you enable group sharing for the File item type, you are enabling group sharing for all of these file types.For the Folder item type, if you enable group sharing and then a user shares a folder with a group, the permissions propagate to the files in the folder. This happens regardless if the individual enabled the file's type for group sharing.
Self-service users have access to these changes in the user interface after you enable group sharing, if you did not limit it to administrators:
- Any Drive user will have access to the Share with Groups section of the Share dialog when they choose to share a Drive item.
- Drive users can start entering a group name into the Share with Groups field to access the groups with which they can share.
- Drive users can view and manage what groups have access (and the level of access) to a group-shared item in the Who Has Access tab of the Share dialog.
- When a user gains or loses membership to a group, they automatically gain or lose access to items that someone shared with that group.
- Unlike sharing with individual users, when you share an item with a group, Workday does not send notifications. You might want to notify people that you shared an item with them.
Sharing Visualization Insights
There are three ways to share visualization insights:
- You can create a custom Report Writer report from a compatible visualization and share the report.
- You can download the visualization image as a Portable Network Graphic (PNG) file and share the image.
- You can download the visualization as a comma-separated values (CSV) file and share the file.
Create a Custom Report from a Viz
To create a custom report from a visualization, you must have permissions set up in Workday (System functional area) for the following domains:
- Custom Report Creation
- Discovery Boards: Create Context
Reminder
: You can export the following visualization types as a custom report in Workday: Chart, Donut Chart, Pivot Table, and Table.Each time you export a visualization, Workday creates a new report definition. Fields not supported in discovery boards might display in custom reports.
Example
: Discovery boards do not support time field types, but Report Writer does. If you use a datetime field, Workday displays only the date in a visualization, but displays the date and time in the custom report.The chart and sort options you select for the visualization might not display the same way in the exported custom report. In addition, Drill By and Show Details fields you set up might also differ in the custom report.
As mentioned earlier, the type of report that Workday creates depends on the type of visualization you export.
Visualization Type | Report Type |
|---|---|
Chart Donut Chart | Matrix report displaying the chart and table. |
Pivot Table | Matrix report displaying the table only. |
Table | Advanced report. |
Workday assigns the user who creates the visualization as the owner of the report. When exporting the visualization to a report, Workday automatically sets the report definition sharing options to 'Don't share report definition.' However, you can edit the report definition after Workday creates the report.
Steps
Follow these steps to create a report from a viz:
- Select a viz from the discovery board.
- From the viz's Related Actions (three vertical dots) in the top-right corner, select Create Report.
- Enter the name of the report definition.
- Select Create to create the report definition. The report will open in a new tab.
- Select View to run and view the report. (Note: You can also select OK to save the report definition. Workday will return you to the visualization and you can view the report later.)
Download a Visualization Image
To download a visualization as an image, you must have permissions set up in Workday (System functional area) for the Discovery Boards: Create domain.
Once you select the visualization from your discovery board, select Download as PNG from the visualization's Related Actions menu, as shown in the image below.
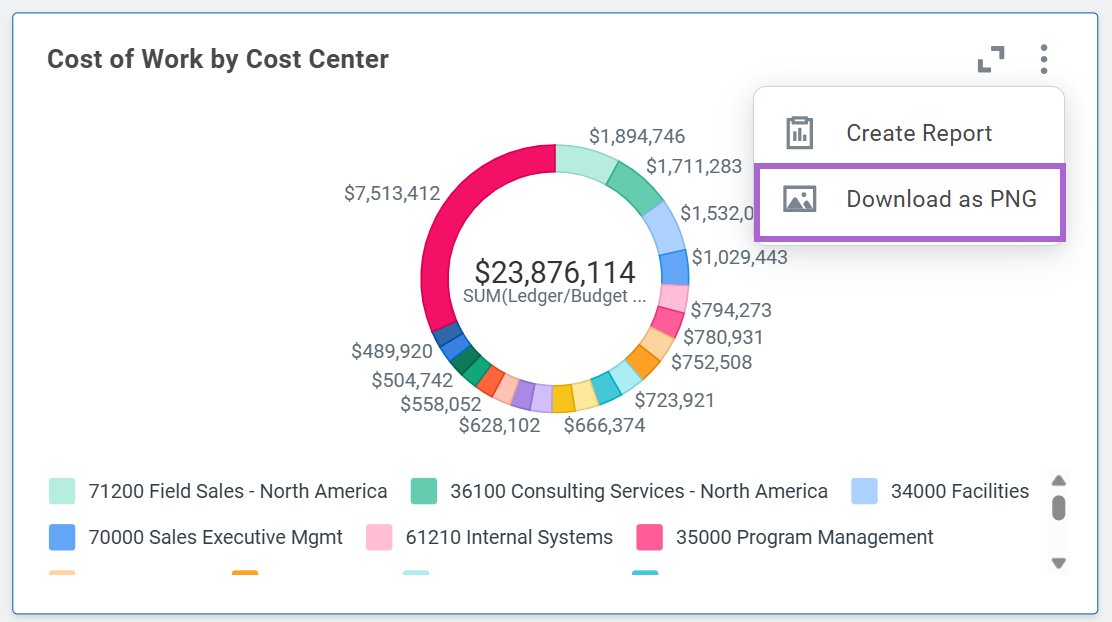
When you download a visualization as a PNG image file, the system will save it to your local computer. The image file saves to the directory configured in your browser.
Download a Visualization as a Table
You can download discovery board visualizations as CSV files, making it easier to perform further analysis on your tabular data, as shown in the image.
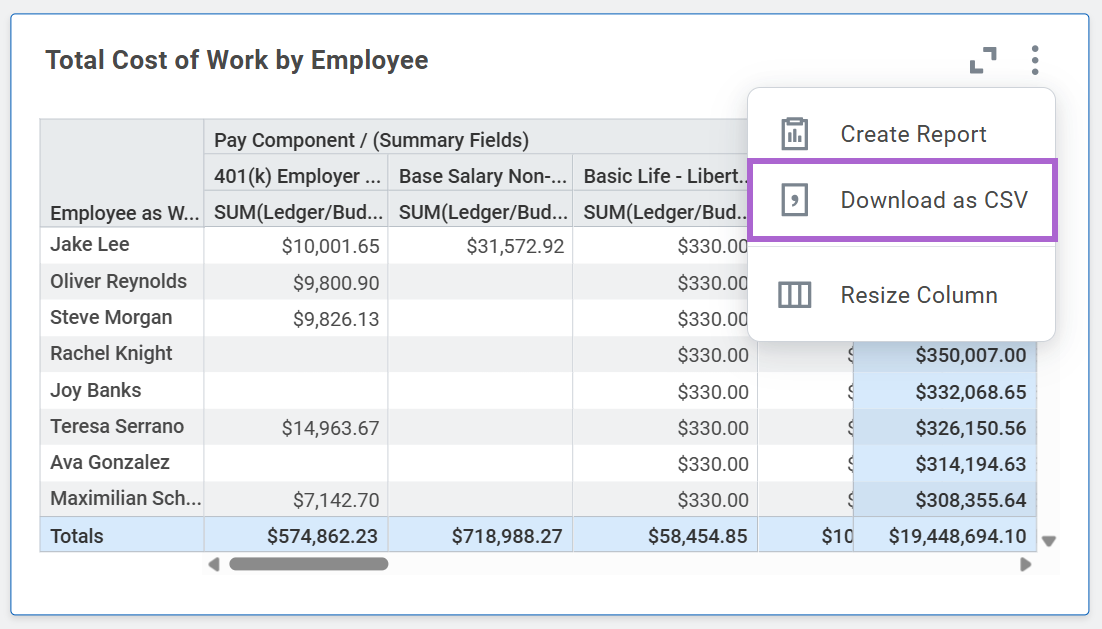
The Download as CSV option is on the Related Actions menu for:
- Drill By results.
- Show Details results.
- Matrix Report - Pivot Table.
- Advanced Report - Table.
The example below shows a tabular view of the Show Details data results. From here, you can select the viz's Related Actions and download the table as a CSV file.
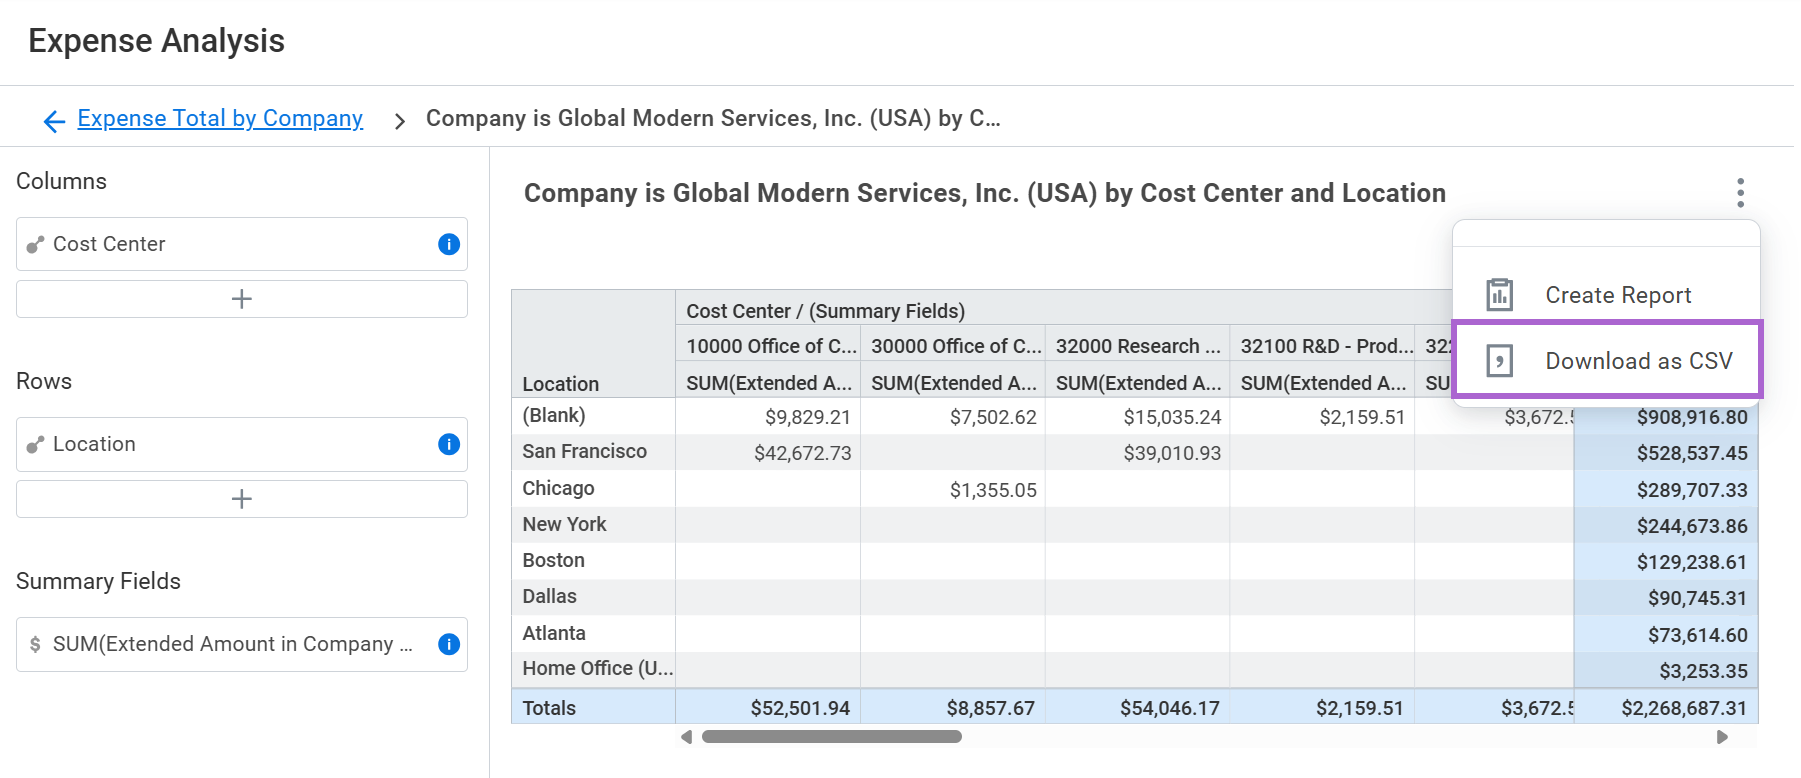
This feature is available to both viewers and editors of a discovery board.
You may want more control over how you secure access to discovery boards and the data within them. Workday allows you to enforce access restrictions for discovery boards to prevent users from downloading viz data as a CSV.
To prevent the Download as CSV viz menu option from displaying, create an access restriction for the users' security group using the
Create Access Restriction
task. When you define the access restriction, select either of these options in the Excludes Functionality prompt:- Export to PDF or Excel
- Export to PDF or Excel (Except Payslips and W2s)
Discovery Board Worklets on the Home Page
You can add discovery boards as worklets on the Global Navigation menu. This makes it easier for users to find a discovery board and reduces the time spent searching for a discovery board in Drive.
Add a New Security Policy
To add a discovery board as a worklet on the Home page, you must have security permission to these domains in the System functional area:
- Set Up: Tenant Setup - Worklets
- Discovery Boards: Set Up Discovery Board as a Worklet
Complete the following steps to set up and activate a new security policy on the Discovery Boards: Set Up Discovery Board as a Worklet domain:
- From the Search bar, navigate to theView Domaintask.
- In the Domain field, select the Discovery Boards: Set Up Discovery Board as a Worklet domain, and select OK.
- From the domain's Related Actions, select Domain > Edit Security Policy Permissions.
- Add the necessary permissions to the Worklet grid.
- Run theActivate Pending Security Policy Changestask to activate your changes in the tenant.
Add a Discovery Board as a Worklet to the Home Page
After you set up and activate the proper security permissions, you are now ready to add a discovery board as a worklet to the Home page.
Follow these steps:
- Access theConfigure Global Navigation Menutask.
- In the Dashboards/Worklet grid, add a new worklet row.
- Add the discovery board as a menu item.Hint: If the discovery board is not populating in the Menu Item field, verify that you have set up sharing configurations on the discovery board.
- Enable the discovery board worklet for one or more security groups and set the worklet to Required, if applicable.
- (Optional) Override the menu category.
- Select OK to save your configurations.
- (Optional) For users in security groups in which the discovery board worklet is not required:
- Access theConfigure My Worklet Landing Pagestask.
- Select the Home landing page.
- Select the discovery board to display from the Optional Worklets section.
Security Note
: You can access the Configure Global Navigation Menu
task to change security access for the worklet. However, other groups can still access the discovery board through Drive if they have shared access at the discovery board level.Note
: You cannot permanently delete a discovery board used as a worklet on the Home page.Chapter Summary
- With Discovery Boards, you can perform ad hoc visual analysis on data sources and change reporting outcomes on the spot by using the drag-and-drop interface.
- Discovery Boards give Workday users the agility to quickly pivot and stay ahead of the curve, the data insight to answer operational questions, and the opportunity for collaboration with teams.
- The data source you select for your Discovery Board determines what fields you can access.
- You can update visualizations in a discovery board from the discovery board's workspace, which consists of the Data Source, Builder, Filter, and Formatting Panels.
- Discovery boards have one or more sheets, and each sheet can display up to 10 visualizations.
- A visualization is a graphical or textual representation of certain fields selected from a data source used to explore and analyze your data interactively.
- The visualization type determines the drop zones in the Builder Panel and how the data is visually displayed in the visualization.