Formatting the Report and Properties
Overview
The Report Designer tool can be used to format the output to make the report visually appealing and effective. There are several formatting options including: highlighting data, changing the appearance of text, dates, numbers or currency values.
Objectives
By the end of this chapter, you will be able to:
- Work with the grid report item.
- Add an image to the layout.
- Change font size.
- Format dates.
- Add color to report items.
Formatting the Report and Properties
Formatting is what you do to make a report visually appealing and effective. Format a report, for example, to highlight certain data, change the display of dates, numbers, or currency values, adjust the spacing between report elements, or display data based on a specified condition or output format.
Report Designer provides many options for customizing the appearance of report elements. Using various formatting properties, you can change the alignment, color, font, size, and other properties of these report elements. You can also add background colors, draw borders around elements, etc.
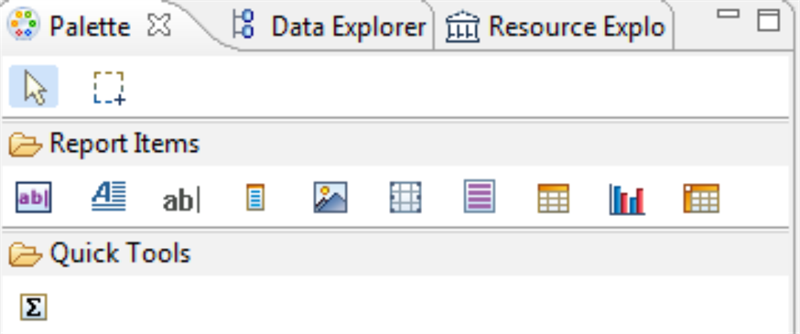
The Palette view contains items that can be added to the layout of the report, like grids, tables, charts, text boxes, and images.
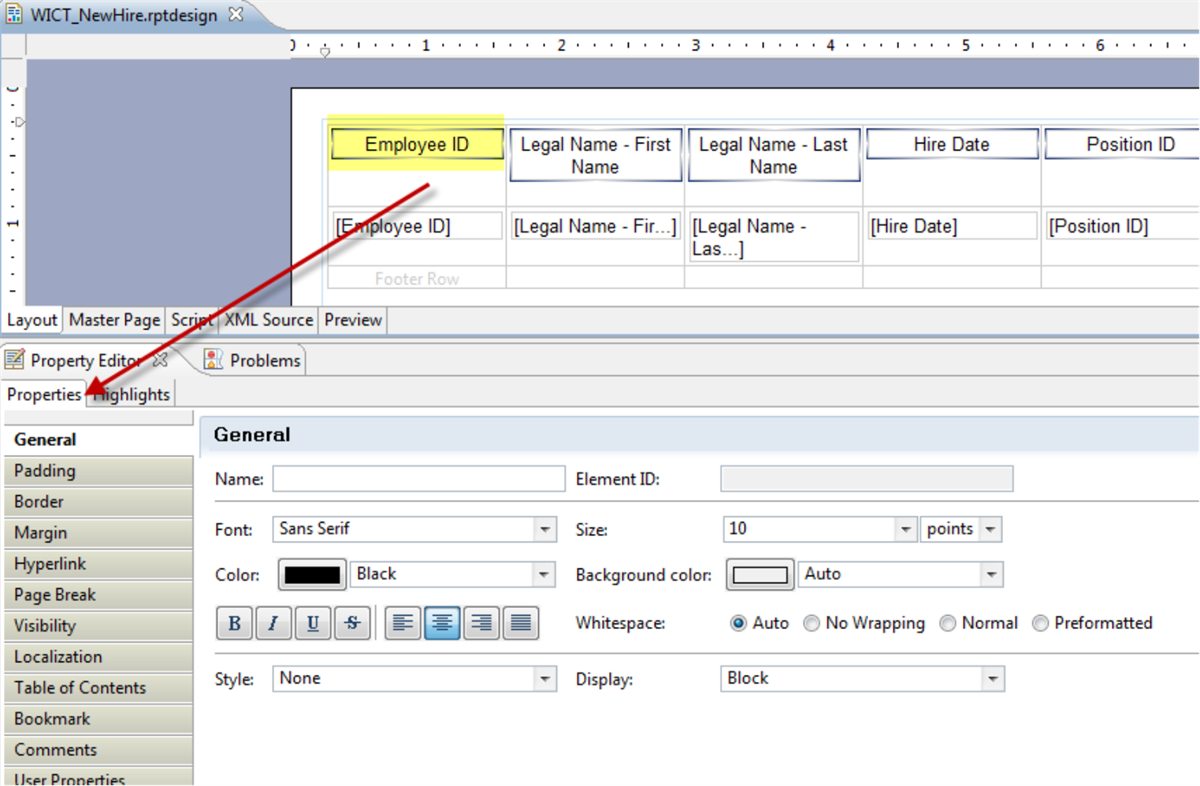
You can select one or more items on the report layout and use the Property Editor view to format and control the behavior of the selected items. Elements on the report can all be formatted. The formatting options will vary based on the element, but all configurable through the Property Editor.
Selecting Items on the Report
When you select an item on the report layout, you can use the Property Editor- Report view of the report to manipulate the selected item or items. When selecting an entire table or grid, hover over the table and select the Table button that appears. When clicked, the Property Editor - Table view will appear.
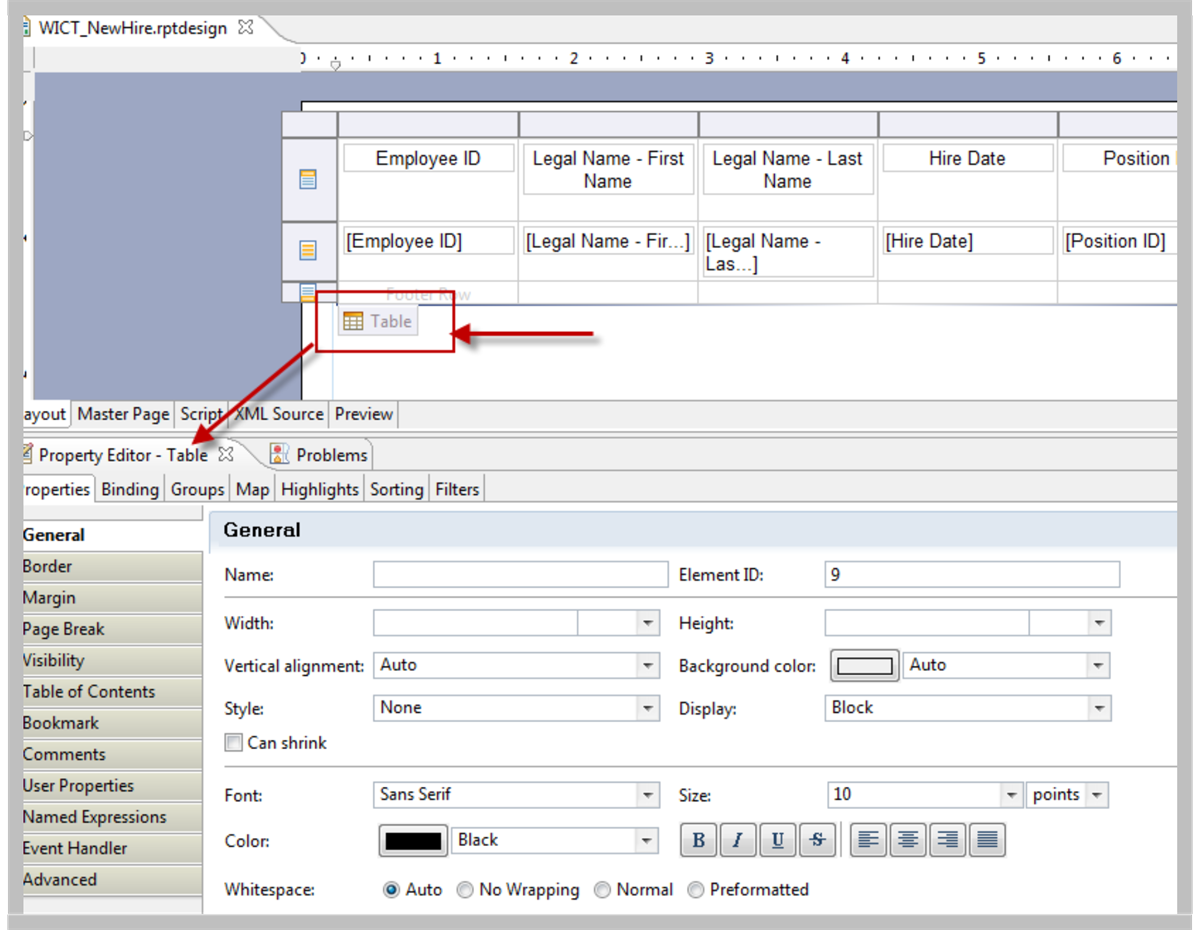
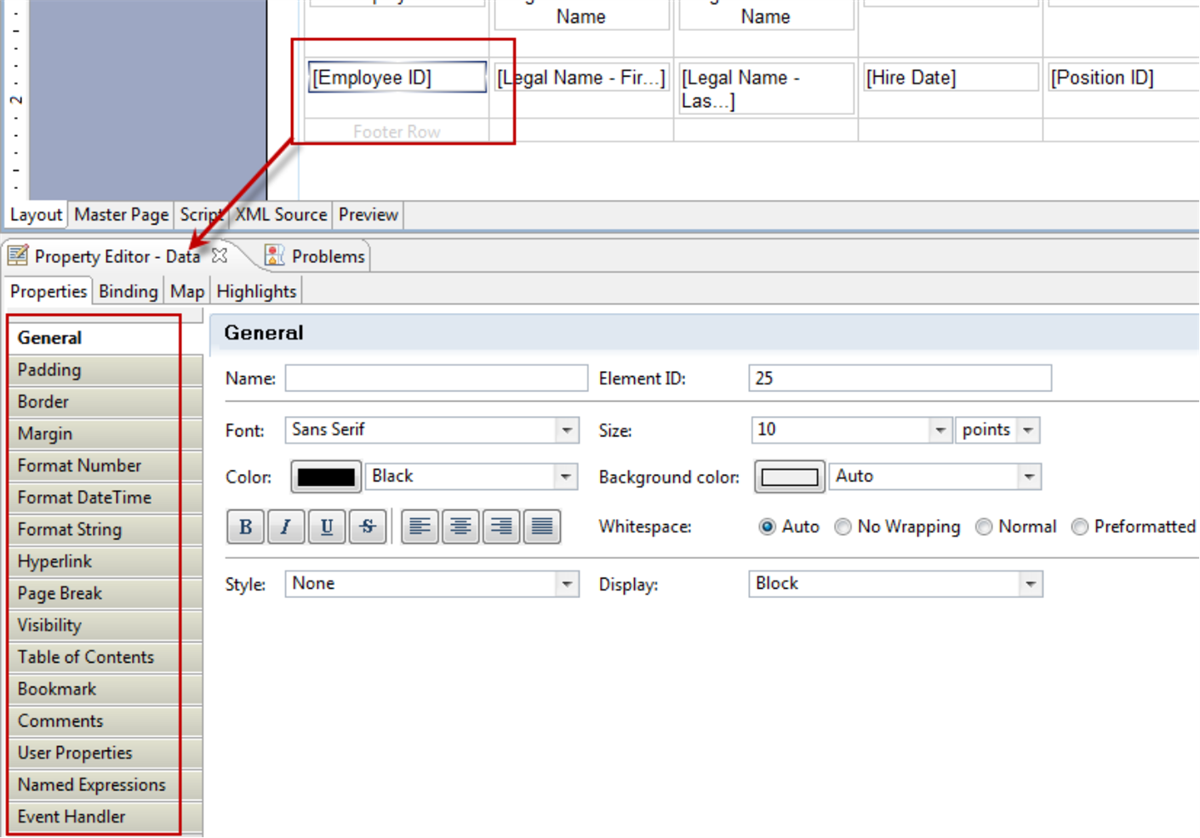
You can select individual fields and labels to format. When you select a label, you will see the Property Editor - Label. When you select a field, you will see the Property Editor - Data.
Data
The Property Editor - Data displays when you select a report data field.
Text and Labels
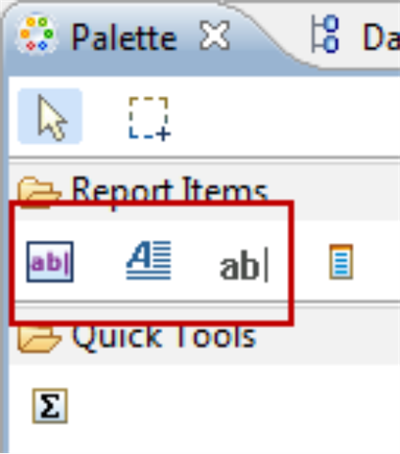
You can add a label, text block, or dynamic text block the report layout.
- Label: Static Text.
- Text: Insert a plain text or HTML text block with optional in-line expression.
- Dynamic Text: Insert a text block with optional CLOB Data Expressions.
Grid
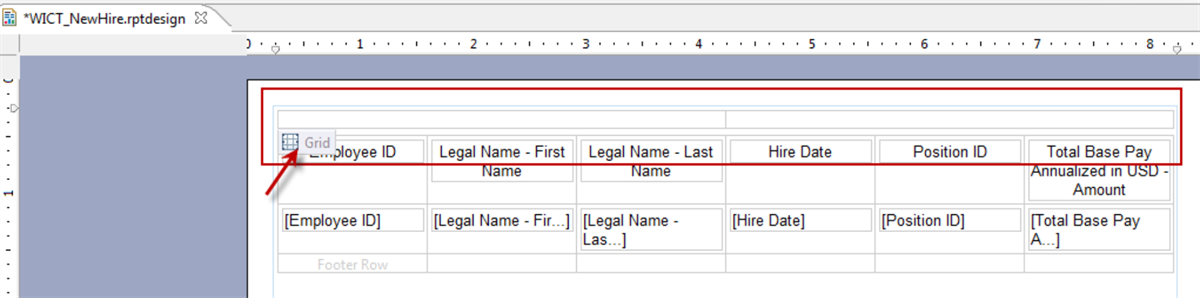
Drag a Grid from the Report Items folder within the Palette, to the Layout tab in the main window and position it above the table. The grid report item allows you to insert a row or column layout to visually arrange other items, for example, the image and report title.
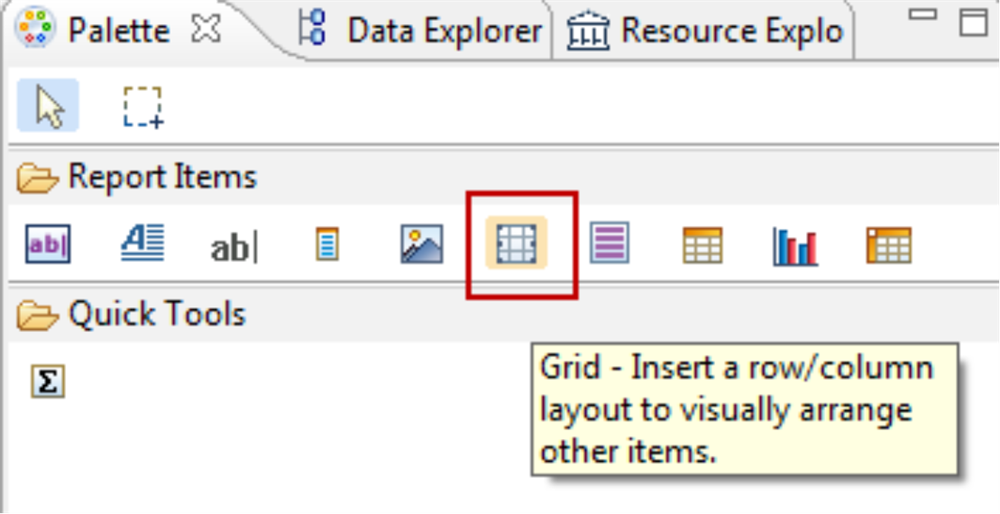
When selecting an entire grid, hover over the grid and select the Grid button that appears. When clicked, the Property Editor - Grid view will appear.
Table
You can format the table borders on the Property Editor - Table. Each individual cell of the table is formatted in the respective Property Editor - Cell view.
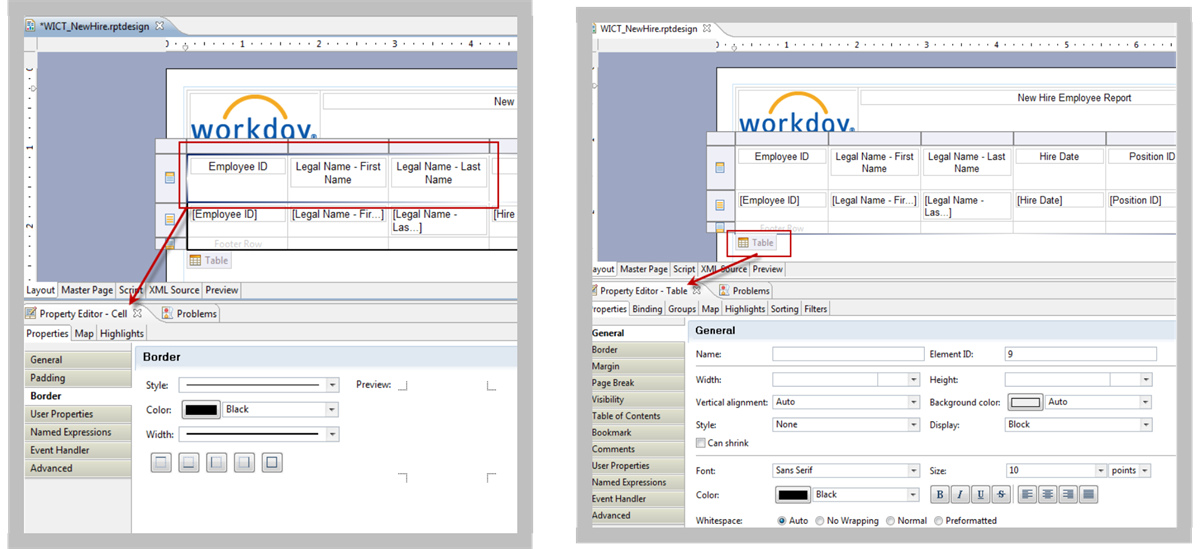
A table represents the rows of data from a data set. Where the table is bound to a data set, a row will be created in the output document for each row of data in the data set. By contrast, the rows in a grid do not represent the rows in a data set.
Images
The Report Designer allows four types of images to be created. However, of these, only Dynamic Image and Embedded Image are recommended.
- Dynamic Image: Use this option for display of Image Content from Reports (e.g., row["Photo"]).
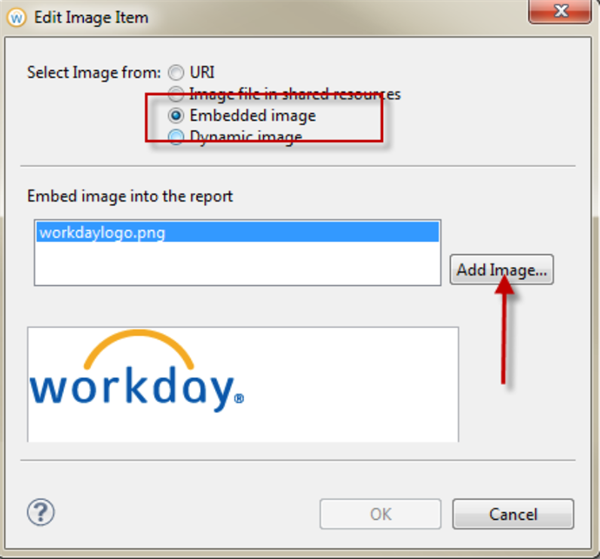
- Embedded Images: This option allows for the embedding of images directly into the report design (Image actually gets inserted as Base64 encoded text in the rptdesign file).
Be careful when removing embedded images from the Report Design. Deleting them from the layout view does not remove them from the report design completely. To do this, select the Outline tab, right-click on the named Image in the Embedded Images section and then remove it from the document.
Drag an Image report item from the Palette, to the first column in the grid on the Layout tab in the main window.
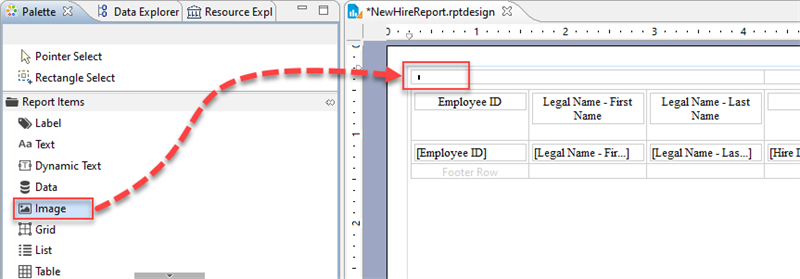
When you drop the icon onto the report layout, you will be prompted to select an image. Once selected, the image is displayed.
Number Format
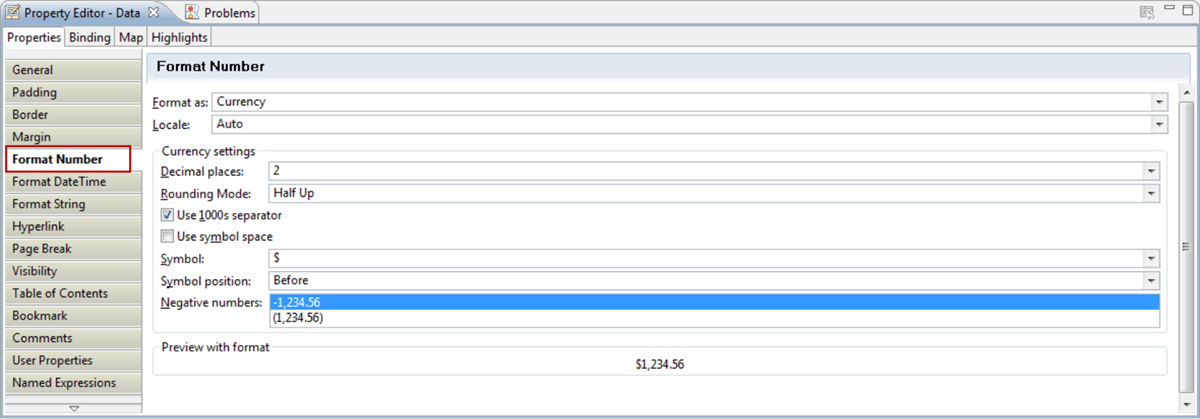
You can control the appearance of your number columns by using the Format Number tab on the Property Editor.
Date Format
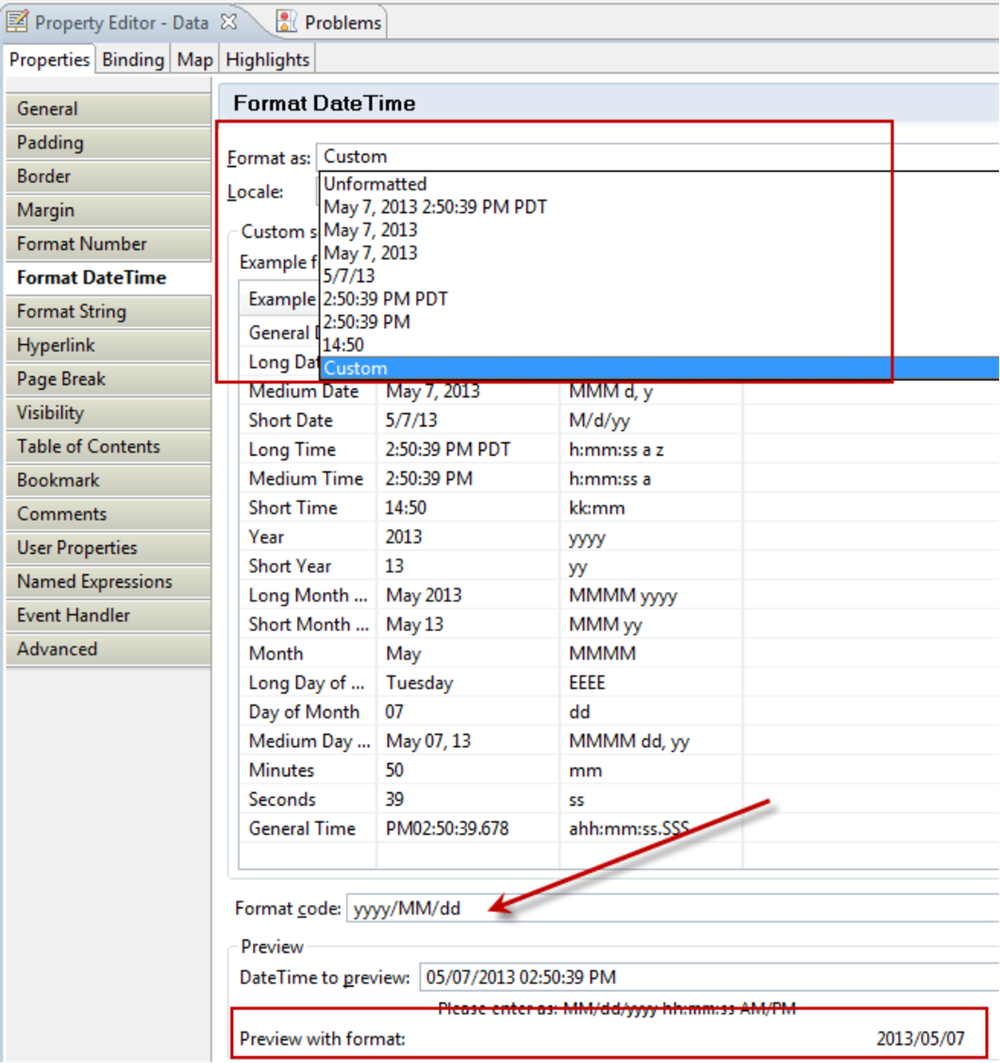
You can control the appearance of your date columns by using the Format Number tab on the Property Editor. You can select an existing format, or you can create your own custom format using the format codes.
Conditional Formatting
Formatting is what you do to make a report visually appealing and effective. Format a report, for example, to highlight certain data, change the display of dates, numbers, or currency values, adjust the spacing between report elements, or display data based on a specified condition or output format.
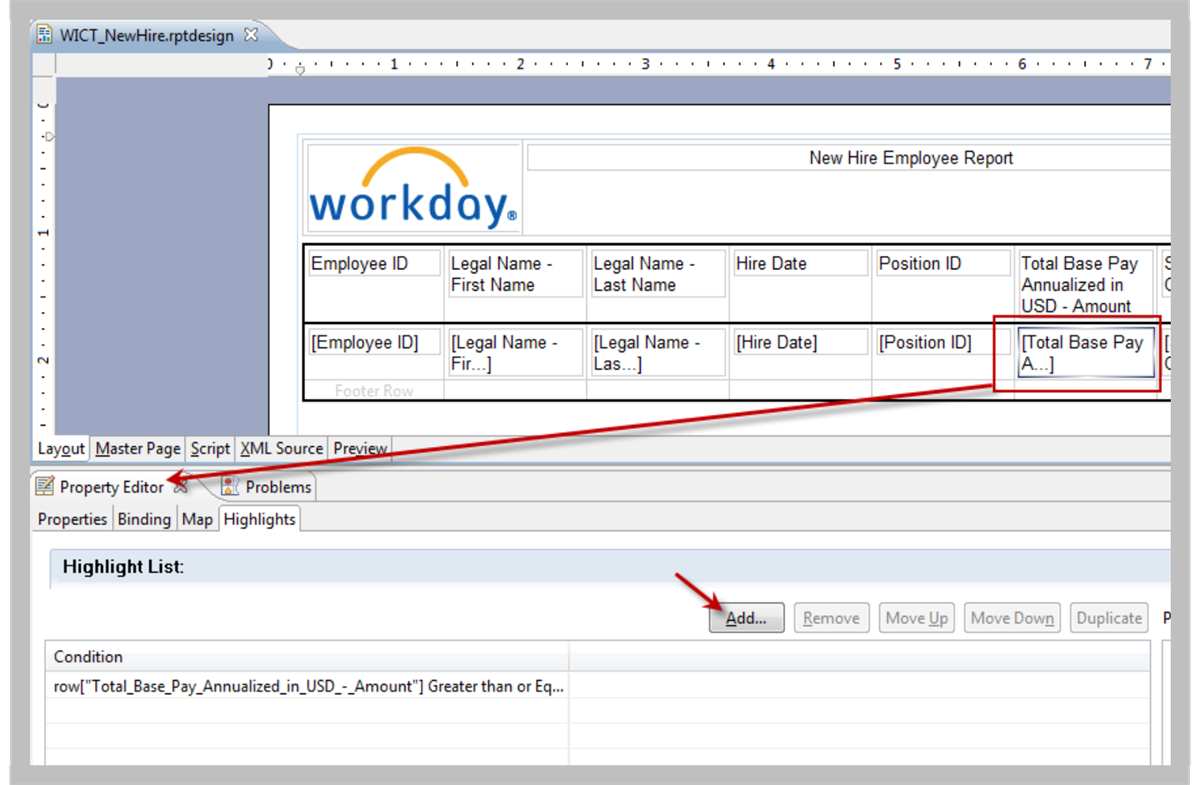
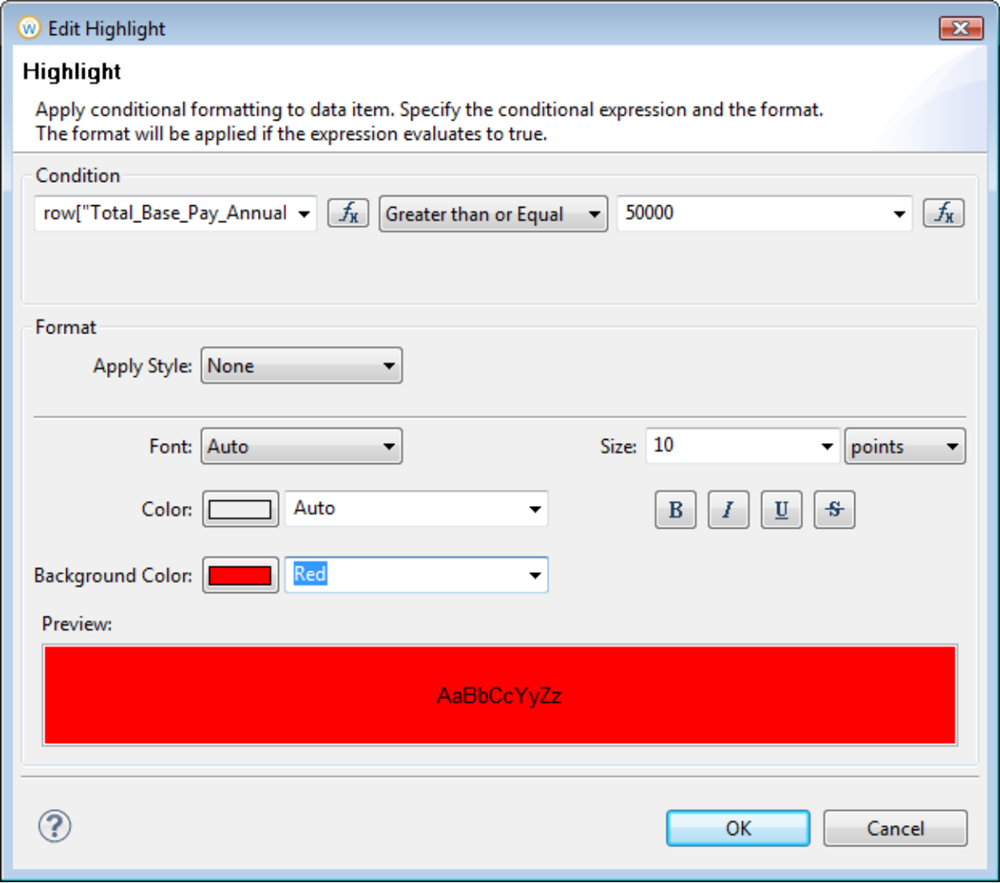
Once the data object is selected, view the Highlights tab in the Property Editor.