Building Report Designs
Overview
Workday Report Designer enables you to format the output of your web service enabled custom report.
Objectives
By the end of this chapter, you will be able to:
- Create a BIRT project.
- Learn how the data source represents the custom report.
- Understand the purposes of the data source and dataset.
- Create a report design.
- Preview a report design.
Report Designer – Building Report Designs
The Report Designer is used to create an .rptdesign file type that is associated to the custom report. If you do not deploy your report design directly from Workday Studio, sign into Workday to upload your business form layout and attach it to a custom report.
When you begin working with report designs, ensure you are using the Report Design view to have all of the available options.
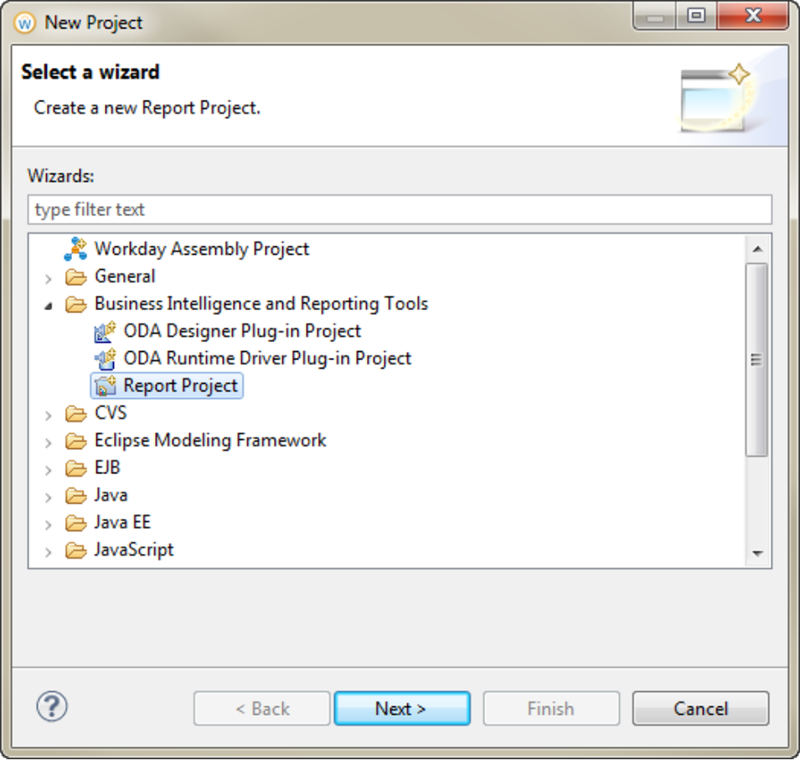
The Report Design file (.rptdesign) must be created in a Report Project.
From the File menu, select New > Project > Business Intelligence and Reporting Tools > Report Project.
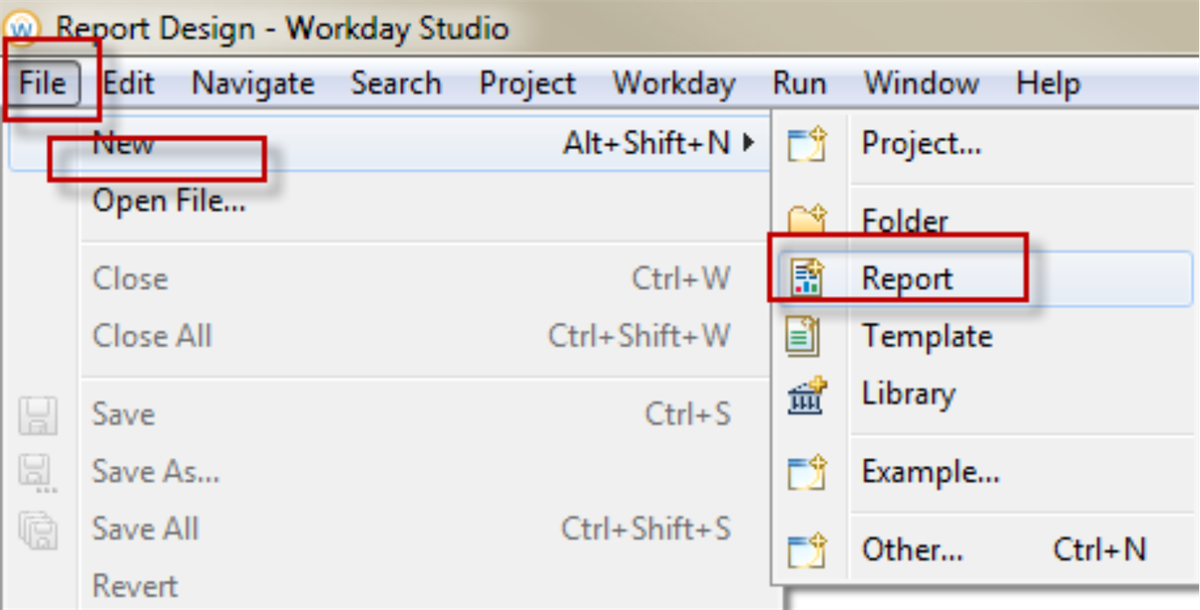
To create the report design file, navigate to File > New > Report.
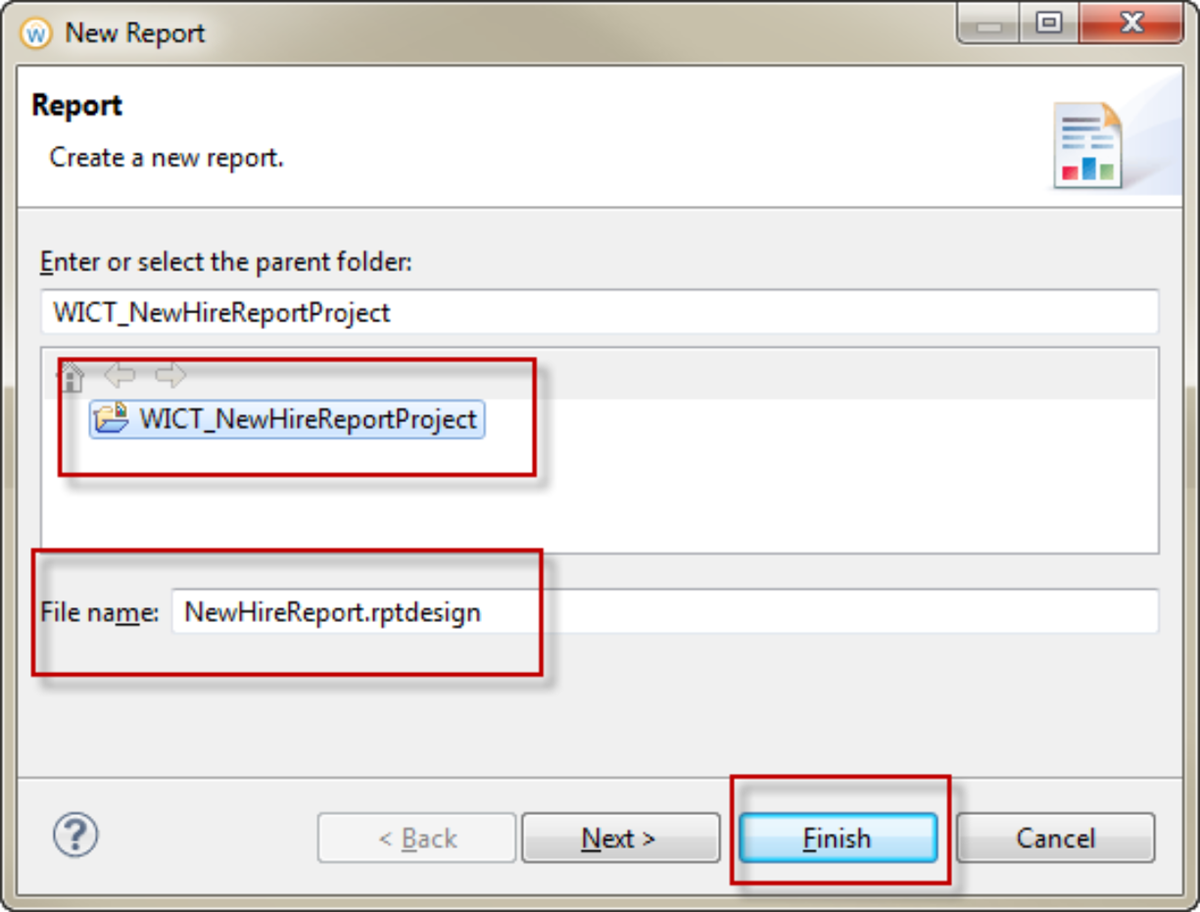
When the New Report dialog box is displayed, select the project you wish to create the report design file in and enter a file name for your report design. Select Finish to create the blank report design file.
You will need a description of the structure of the report and sample data. The structure of the report is defined by its XML Schema and you can retrieve the sample data as an XML file.
Views
Views support editors and provide alternative presentations as well as ways to navigate the information in your Workspace. For example, the Project Explorer and other navigation views display projects and other resources that you are working with. Perspectives offer predefined combinations of views and editors.
To open a view that is not included in the current perspective, select Window > Show View from the main menu bar.
Report Designer - NavIgation
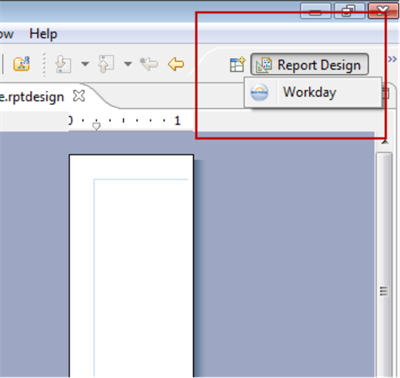
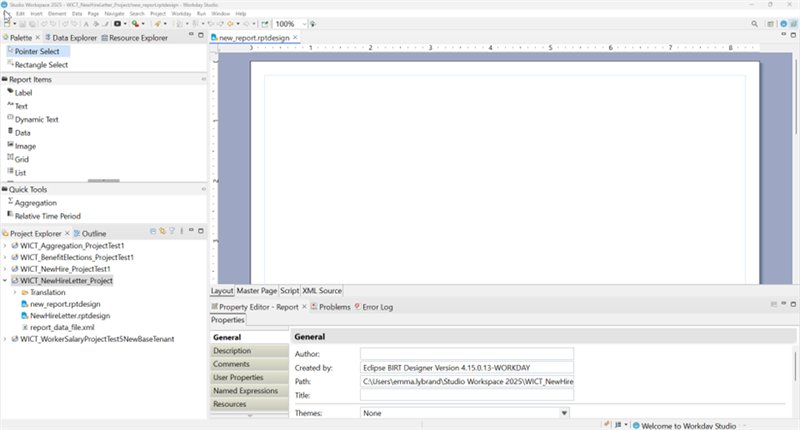
The Report Design perspective contains the following views:
Remember to add alt text in the Behaviors tab for the figure. Including alt text also allows the learner to zoom in on the image. If this is a decorative image, you can leave the Alt Text field blank.
- Palette
- Data Explorer
- Report Design
- Layout Tab
- Master Page Tab
- Script Tab
- XML Source Tab
- Property Editor
- Problems
- Error Log
Project Explorer View
The Project Explorer view contains projects. Projects contain the files and resources needed to build and deploy a Workday Studio Report Design.
When you are working with the projects in the workspace, you are working on your local machine. The files in the Project are pointers to files stored on your hard drive.
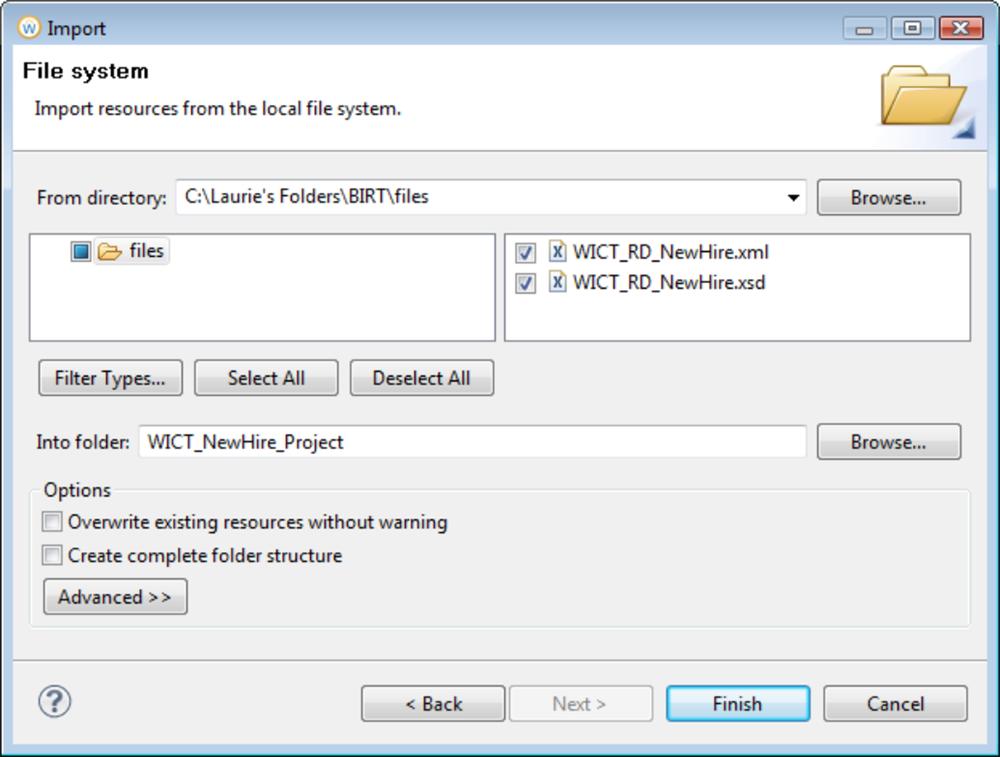
You can import files into a project that may be used in the Report Design. To import, right click on your Report Project in the Project Explorer window and select Import. Expand the General folder and select File System.
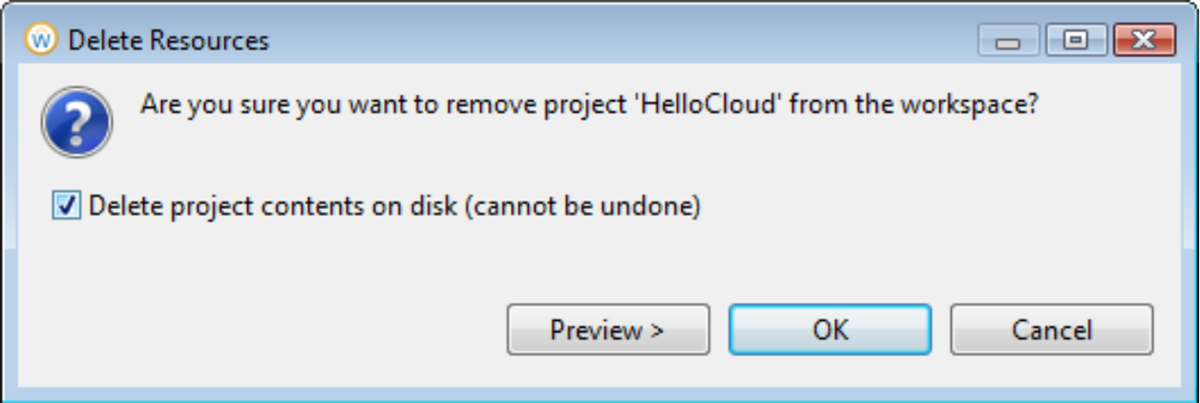
If you delete the Project, the files will remain on your local drive unless you check the box to delete the contents on the disk.
Outline View
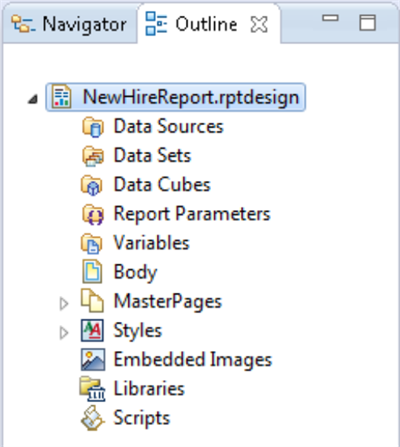
This view displays an outline of a structured file that is currently open in the editor area and lists structural elements.
Data Explorer View
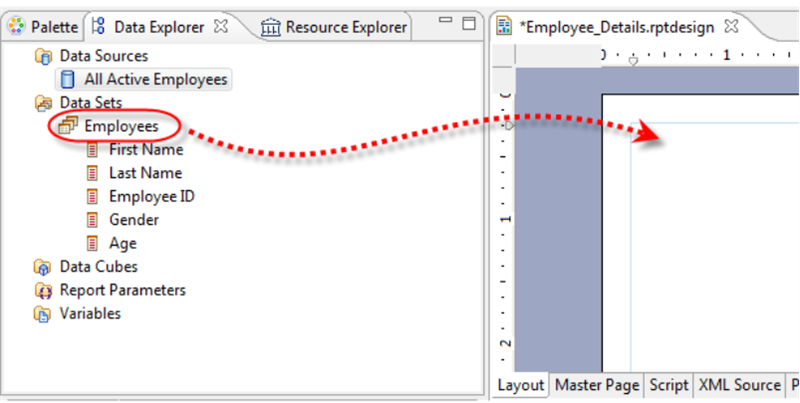
Remember to add alt text in the Behaviors tab for the figure. Including alt text also allows the learner to zoom in on the image. If this is a decorative image, you can leave the Alt Text field blank.
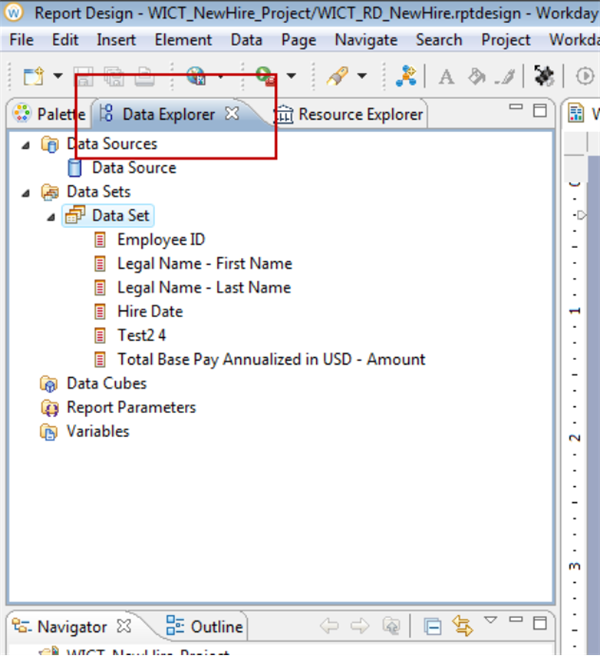
You use the Report Designer's Data Explorer view, which is displayed on the left-hand side of the Workbench, by default, to create data sources and data sets for your Workday report design. A data source associates the XML Schema and sample data for your report with the report design. Data sets display the structure of the data in the report. The data set displays the same list of fields that you created using the Workday Report Writer.
Palette View
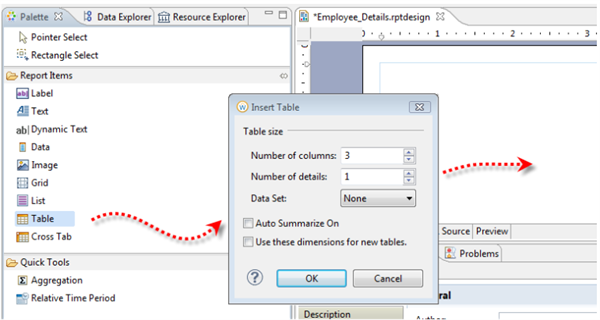
Remember to add alt text in the Behaviors tab for the figure. Including alt text also allows the learner to zoom in on the image. If this is a decorative image, you can leave the Alt Text field blank.
You build up a report design layout, by selecting report items, such as tables, grids, labels, images, text, and so on, from the Palette view on the left side, and dragging them to the Layout view in the main window.
Property Editor View
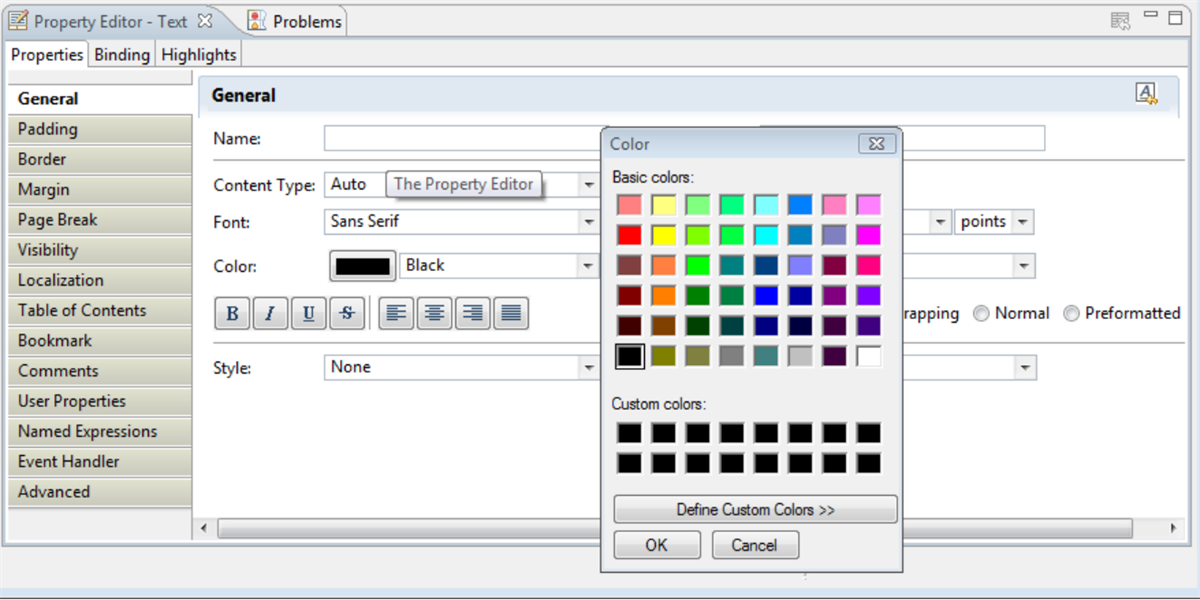
The Property Editor view allows you to set properties for each report item, for example, changing the color of text, as well as more advanced features.
Problems View
As you work with resources in the workspace, various builders may automatically log problems, errors, or warnings in the Problems view.
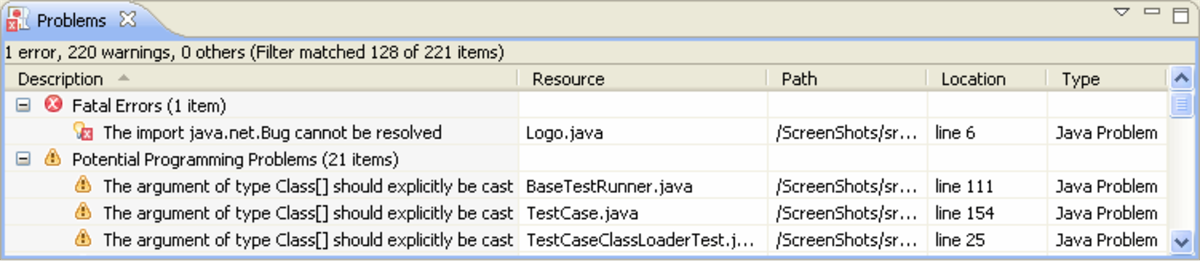
By default, the Problems view will group your problems by severity. The first column of the Problems view displays an icon that denotes the type of line item, the category, and the description.
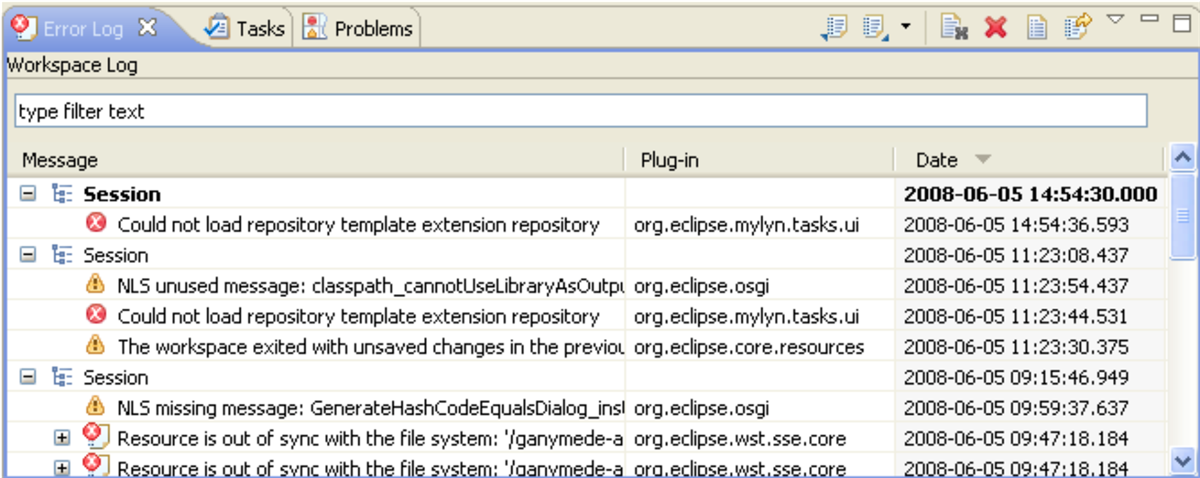
Error Log
The Error Log view captures all the warnings and errors logged by plug-ins. The underlying log file is a .log file stored in the .metadata subdirectory of the workspace on your hard drive.
//<Workspace directory>/.metadata/.log
Working with the Data Source
The New Workday Data Source Profile wizard in the Report Designer allows you to easily browse your Workday tenant to retrieve the description (XSD) and sample data (XML). Alternatively, you can also import the required files directly into the Report Project.
Each Report Project has a Data Source that associates the XML Schema (XSD) and sample data (XML) for your report with the report design. Within a Data Source, Data Sets display the structure of the data in the report, which you created using the Workday Report Writer. Each Data Set displays the same list of fields defined for a primary or secondary business object in the report.
Note
: The Workday Report Data Source data source type is specific to Workday.However, it is important to make a distinction between the term data source in the context of the Report Designer and the Workday Report Writer. In the Report Designer, a data source represents the connection to the Workday report, as opposed to a Workday defined data source in the Workday application used when creating a custom report.
Remember to add alt text in the Behaviors tab for the figure. Including alt text also allows the learner to zoom in on the image. If this is a decorative image, you can leave the Alt Text field blank.
As a report design author, you use the Report Designer's Data Explorer view, which is displayed on the left-hand side of the Workbench, by default, to create data sources and data sets for your Workday report design. A data source associates the XML Schema and sample data for your report with the report design. Data sets display the structure of the data in the report. The data set displays the same list of fields that you created using the Workday Report Writer.
You build up a report design layout, by selecting report items from the Palette view on the left side, and dragging them to the Layout view in the main window. Report items include tables, grids, labels, images, text, etc.
Creating the Data Source
Each Report Project has one Data Source which associates the XML Schema and sample data for your report with the report design.
In the Data Explorer window, right-click the Data Sources folder and select New Data Source.
When the New Data Source wizard opens select the "Create from a data source type in the following list" option and then select Workday Report Data Source from the list of data source types. Enter a name in the Data Source Name field.
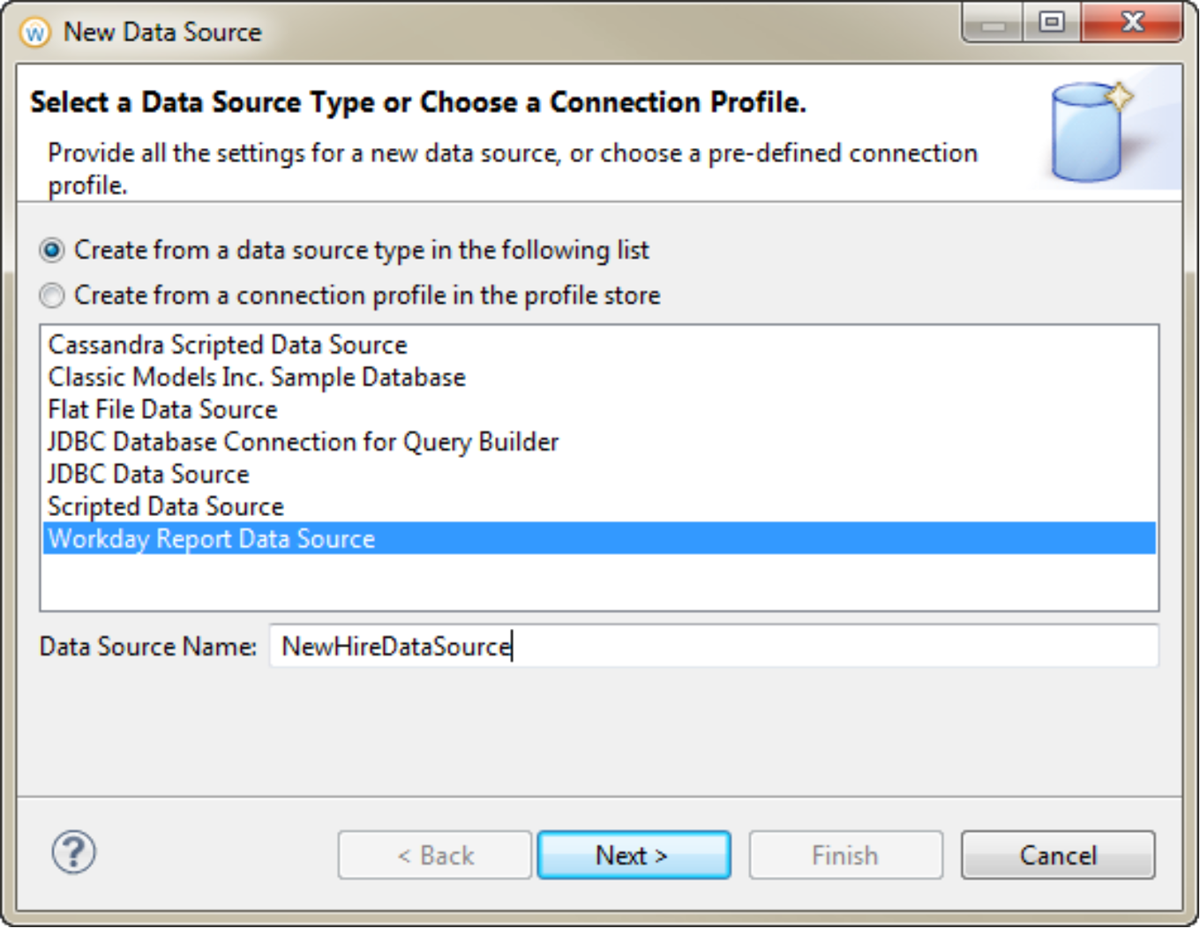
After you select next, you will be prompted to select the XML Schema and Workday XML files. You can either get them directly from Workday, or if you imported the files, you can select them from your Report Project.
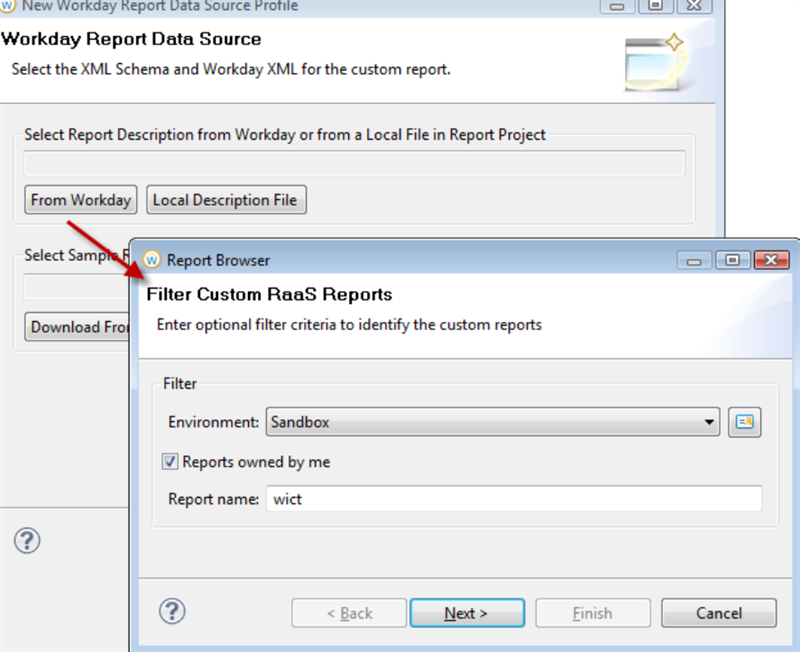
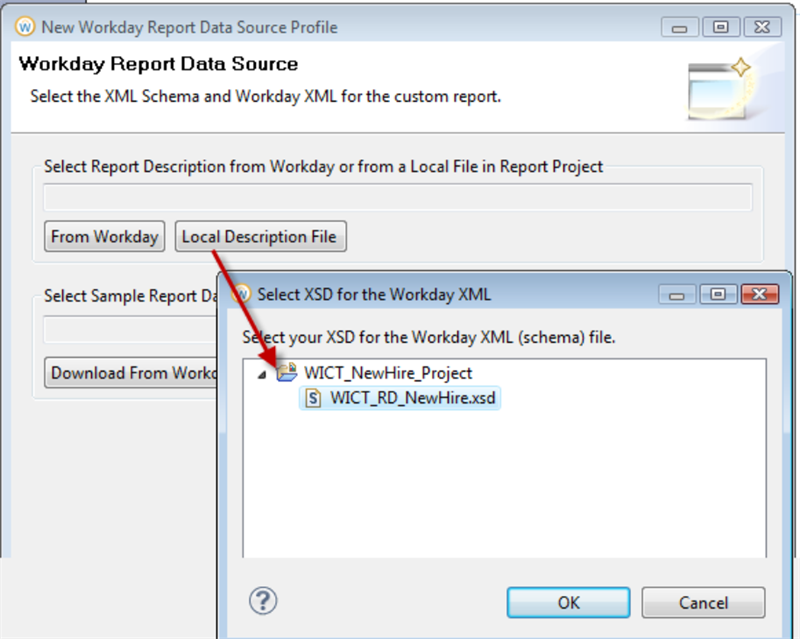
Creating Data Sets
Data Sets display the structure of the data in the report, which you created using the Workday Report Writer. Each Data Set displays the same list of fields defined for a primary or secondary business object in the report.
In the Data Explorer view, right-click the Data Sets folder, then select New Data Set. The New Data Set wizard opens.
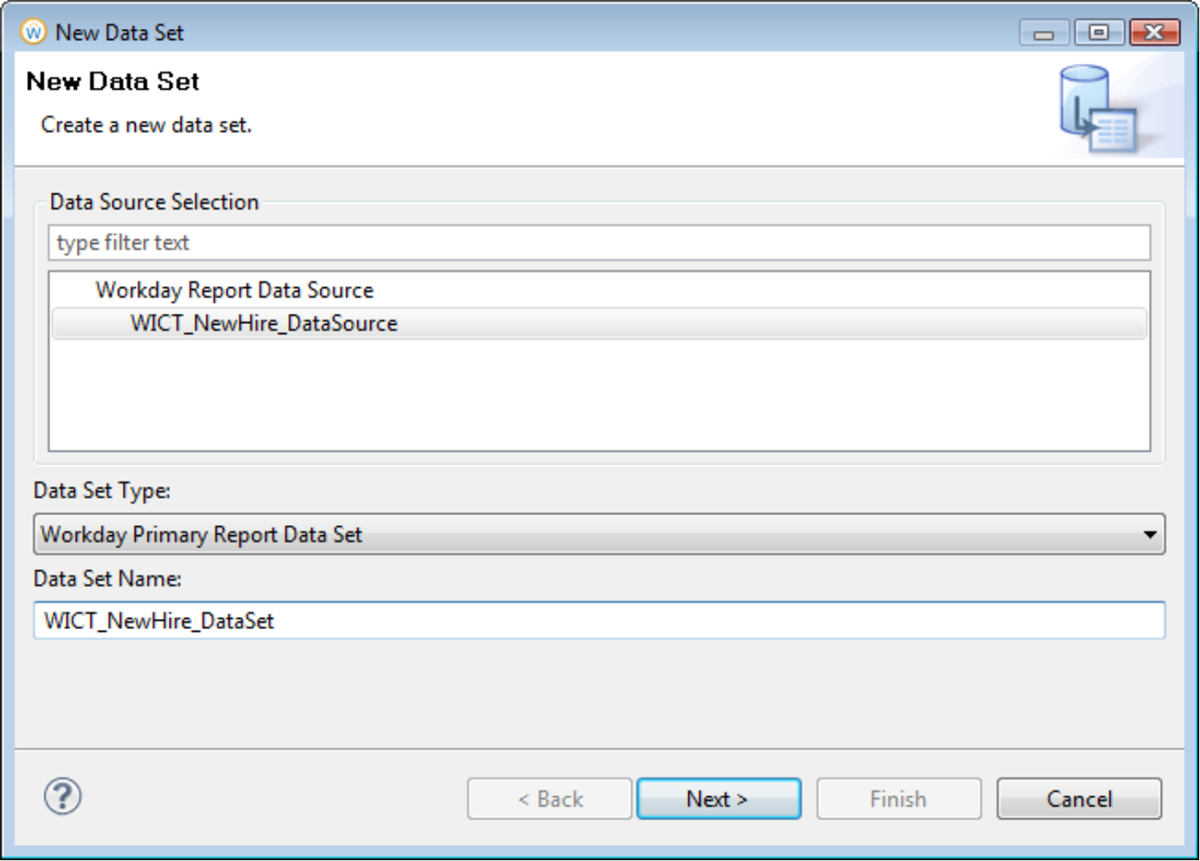
On the New Data Set screen, in the Data Source Selection area, select the correct data source from the Workday Report Data Source list.
The Data Set Type list displays the data set type, which in this case is the Workday Primary Report Data Set. This data set type accesses the primary business object in Workday. Remember, in the custom report that you created earlier; Worker is the primary business object. Later we will work with Secondary Data Sets.
Give your Data Set a name and select Finish. The Edit Data Set window displays.
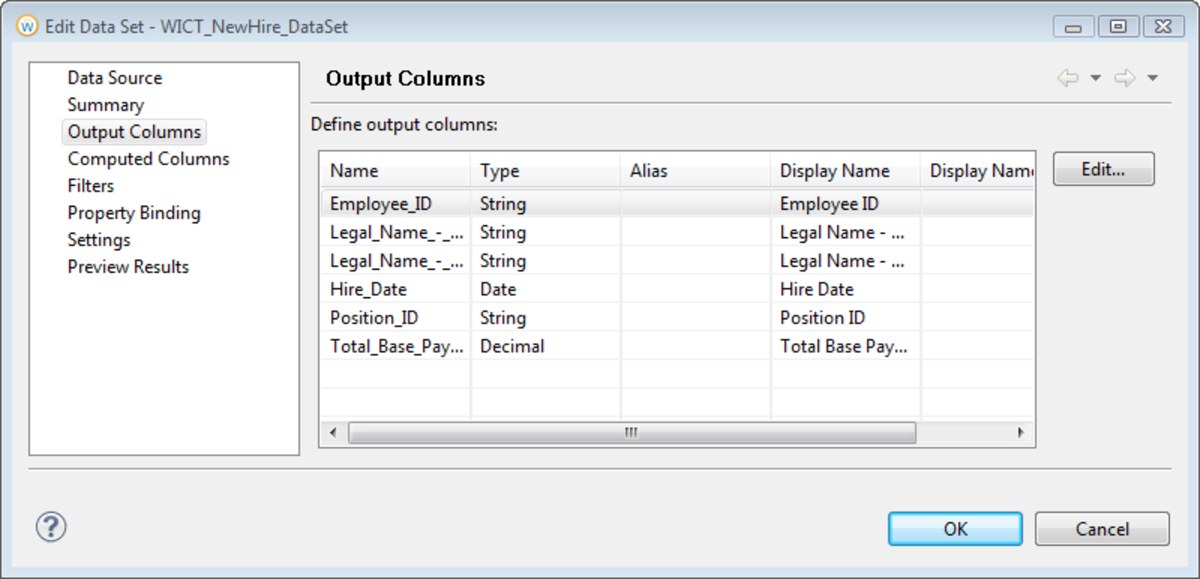
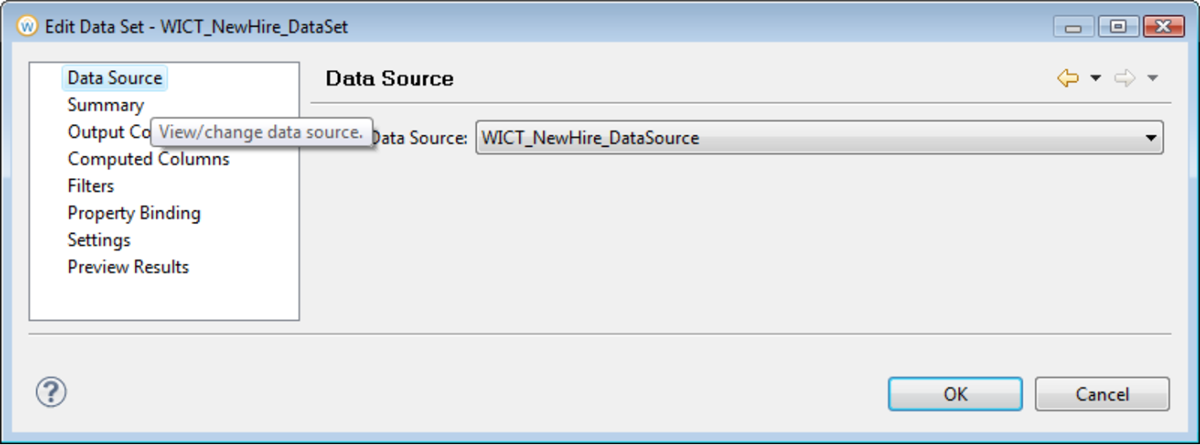
The Edit Data Set dialog contains several other pages for configuring and viewing the data set values, which you can access from the left navigation pane.
- Data Source: Indicates the data source that the data set is based on.
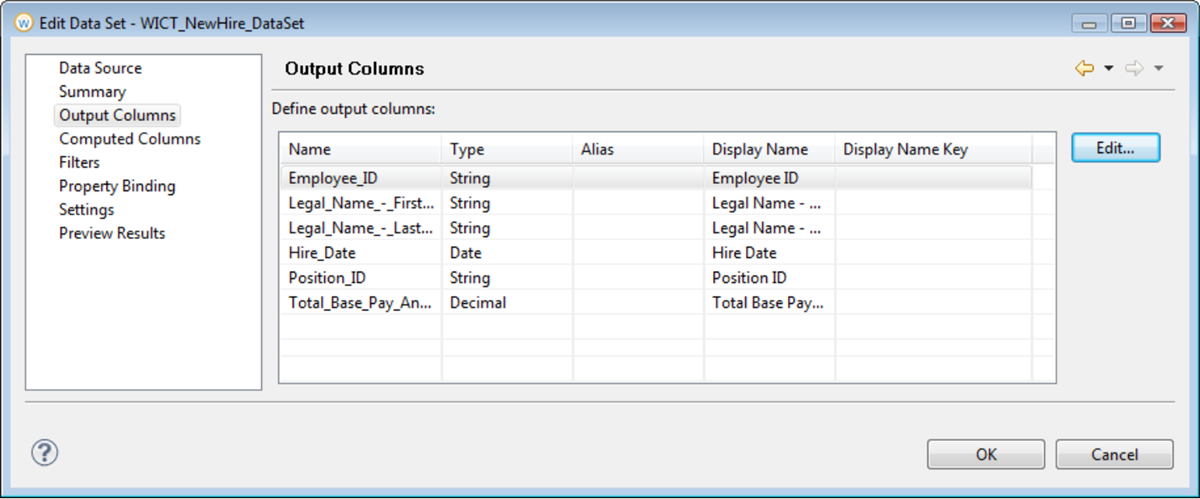
- Output Columns: Allows you to view and customize the output columns.
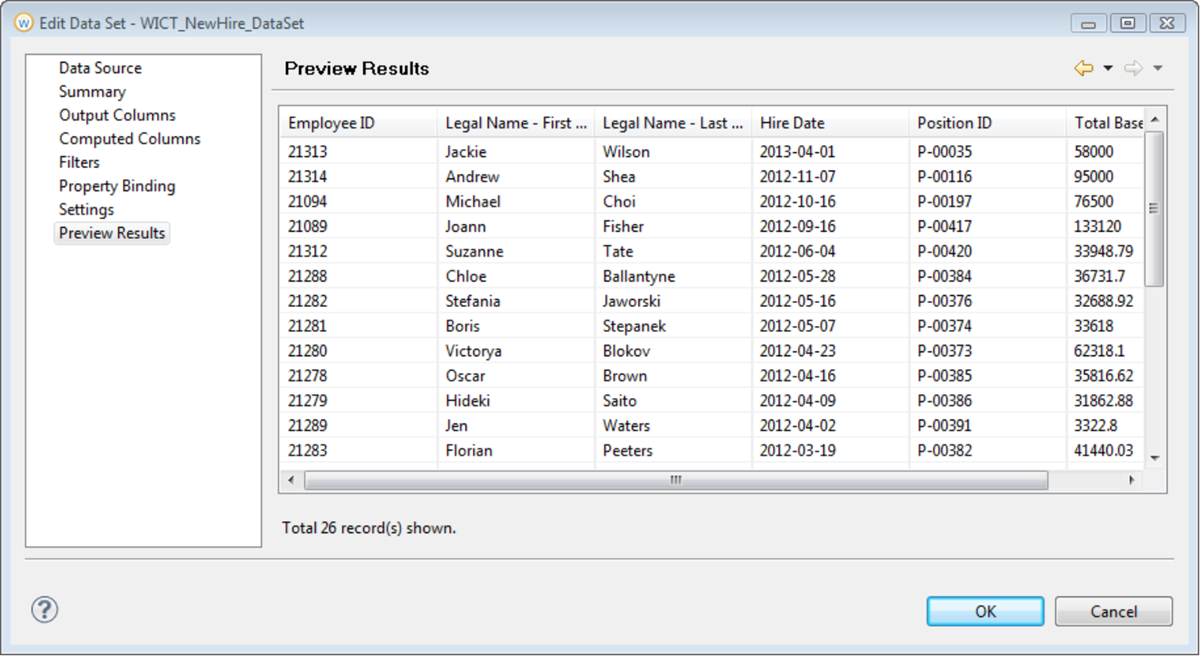
- Preview Results: Preview the data set results that the Report Designer retrieves from the data source.
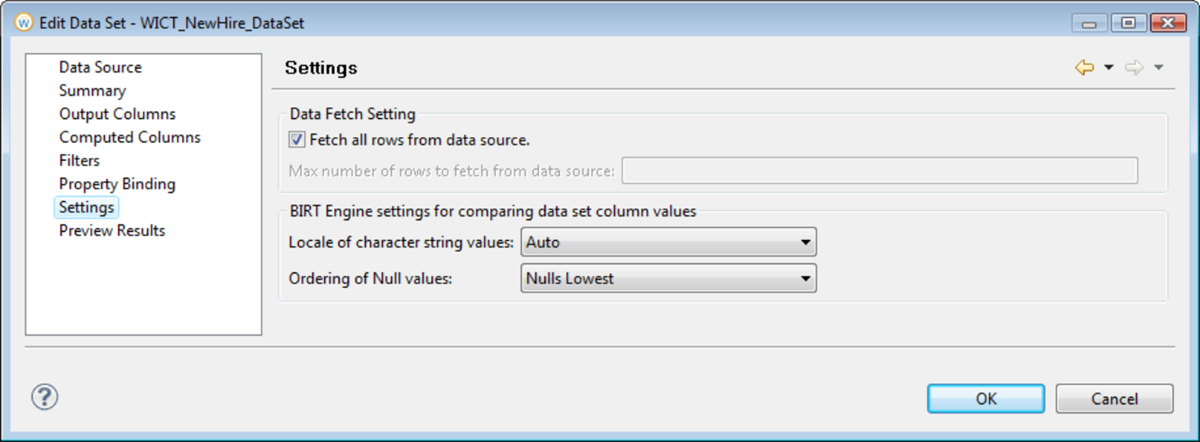
- Settings: Allows you to set the maximum number of rows that the Report Designer retrieves from the report data source.
- Computed Columns: Allows you to introduce new columns whose values are calculated from the values in the existing columns. It is recommended to do all calculations in Workday using Calculated Fields.
- Filters: Allows you to define filters that reduce the number of rows included in the output document. For performance reasons, it is usually better to define the filters in Workday Report Writer.
The Data Explorer view displays the new data set, with one node for each of the fields in the Workday custom report. Expand the data set node to view the data fields that it contains.
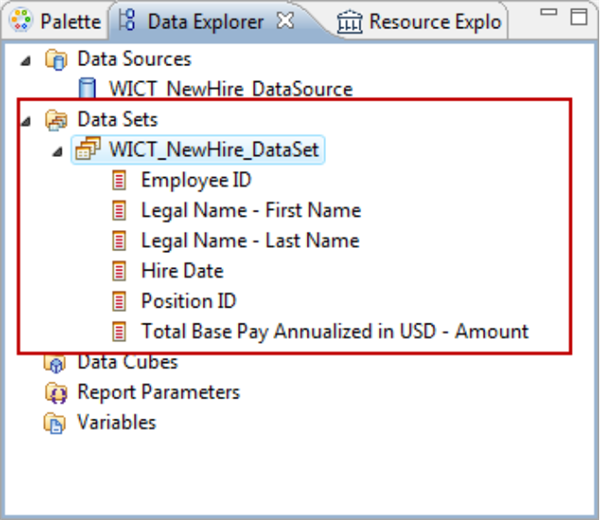
The Column Heading Override XML Alias labels are used for the field names in the Data Sets (underscores appear as spaces in Report Designer).
In the Report Designer, you use tables to represent the data in the report. When you drag a data set onto the Layout view in the main window, the Report Designer creates a table. Each row in the report has a corresponding column in the table. To do so, from the Data Explorer, drag the data set node to the Layout tab in the main window.
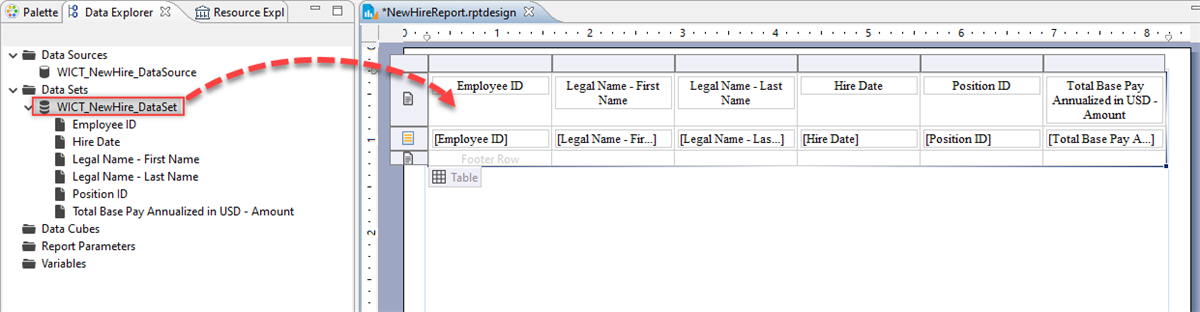
Tables in a data set provide access to data source rows based on their Binding properties. Dragging a data set or Data report item into an existing table allows you to add additional data to the table. To add another column to the table, select an adjacent column using the column guide cell, then right-click and select Insert> Column to the Right.
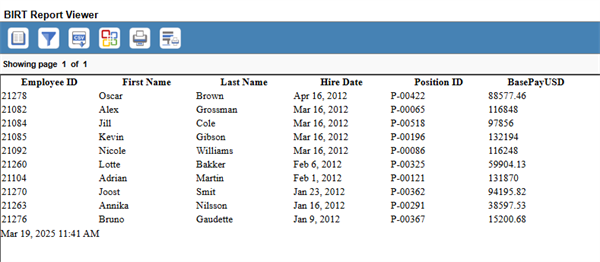
To preview the report, navigate to the menu bar Run > View Report > In Web Viewer. The Report Designer generates a report based on the data set that it retrieves from the data source.