Applying the Report Design to Format Forms
Overview
The report designer tool can apply design to individual records. This feature is important when generating form letters, invoices and other statements.
Objectives
By the end of this chapter, you will be able to:
- Create a form letter.
- Understand the inline vs. block display.
- Use the Apply per row functionality.
Formatting Letters
The previous activities used a standard report format but Report Designer enables you to design letters, invoices, and other documents. Using formatting properties, you can control the spacing and alignment of the objects on the report design.
General
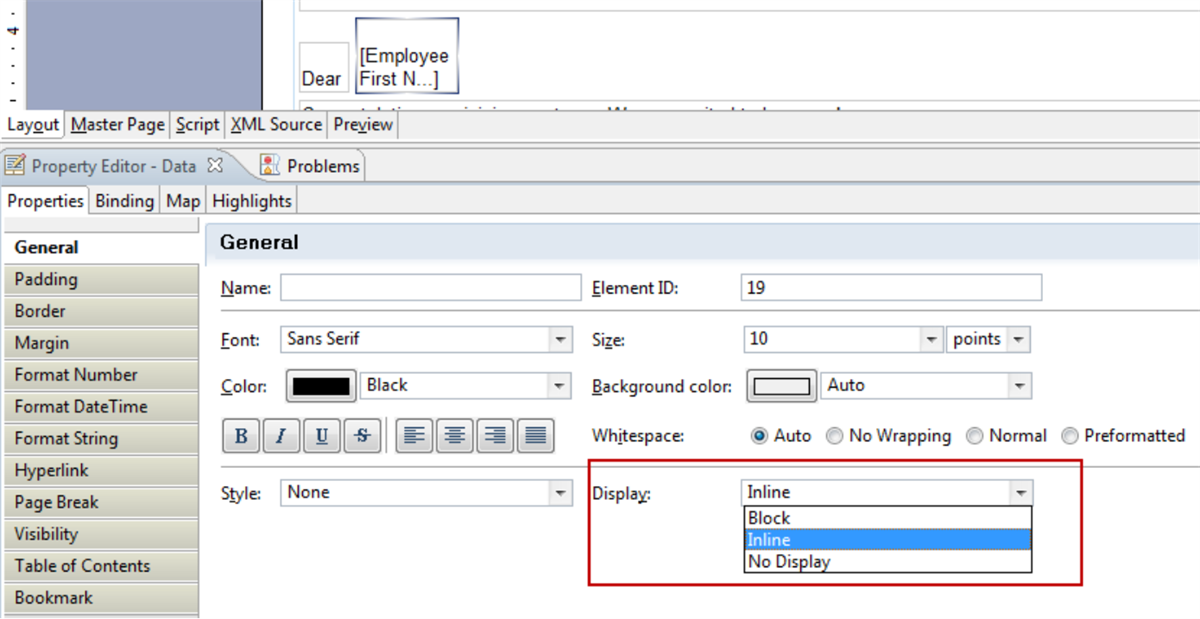
You can control how the data elements line up on the report design by using the Display field on the General tab of the Property Editor. Block will line fields up vertically and Inline will line fields up horizontally.
Padding
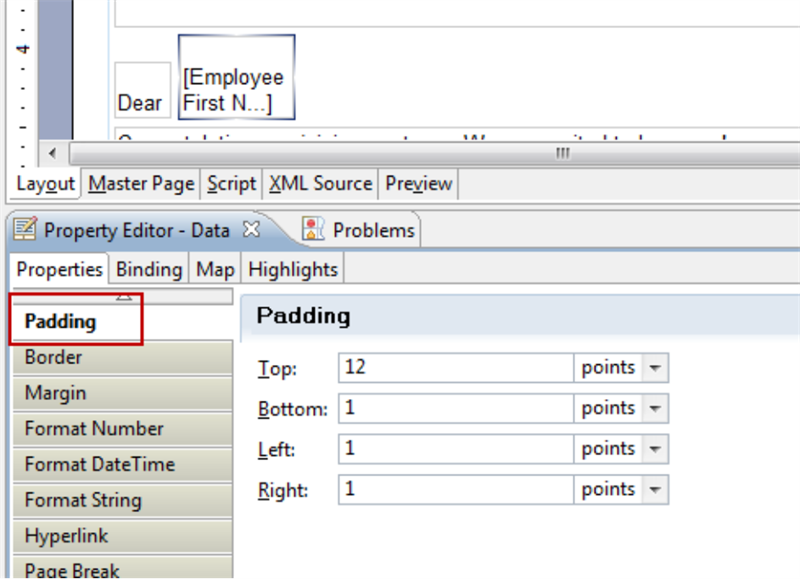
You can add space between report design elements by increasing the Padding values.
Master Page
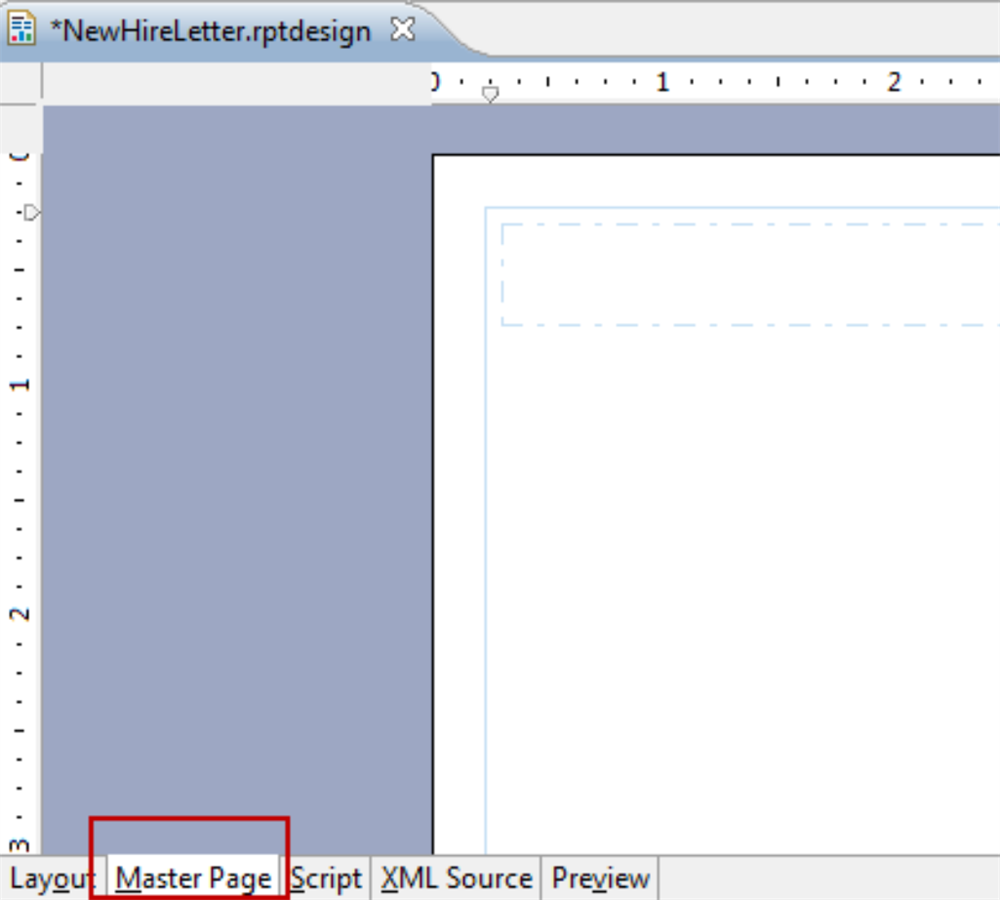
Just like in the Layout view, you can add report items such as grids, images, labels, and text to the header and footer areas at the top and bottom of the page to design the layout. You can also define several properties that apply to the master page; for example, header and footer height and master page width and height dimensions. The default master page layout includes the date on the footer, which it retrieves using the new Date() JavaScript function.
Writing Expressions
You can create many reports using data that comes directly from a data source simply by dragging the data set fields from Data Explorer to the report. Sometimes, however, you want to display information that is not in the data source, or you want to display data differently from the way it appears in the data source. You might also want to sort data using a formula, rather than sorting on an existing field. For these cases, and many others, write expressions using JavaScript.
An expression is a statement that produces a value. An expression can be a literal value, such as:
"It is easy to create reports with BIRT."
When you drag a field into the report, BIRT Report Designer creates a column binding with the correct expression. The expression specifies the name of the field from which the report displays values.
For example, the following expressions get values from the customerName field and the phone field, respectively:
dataSetRow["customerName"]
dataSetRow["phone"]
An expression can contain any combination of literal values, fields, operators, variables, and functions that evaluates to a single value. In the following examples, the first expression combines static text with a field, the second uses a JavaScript function, and the third multiplies the values of two fields:
"Order Total: " + row["orderTotal"]
row["orderDate"].getYear()
row["itemQuantity"] * row["itemPrice"]
Expression Builder
BIRT provides a powerful scripting capability that enables a report developer to create custom code to control various aspects of report creation. BIRT provides several JavaScript classes in addition to the native JavaScript classes that are a part of Rhino JavaScript. A report developer can access any of the BIRT classes and their properties and functions when writing an expression. The BIRT classes appear in the expression builder's Category list as BIRT Functions.
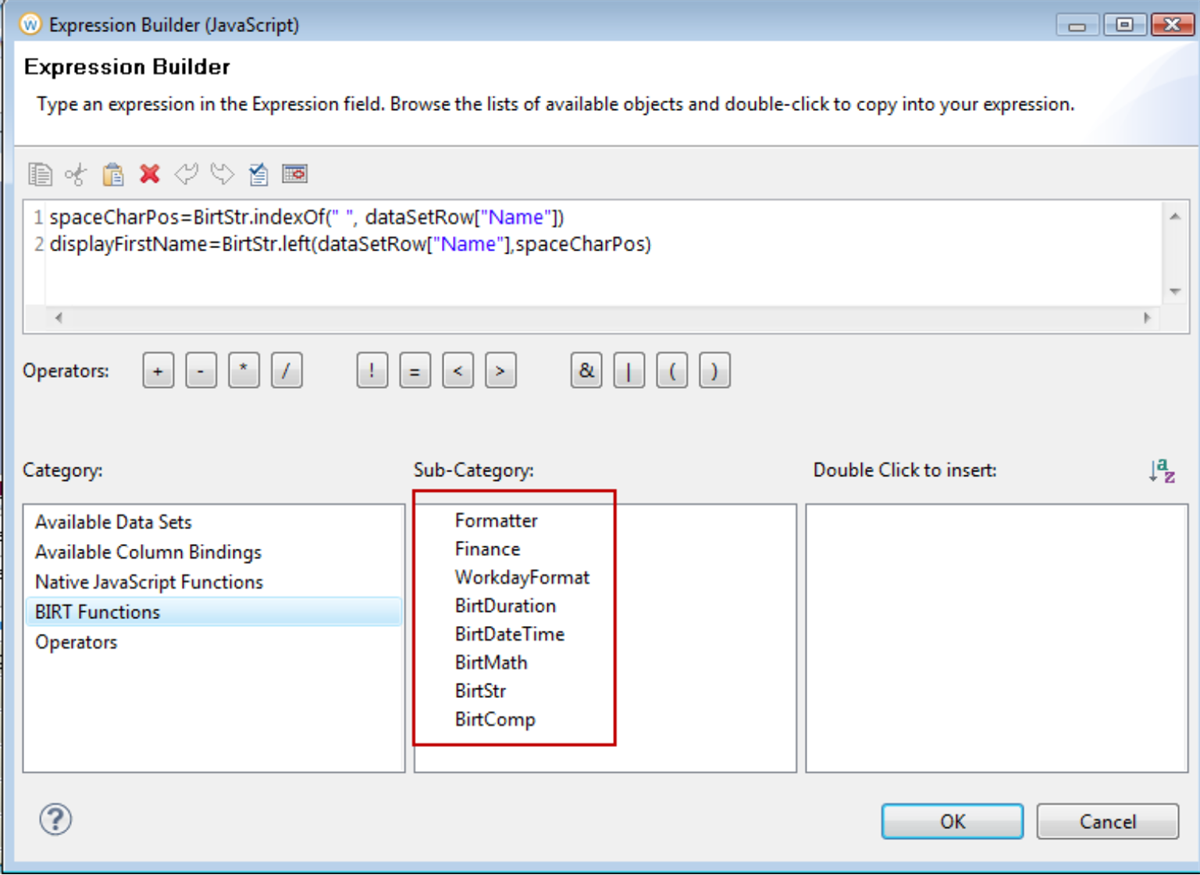
Example: Class BirtStr
The BirtStr class provides functions to manipulate strings, for example, to concatenate strings, trim extra spaces, get parts of a string, and display strings in lower or upper case.
The following example uses BirtStr.indexOf( ) along with BirtStr.left( ) to display the characters that precede the space character in a worker name. The BirtStr.left( ) function extracts a substring of a specified length, starting from the first character.
In this example, the length of the substring to display is equal to the numerical position of the space character. If the worker's name is Logan McNeil, the expression returns Logan.
spaceCharPos=BirtStr.indexOf(" ", dataSetRow["Name"])
displayFirstName=BirtStr.left(dataSetRow["Name"],spaceCharPos)
Date Formatting
In the Workday Report Designer, the Expression Builder provides several functions that mimic the behavior of the Workday application user interface when formatting various data types.
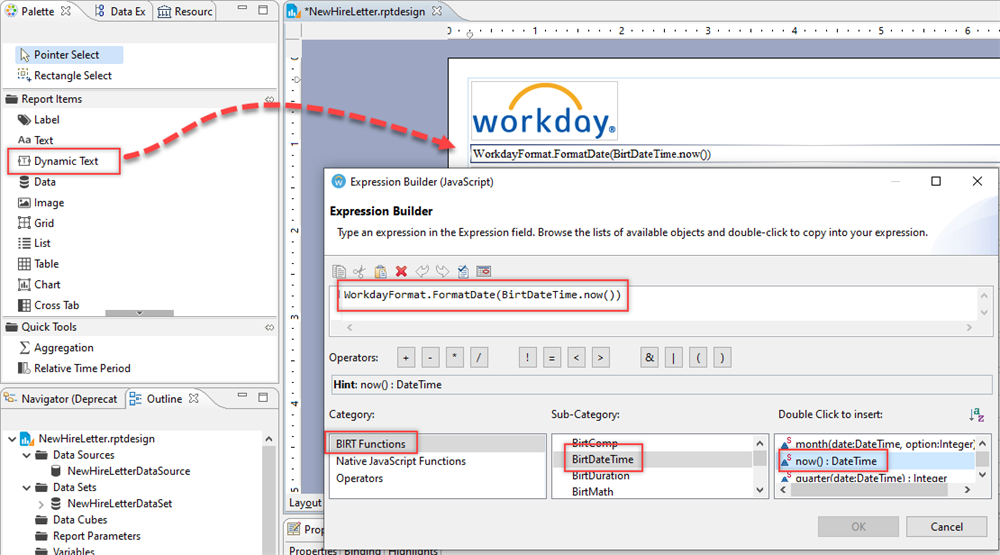
The Expression Builder categorizes these functions under BIRT Functions> WorkdayFormat when you edit expressions for data report items. These Workday formatting functions include
FormatDate
, FormatDateTime
, and FormatTime
.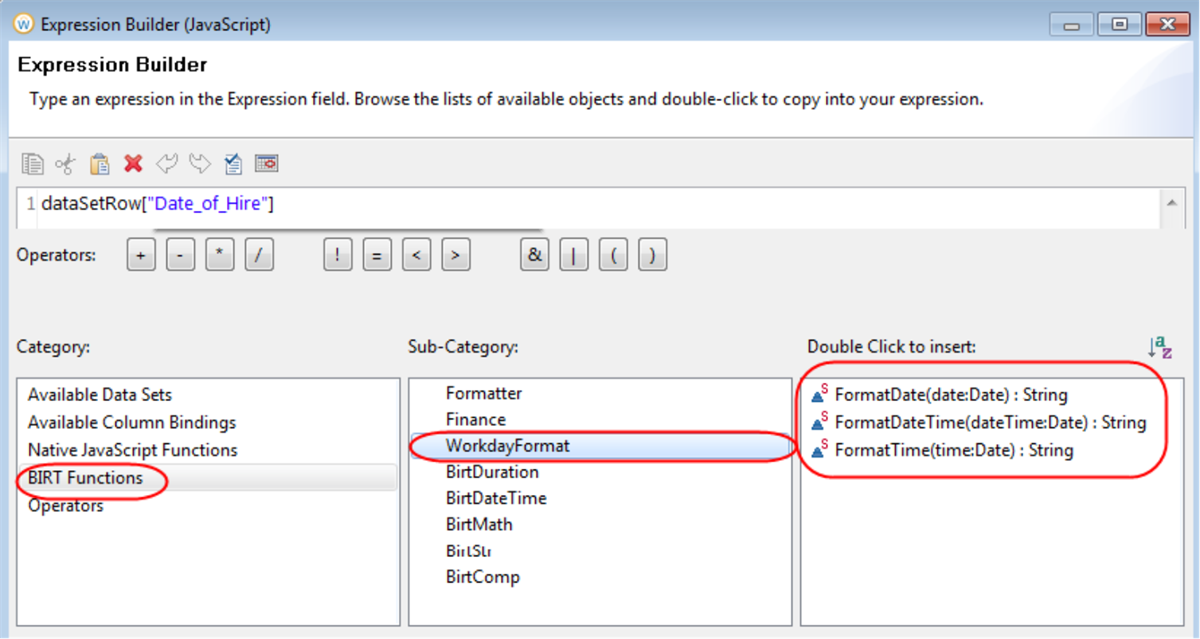
You can format a date by using the following syntax:
WorkdayFormat.FormatDate(DATE)
- where DATE is the date value you wish to format. The returned value is the date formatted as a String, using the date-format patterns dictated by the locale.Hiding Elements
Report Elements are very easily hidden, using the visibility section in the properties tab or a script.
To Hide an Element using the visibility, simply check the 'Hide Element' checkbox and enter the hide condition expression that will result in the element being hidden in the box provided.
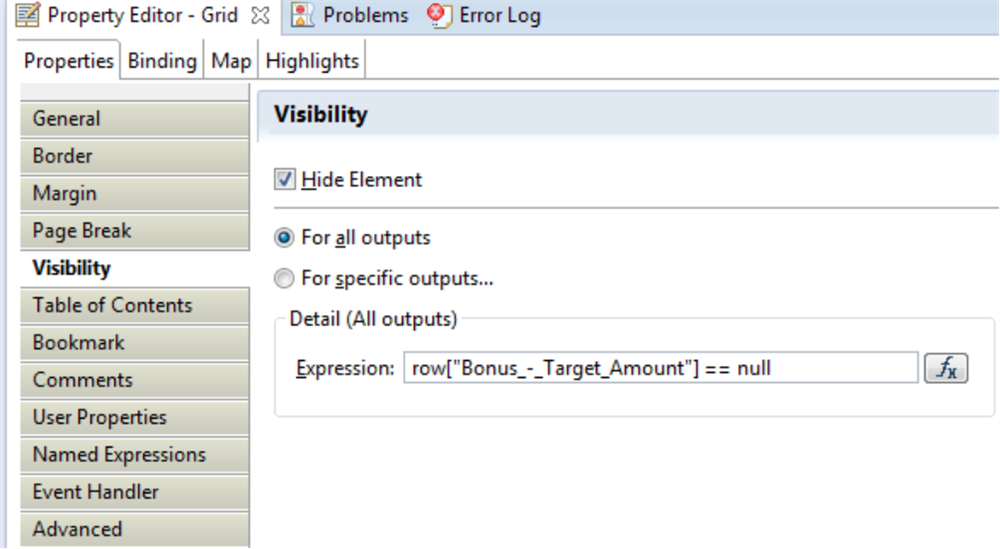
To Hide an Element using script, select the element that you wish to add a script for, then select the Script tab. Change the drop-down script selector to 'onRender' and enter your script.
Hiding/Showing Scripts should be in the following format:
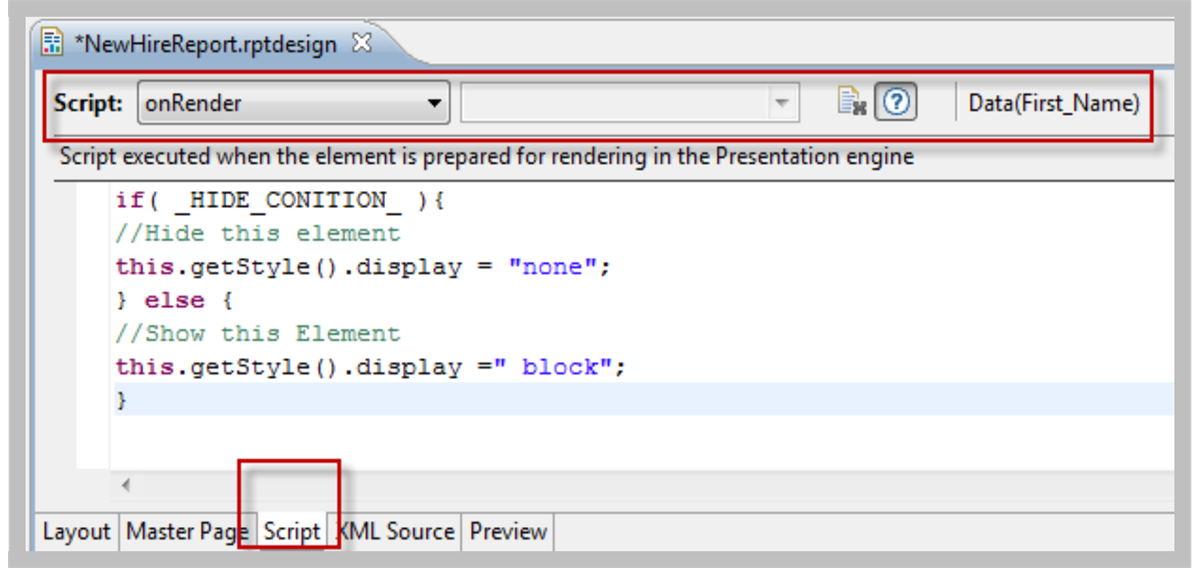
Labels and Text
Textual information can be as short as a single word, or span multiple paragraphs, even pages. Report Designer handles all lengths of text elegantly. When you insert a textual element, you do not need to calculate an element size to make it large enough to display all the text. Report Designer dynamically adjusts the height of elements to accommodate their contents.
The Palette view contains several report items that you can use to display text, each with a different purpose:
- Label:Use this report item to display static text within your report design, for example, titles that do not change. Also use labels for text that will need to be translated.
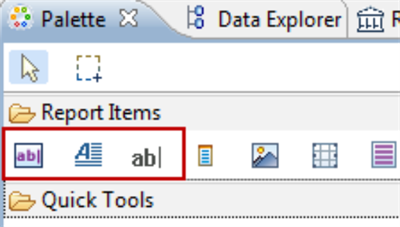
- Text:This report item allows you to insert a block of text. When you drag a text report item from the Palette view, the Report Designer opens the Edit Text Item dialog box, which includes a toolbar that provides a reminder of what the various HTML tags look like. By default, the content-type value is set to Auto.
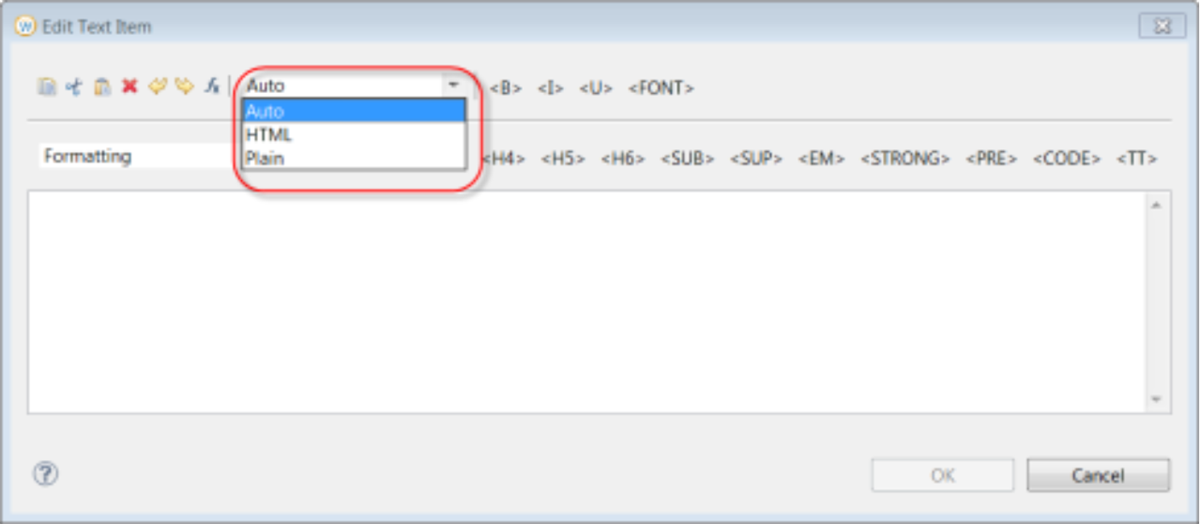 (You can use a text element and HTML tags to format the text. Note that you are not required to use HTML to create formatted text. If, however, you are well-versed in HTML or web design, you might prefer using HTML to create a block of formatted text. You can include HTML markup when adding text for this component using the HTML tag toolbar buttons.)
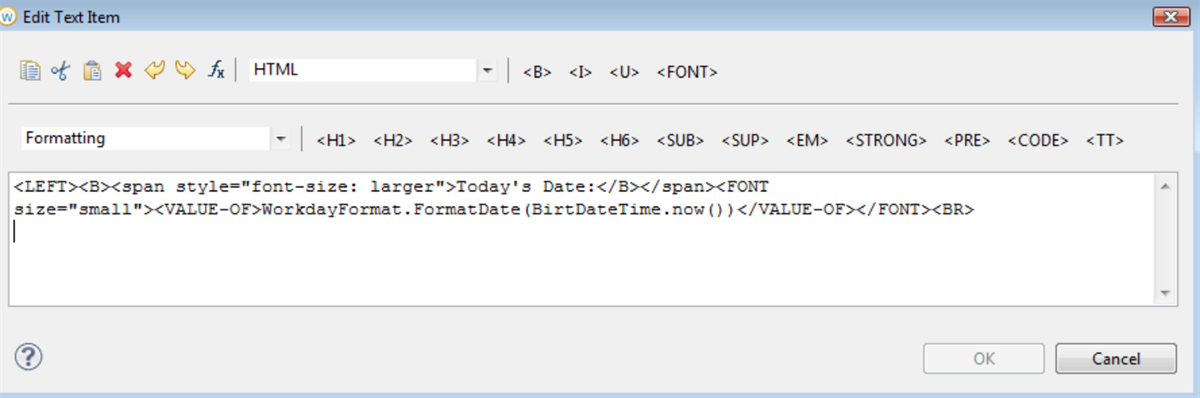 (You can also include dynamic text, but you must enclose the dynamic text within a <VALUE-OF> tag. The category list on the left provides access to various tag categories for both HTML and dynamic text markup. The functionality of the Text and Dynamic Text report items is similar; however, they do use slightly different syntax.)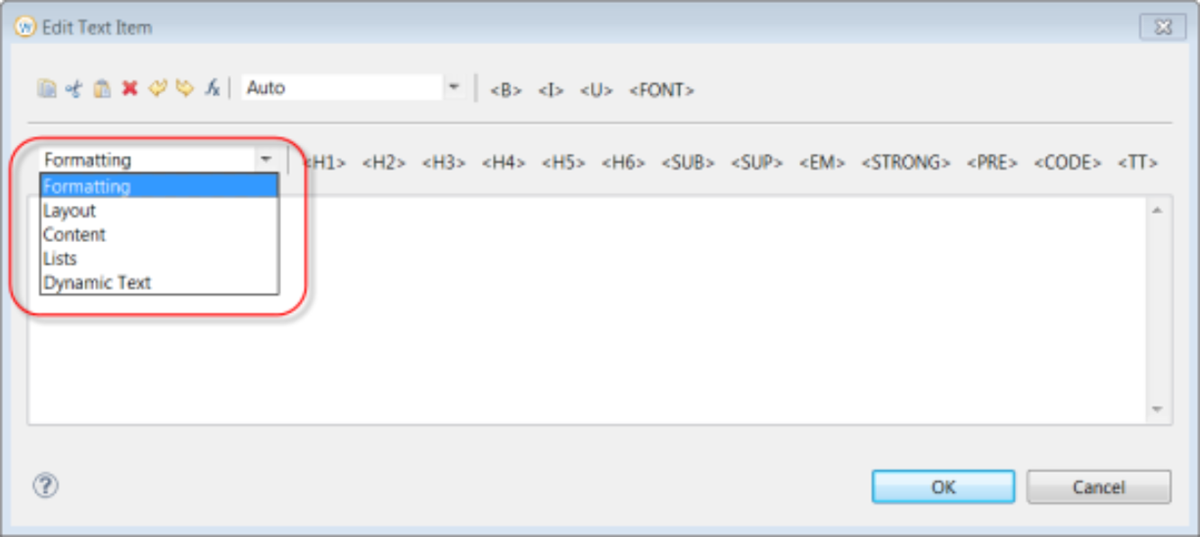
- Dynamic Text:The Report Designer interprets dynamic text as JavaScript. Use it where you need to use an expression to manipulate the value of the data before it is output to the PDF document. By default, the output of a dynamic text field is interpreted as HTML. Dynamic Text enables you to insert a specific dynamic value, such as current date.
Apply Report Design Separately to Each Row
The "Apply report design separately to each row" checkbox on the Manage Layouts page controls how Workday applies the report design to the data that the report returns. If you do not select this checkbox, Workday applies the report design to the data returned by the report as a whole.
Knowing that you intend to select the "Apply report design separately to each row" checkbox allows you to make assumptions when creating the report design that simplifies the design. You can assume that there will only ever be a single row of data, so enclosing all of the report items in a table is not required.
Workday breaks the data from the report into individual rows, applies the report design individually to each row of data, generates multiple individual PDF documents, and then merges them together into a single PDF document. This printing method is useful where each row of data in the report results in a separate page in the PDF.
Selecting the "Apply report design separately to each row" checkbox affects page numbering. Where the report design is applied separately to each row, the page numbers will be reset for each row.
In general, if you do not plan to select the "Apply report design separately to each row" checkbox, your report design should contain a table for the primary data set. If you plan to select this box, you can avoid including a table in your report design.
Page Breaks in Tables
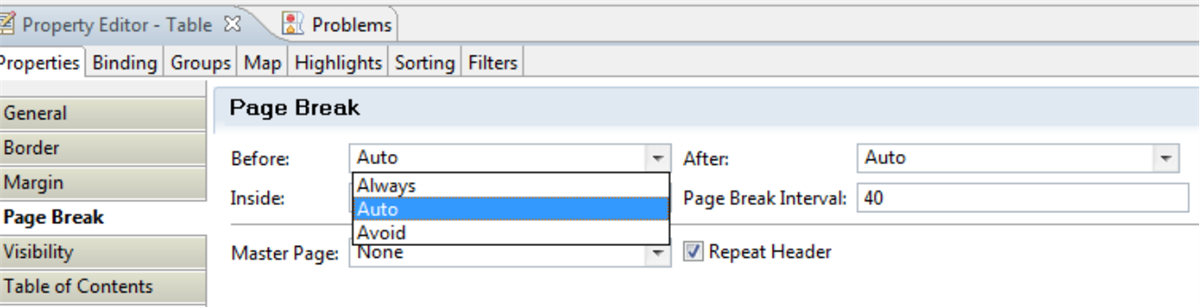
The Page break tab in the table properties gives you control over where page breaks are placed. Grids also have page break settings, if you are experiencing unexpected page break behavior, then check the settings on both the tables and the grids in the report design. The setting to avoid page breaks inside a table or grid may result in documents that contain a lot of while space as page breaks may be inserted before these tables and grids to maximum the possibility that they will appear on a single page.
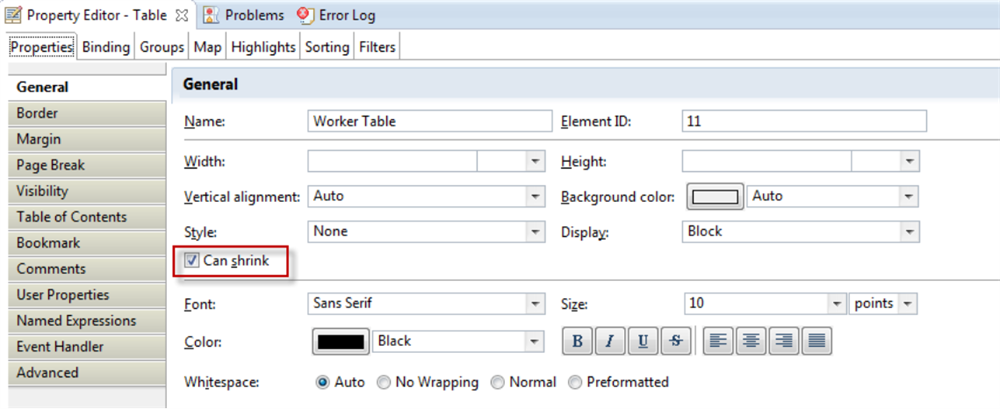
The option "Can shrink" eliminates empty space.