
Orchestration Logic and Event Flows
Overview
This chapter focuses on designing logic-driven orchestrations to create dynamic and adaptive workflows. Topics include implementing branching logic, integrating conditional data inputs, and utilizing launch parameters to enhance integration flexibility.
Objectives
By the end of this chapter, you will be able to:
- Implement Core Connector Data with orchestrations.
- Configure branching logic using Branch on Condition and Continue on Condition components.
- Use Run Logs for testing and debugging.
- Combine multiple data inputs for decision-making.
Handling Core Connector Data
Connectors like Core Connector Worker (CCW) often generate XML files as outputs. These files contain rich, structured data that orchestrations can process dynamically.
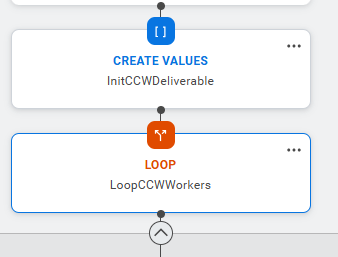
Using Connector Outputs in Orchestrations
To process XML data output from connectors:
- Configure the connector to generate XML output files with the required fields.
- Attach the XML file to the integration event using document tags so that the file is available to the orchestration. You can later filter event documents by label with the documents.labels global functions.
- In the orchestration, use the document functions to locate and read the XML document from the event. For example, filter by label and use get() to return the document as Data.
- Treat the document as XML so that you can apply XPath expressions.
- Use XPath to target the elements you need. For example, use /Employees/Employee to identify all employee records in the XML.
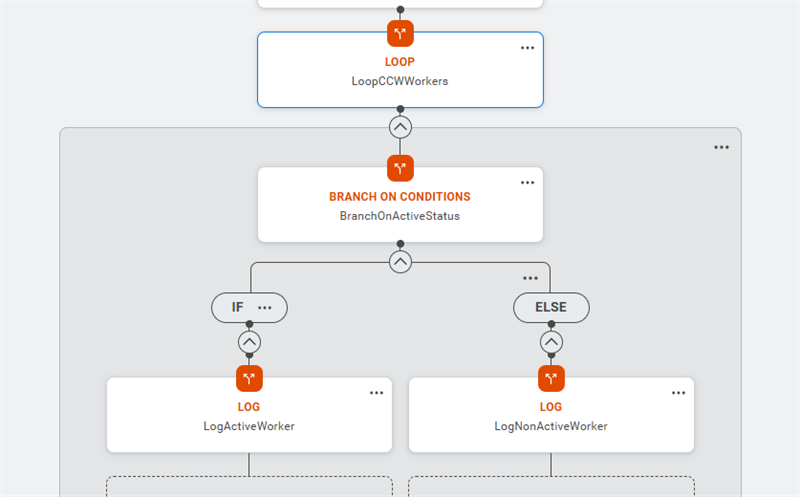
Transforming Connector Outputs
Connector outputs are often XML. When a downstream system requires JSON, use the Create JSON component and JSON Fold aggregation strategy. This approach produces a type-safe JSON structure and avoids the formatting errors common with manual text construction.
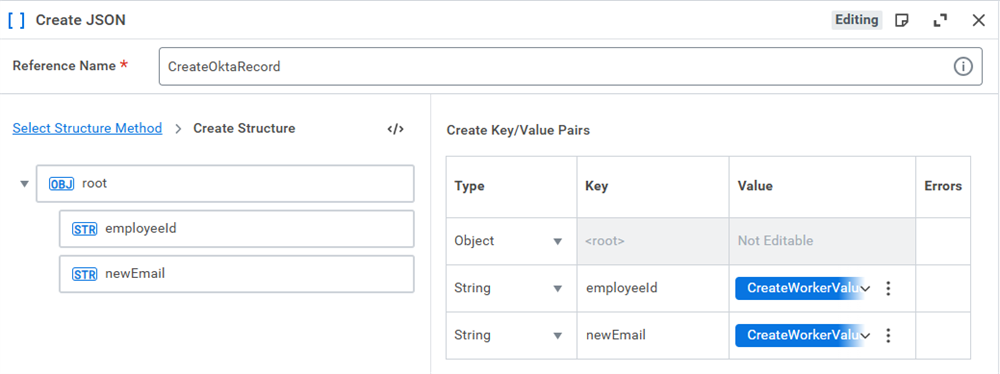
To generate a JSON Array, follow these steps:
- Use XPath to identify the repeating records, such as /Employees/Employee.
- Configure a Loop step to iterate over an XmlTypeIterator created from that XPath.
- Inside the Loop, add a Create JSON step. Map the XML values from the current loop item to the JSON fields. Use stringAtXPath for required fields and stringAtXPathWithDefault to handle missing data safely.
- Add an aggregation to the Loop step and select the JSON Fold strategy.
- Select the output of the Create JSON step as the fragment to aggregate.
- Use the aggregation output—a valid JsonType array containing all employee records—directly in downstream steps such as Send HTTP Request.
Iterating Over Connector Records
XML documents from connectors often contain repeating elements, such as many Employee nodes. You do not create an intermediate collection first. Instead, you define an iterator directly over the matching elements and use a Loop step to process them one at a time.
- In Expression Builder, call xmlResponse.iterator("/Employees/Employee") on the XML document to create an XmlTypeIterator for the employee elements.
- Configure a Loop step to iterate over that iterator. Each iteration exposes the current element as the Loop item (e.g.,, data.Loop.item).
- Inside the Loop, use XPath functions on the current item to retrieve leaf values:
- Worker name: data.Loop.item.stringAtXPath("/Employee/Name").
- Worker department with a fallback: data.Loop.item.stringAtXPathWithDefault("/Employee/Department", "Unknown").
- Use Expression Builder to format or validate extracted fields as needed before passing them to downstream steps.
- Use Orchestration Logic components, such as Branch on Conditions and Continue on Conditions, to separate valid and invalid records, log issues, and stop processing when required inputs are missing.
Branching Logic in Orchestrations
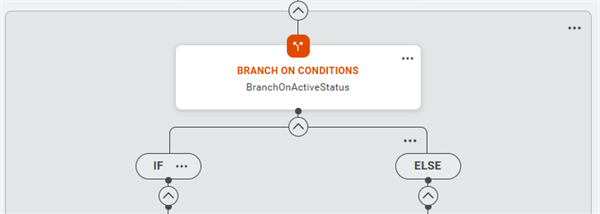
Branching logic enables an orchestration to follow different paths based on evaluated conditions. Use branching when the orchestration must apply different processing rules to different inputs, while still running within a single integration event.
Key Components of Branching Logic
Workday Orchestrate provides two core components for conditional control:
- BranchonCondition: Adds IF and ELSE branches so the orchestration can follow one of multiple paths based on a condition result. Use this when you need to process valid inputs in different ways, but still continue the orchestration in either path.
- ContinueonCondition: Evaluates a condition or set of conditions and either allows the orchestration to continue or ends it.
- If the assertion evaluates to true, the orchestration proceeds.
- If the assertion evaluates to false, the orchestration stops and records the specified message.
Configuring Conditions in the Expression Builder
Expression Builder lets you define conditions that control how an orchestration proceeds. Each condition contains two values and a relational operator. You can combine multiple conditions into a single statement when you need more complex logic.
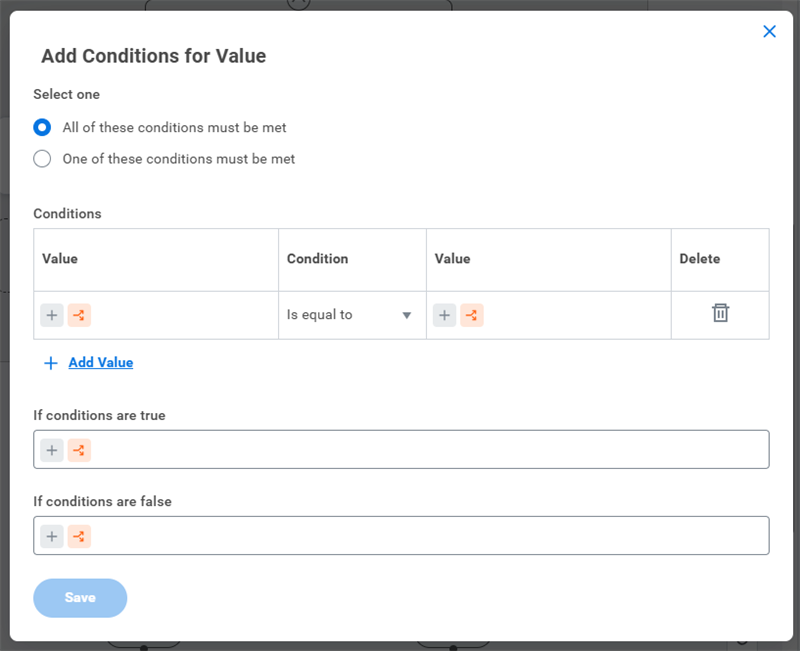
To define a condition:
- Use Expression Builder to define the first value, such as a field from an upstream step.
- Select a relational operator from the Condition menu, such as equals or greater than.
- Use Expression Builder to define the second value, such as a string or number literal.
To combine multiple conditions in one statement:
- Select All of these conditions must be met to evaluate them with a logical AND.
- Select One of these conditions must be met to evaluate them with a logical OR.
When you define a condition, you also define what happens when it evaluates to true or false. In many components, you do this by specifying outputs or paths for the
If conditions are true
and If conditions are false
results.Important
: Expression Builder supports nested conditions. Each time you add conditions inside another expression, the background darkens to show the current nesting level. Keep nesting shallow so that conditions remain readable and easy to maintain.Branching Condition Use Case
Use Branch on Conditions when a single orchestration must choose between different processing paths based on input data, while still staying inside one integration event.
Example pattern: route workers with high‑priority changes to an additional validation path, and all other workers to the standard path.
- Drag a Branch on Conditions component into the flow after the step that provides the worker data.
- In the Condition field for the IF branch, select Add condition for value.
- Use Expression Builder to compare a priority field from the upstream step (for example, changePriority) to a string such as "High".
- In the IF branch, add the steps that perform extra checks or approvals for high‑priority changes (for example, additional validation or logging components).
- In the ELSE branch, add the steps that handle the standard processing path.
- If downstream steps need data from the Branch on Conditions step, select Enable outputs and ensure each branch returns the same output names and types.
Branch on Conditions evaluates branches from left to right and executes only the first branch whose condition evaluates to true. Use additional IF branches when you need more than two paths, rather than nested IF expressions in a single condition.
Using Nested Conditions
Nested conditions let you group related checks in a single condition configuration, instead of scattering them across multiple components. They are useful when you must verify several requirements at once before the orchestration continues or selects a path.
Expression Builder supports nesting inside any component that allows conditions. When you add a nested condition, the background darkens to show you are working at a deeper level.
To configure nested conditions:
- In a component that supports conditions (for example, Branch on Conditions or Continue on Conditions), select Add condition for value.
- Use Expression Builder to set the first value, such as a field from an upstream step.
- Select a relational operator.
- Define the second value, such as a literal string or number.
- Within the same condition editor, add additional conditions and choose how they are combined:
- All of these conditions must be met (logical AND)
- One of these conditions must be met (logical OR).
- Use nested conditions when several checks must all hold for the same outcome, such as verifying that multiple required fields are present in a REST response before you proceed.
Use nested conditions to keep related checks together, but keep the logic shallow. When you need different processing paths, prefer separate IF branches in a Branch on Conditions step instead of deeply nested conditions in a single expression.
Troubleshooting Orchestrations
Debugging is essential for ensuring that orchestrations run as expected. When workflows encounter errors, produce unexpected results, or run inefficiently, debugging techniques help you find and correct the cause.
The Role of Logging in Debugging Orchestrations
Logs record what happens while an orchestration runs. They help you trace errors, review data, and confirm that each step behaves as intended. In Workday Orchestrate, you can use logging to:
- Investigate runtime errors by reviewing error messages and input or output data for failed steps.
- Monitor performance by examining information such as external service response times for potential bottlenecks.
- Debug specific steps by inspecting log entries that show how data moved through a complex orchestration.
You can use the Log step to write a message at runtime, which is stored in the orchestration logs, or use Log to File to store log information in a CSV document that is available to other users and can be attached to the integration event
Working with Run Logs
Workday Orchestrate surfaces run logs directly in the builder so that you can review execution details while you design and test an orchestration.
Steps to Access Logs
- Open the orchestration in Orchestrate and run it or open a completed orchestration event.
- At the bottom of the Orchestrate window, select the Run Logs tab next to the Build Logs tab.
- Use the controls in the Run Logs tab to narrow and search the results, for example:
- Filter by date and time range.
- Filter by log level, such as error or warning.
- Filter by step or component name.
Log Types and Use Cases
Workday Orchestrate provides several categories of logs, each with a specific purpose for debugging and monitoring. These log types help you track orchestration execution, review requests, and troubleshoot issues.
Log Type | Definition |
|---|---|
Access
| Provides information about client requests, such as the caller IP address and request path. Use Access logs to understand who called the app and how often. |
App
| Provides debugging, informational, warning, and error messages for an app request. Use App logs to trace orchestration steps and identify failures or unexpected behavior. |
Audit
| Enables administrators to track changes to apps and configuration, including promotions from development to production. Use Audit logs to answer questions about who changed what, and when. |
Remote
| Provides information about requests to an external service. Use Remote logs to debug integrations with external endpoints and to review response codes or latencies. |
Understanding Log Fields
Logs in Workday Orchestrate include fields that describe what happened during execution. The following fields are especially useful for debugging:
Field | Description | Examples / Values
|
|---|---|---|
wd_message
| Contains detailed information about an event, such as step execution errors or validation failures. For the Workday Orchestrate service, this field helps you review log information about your orchestrations. | "Validation failed: Worker ID is missing" |
wd_level | Categorizes log entries by severity or type. | DEBUG : Debugging details
INFO : Normal execution
WARN : Warnings
ERROR : Critical issues |
wd_date_time
| The timestamp of the event, formatted in the developer's local time zone. | 2024-01-01T12:00:00+0000 |
wd_response_code
| The HTTP status code returned for an API request. | 401 Unauthorized , 200 OK |
wd_request_bytes / wd_response_bytes
| The size of the request or response payload in bytes. | Request: 1024 bytes
Response: 2048 bytes |
wd_env
| Indicates the tenant environment where the orchestration ran. | PROD : Production
SANDBOX : Sandbox
IMPL : Implementation |
wd_gateway_url
| The API gateway URL associated with the orchestration request. | https://api.workday.com |
wd_user_agent
| The browser or client type used to interact with the orchestration. | Mozilla/5.0 (Windows NT 10.0; Win64; x64) |
wd_app_id
| The unique identifier for the app running the orchestration. | YourApp_zlwcf |
Workday logs include additional fields beyond those listed here, such as API-specific metadata and session identifiers. These fields can provide deeper insight depending on your debugging needs and the complexity of the orchestration.
Practical Logging Techniques
Effective debugging requires more than opening logs. Workday Orchestrate provides tools that help you focus on the events that matter so that you can identify issues and understand how an orchestration runs. In some cases, you may need to keep orchestration logs for longer than the retention period in Workday Orchestrate. Download logs regularly for key workflows so that you retain critical data before it is purged.
Filtering and Searching Runtime Logs
Runtime Logs can contain many entries for a single orchestration run, especially in production. Use filters and search together to narrow results to the events that are relevant to the issue you are investigating.
Use filters in the Runtime Logs tab to limit entries by:
- Environment (wd_env), such as wd_env = PROD to review events in the production tenant.
- Date and time (wd_date_time), such as an is between range for the incident window.
- Log type (wd_log_type), such as wd_log_type = remote to focus on external service calls.
- Response code (wd_response_code), such as 401 or 500 to review failed requests.
- Message text (wd_message), such as “Step execution failed” or “Validation failed”.
Use the search box to query indexed fields such as wd_message, wd_response_code, or wd_gateway_url. Combine filters and search terms to narrow results further. When available, save common filter and search combinations so that you can reuse them during future investigations.
Isolating Components
Complex orchestrations can be difficult to debug when many steps run at once. Isolate the area that is most likely to cause the issue so that you can test it in a controlled way.
Consider the following approach:
- Identify the part of the orchestration that is most likely responsible, such as an API call, validation, or Loop step.
- Temporarily disable unrelated downstream steps, such as notifications or report generation, so that only the relevant steps run.
- Replace dynamic inputs with static values or Create Values steps that represent edge cases and known problem scenarios.
- After you resolve the issue, re‑enable downstream steps one at a time and confirm that the complete orchestration still runs as expected.
Debugging Loops
Loops that process large datasets can fail for a small number of records. Use summaries and detailed logs together so that you can find and correct the underlying problems without disrupting the entire workflow.
- Use aggregated outputs for summaries. For example, log messages such as “Error – Missing hire date for Employee ID 12345” to highlight problematic records.
- Review validation details. Use failedValidations to see the validation name, severity, and message, and look for patterns such as repeated missing tax IDs.
- Test smaller subsets. If summaries do not reveal the cause, run the Loop with a single record or a small sample so that you can inspect the payload and responses in detail.
This combination of high‑level summaries and record‑level tests provides a complete view of Loop behavior.
Error Handling in Nested Loops
Nested loops fail in three main places: inside the inner loop, inside the outer loop, and in steps that run between them. Use handlers at the right scope so one bad item does not break the rest of the work.
Inner loop (child records):
- Attach an Iteration Error Handler to the inner Loop when you want to keep processing other child items after a failure.
- In the handler, log the error and identifiers for the current item, then expose a flag such as isSuccess so downstream logic can detect that the item failed.
- Treat failed child items as “skipped” or “invalid”.
- Still aggregate or store results from successful child items.
Outer loop (parent records):
- Attach a Loop Error Handler to the outer Loop when any failure for a parent should stop processing the rest of that parent.
- In the handler, log which parent failed and why.
- Decide whether to:
- Propagate the error so the global handler marks the orchestration as failed, or
- Surface a controlled outcome (for example, a status output) so later steps can branch.
Steps between loops:
- For steps that run after an inner loop but before the outer loop continues (such as aggregations or summary writes), use a standard step‑level error handler.
- Use that handler to:
- Log errors and clean up partial state.
- Control whether the outer loop moves on to the next parent or stops entirely.
Design guidelines for nested loops:
- Inner loop: handle errors per item so one bad child does not stop other children.
- Outer loop: decide whether a parent‑level failure should stop that parent only or the entire orchestration.
- Always guard access to loop outputs with your success flag (isSuccess or similar) so downstream steps do not try to use data from failed iterations.
Monitoring API Requests
When orchestrations call external services, Remote logs help you understand how each request behaves and why a call might fail.
Remote logs capture details such as:
- Request payloads that show the data sent to the external service.
- HTTP status codes, such as 401 Unauthorized, 404 Not Found, or 500 Internal Server Error.
- Response times, which help you identify performance bottlenecks.
To debug API requests:
- Open Run Logs for the orchestration run and filter by wd_log_type = remote.
- Review the wd_message field for error details, wd_response_code for status codes, and wd_request_bytes and wd_response_bytes for payload sizes.
- Re-run the orchestration with test data as needed, and confirm that authentication tokens, endpoints, and headers are configured correctly.
For example, if Remote logs show repeated 401 Unauthorized responses, inspect the request headers to confirm that the token is valid and that the request uses the expected authorization method.