
Composite Reporting: Basic Concepts
Overview
Composite reporting is a powerful tool that allows you to combine data from multiple data sources into one report using subreports. In this chapter, we will review the basic mechanics of Workday composite reporting and apply these concepts to create HCM composite reports.
Objectives
By the end of this chapter, you will be able to:
- Describe key differentiating features of composite reporting.
- Build a subreport for use in a composite report.
- Configure rows and columns on a custom composite report.
- Configure repeating column groups on a composite report.
- Improve report readability using outlining and formatting features.
- Configure static and dynamic headers and footers.
- Incorporate multiple data sources into a single composite report.
- Configure prompts at the subreport level and at the composite report level.
- Consolidate duplicate prompts using prompt sets.
Composite Reporting Overview
Composite Report Functionality
Features of Composite Reporting
Composite reporting has a wide variety of uses. The main use for composite reports is to join and format data.
Report Uses | |
|---|---|
Join Data |
|
Formatting |
|
Composite reports allow you to pull the contents of subreports into a single report. This enables you to specify and configure both columns and rows displayed on the composite report. You can also report on the data at the column, row, or cell level. You can perform column, row, and cell calculations and sort and filter them.
Additionally, you can format data with options similar to that of a spreadsheet, creating headers and footers as well as applying different styles.
Report Features | |
|---|---|
Functionality |
|
Multi-Dimensionally |
|
Design and Format |
|
Use Cases
Composite reports are useful tools when other report types do not adequately fulfill your reporting needs. You can use multiple subreports with different data sources to pull data together into a comprehensive report.
Here are some examples of composite reports. Try to spot some of these composite report features in them.
- Multiple data sources
- Reverse sign
- Analytic indicators
- Calculations (Column, Row, and Cell)
- Drillable data
- Report formatting
- Empty rows and columns
- Headers, footers & more (Hierarchies & Outlining)
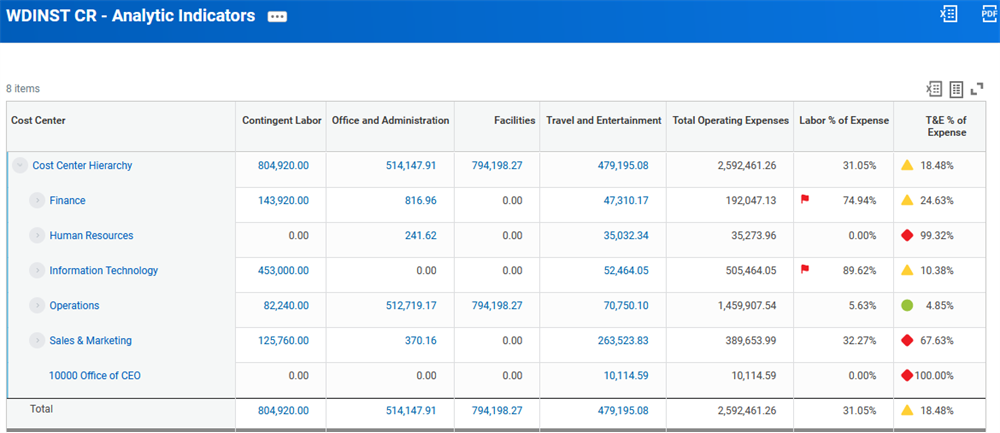
Analytic Indicators report output.
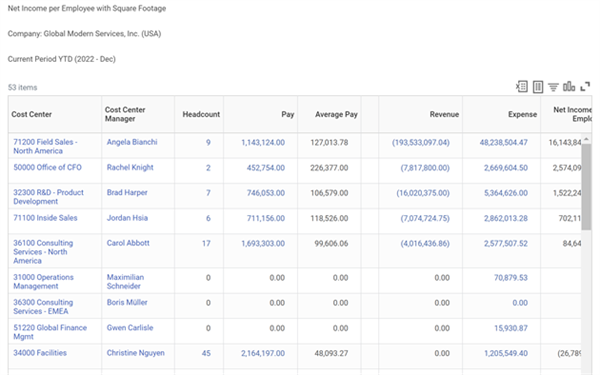
WDINST CR Headers and Footers Report Ch 1 Features of Composite Reporting
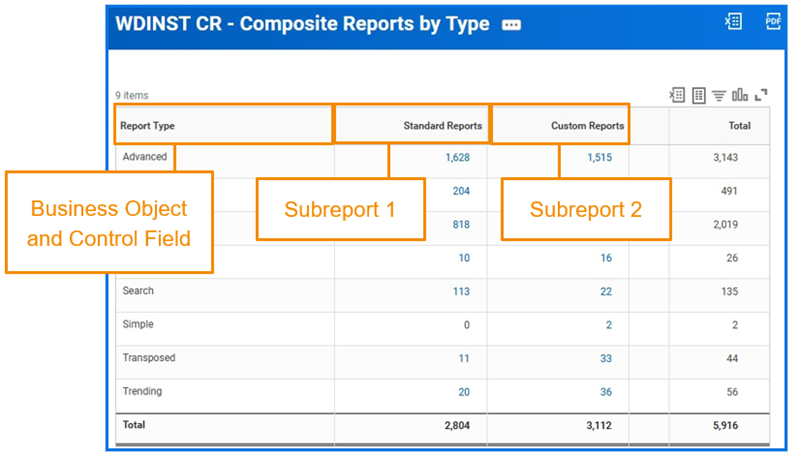
The image below is another example of a composite report. It inventories both standard and custom reports by type. These reports use two different data sources, joined by the Report Type business object. Instead of two separate reports, one about custom reports and one about standard reports, we have a single composite report.
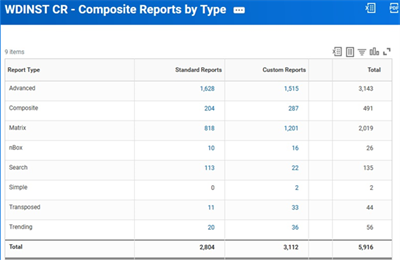
Report result - Composite Reports by Type
Delivered Composite Reports
Workday delivers several composite reports for HCM use cases. Below are some common examples.
EEO-1 Employment Data
The
EEO-1 Employment Data
report is a compliance survey mandated by federal statute and regulations. The survey requires company employment data categorized by race and ethnicity, gender, and job category.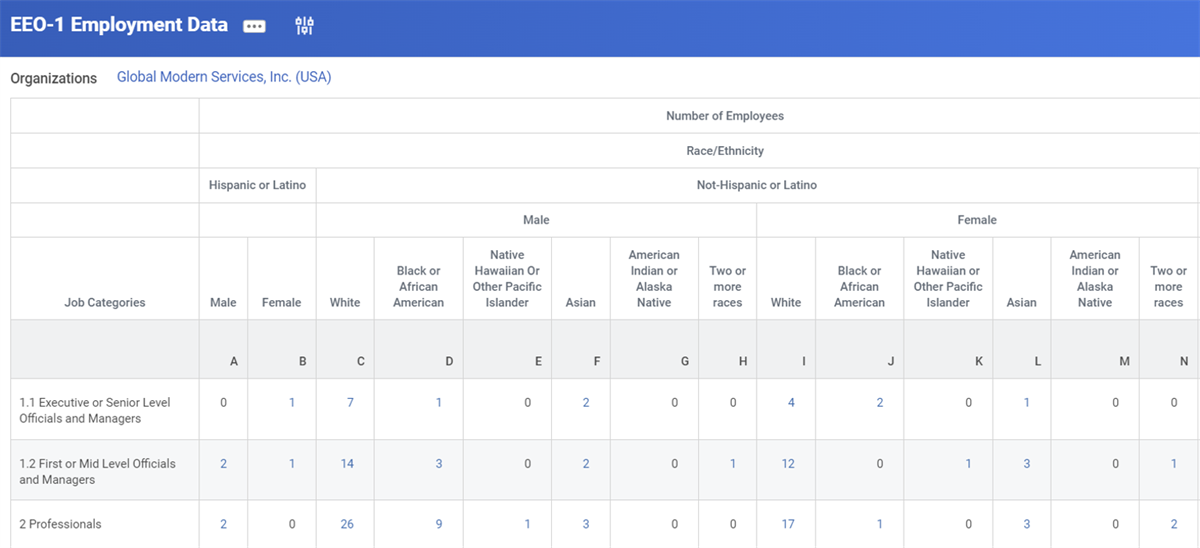
Example output of the EEO-1 report.
Expense Report Line Exceptions
The
Expense Reporting Line Exceptions
report details the count of expense lines and amounts by supervisory organization that are exceptions to the expense items. It defines thresholds in the prompts for hotels, meals, and airfare for the specified time period based on the expense report accounting date. This report has required prompts for company, time period, period, hotel items and threshold, meal items and threshold, and airfare items and threshold. This report evaluates the thresholds set against the line amount in base currency.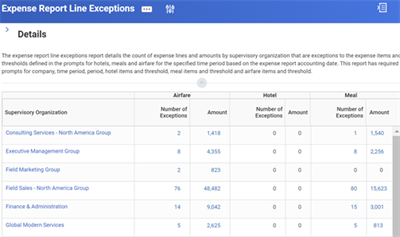
Example output of the Expense Report Line Exceptions report.
Employee Movement by Organization
The
Employee Movement by Organization
report displays headcount, transfers, terminations, and hires by organization. This report uses the Trended Workers data source.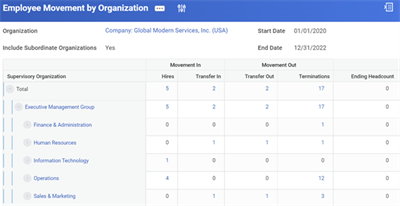
Example output of the Employee Movement by Organization report.
Planning a Composite Report
When planning a composite report, consider the following before you start to build:
- What are the common dimensions that serve as the control field column between data sources?
- How are you summarizing groupings?
- What information do you want to display via the drill-down and detail data fields?
- Are you using prompts at runtime? If so, which prompts do you need?
The Steps to Build a Composite Report:
To build a composite report, first build the subreports. When you build a subreport you:
- Define the Group by Fields.
- Select the Summarization Types.
- Define the Drill Downs and Details.
- Select the Filters and Prompts.
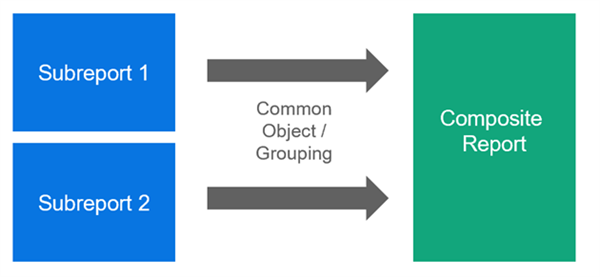
A composite report can contain one or many subreports. Each subreport needs to have a common object or grouping to build the composite report.
Once you build all your subreports, you can build a composite report. When building your composite report, you can:
- Specify the Business Object / Control Field.
- Define the Control Field Column.
- Define the Data Columns.
- Define the Rows (Optional).
- Define the Cells (Optional).
Finding a Common Control Field
A common control field can be a delivered, calculated, or custom field on the report's primary business object. To find a common control field, identify common instance data dimensions that have the same related business object.
In the following example, we want to build a composite report from three separate business objects: Journal Line, Payroll Result Line, and Trended Workers. To do this, we run the
Business Objects Details
report for these business objects to find a common dimension to use as the control field.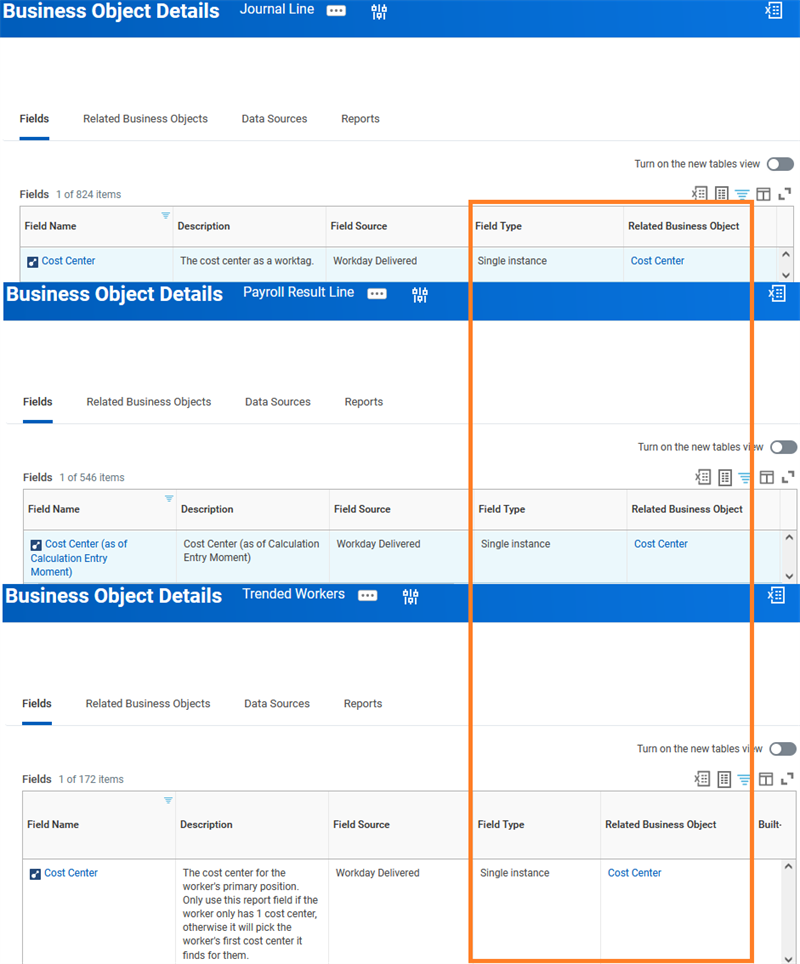
- Journal Line: The field name is Cost Center, the field type is single instance, and the related business object is Cost Center.
- Payroll Result Line: The field name is Cost Center (as of Calculation Entry Moment), the field type is single instance, and the related business object is Cost Center.
- Trended Worker: The field name is Cost Center, the field type is single instance, and related business object is Cost Center.
These fields are all single instance and have the same related business object of Cost Center. We can use this field as the common dimension between reports. We will build the report using Cost Center as the control field column:
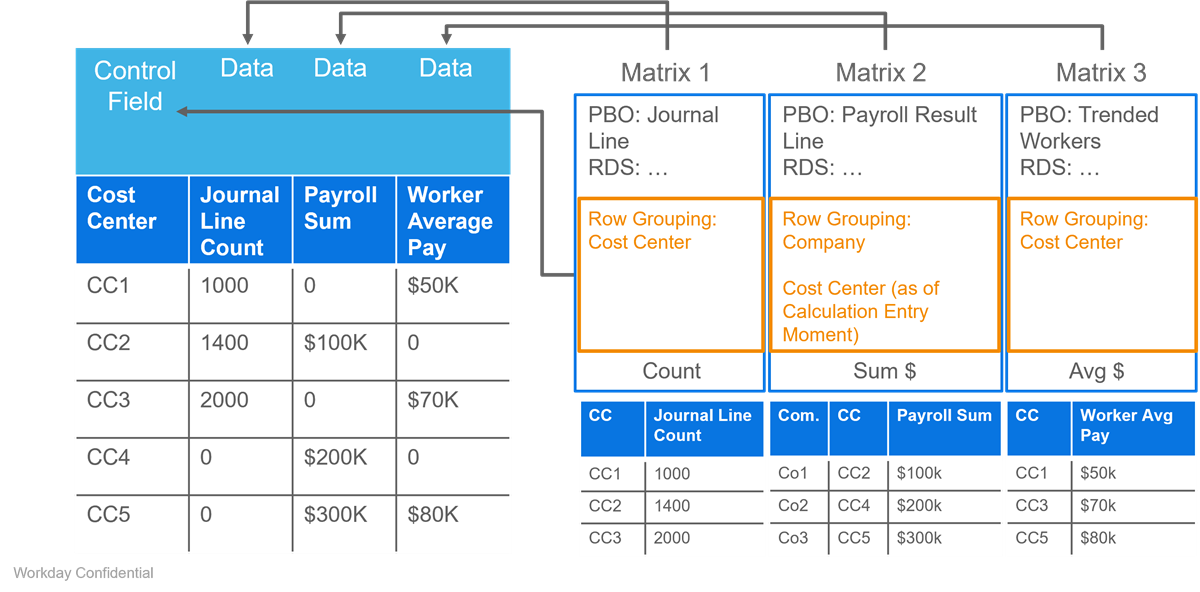
Note
: The fields will often have a common name, but not always, as shown here.Subreports
Subreports are the foundation for composite reports. Composite reports specify the final design and layout of the report, perform the data calculations, and format the results. However, the subreports provide the data used in the composite report. You can build subreports using different data sources, joining data from different aspects of Workday.
Subreports:
- Create the data used in composite reports.
- Use one data source per subreport.
- Can be Advanced, Trending, or Matrix type.
Composite reports:
- Join subreport data based on common key data.
- Define the layout and column and row sequencing.
- Perform calculations and format the results.
Building a Composite Report
Column Types
There are five Workday-delivered column types:
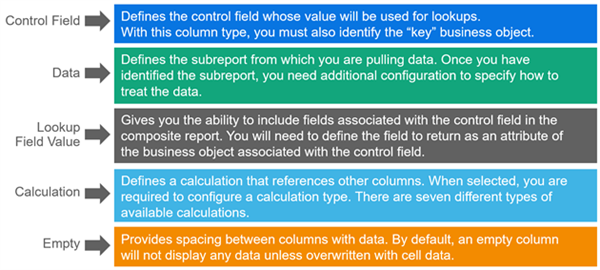
Composite Reports Workday delivered Column Types
Here are some examples of how to use each of the column types:
- Control Field: After you identify multiple subreports to include in your composite report, this field ties the subreports together. For example, if you build your composite report to identify the link between headcount and expenses, your control field is likely Cost Center.
- Data Column: This includes any information from your subreport you want to display here. For example, in our composite report, you want to pull in the sum totals of ending headcount and annual base pay generated for each cost center in our headcount subreport.
- Lookup Field Value: If you want to include additional data related to your control field column, you can include that data here. For example, you can include the cost center manager for a Cost Center control field.
- Calculation: We explore the various calculation types later in this chapter, but let us examine an example of when we might use the calculation engine. Say you have a report with several columns that you want to sum. Rather than using a Sum calculation and identifying each individual column that you want to include in the sum, you can use a Sum Range calculation to identify the first and last column to sum. This will then include all columns within that range.
- Empty Column: This inserts an empty line in the report at the location you specify. For example, you might want to add a space between time period columns or after totals columns. You could also use this to include a cell calculation. We explore this in more detail later in the course.
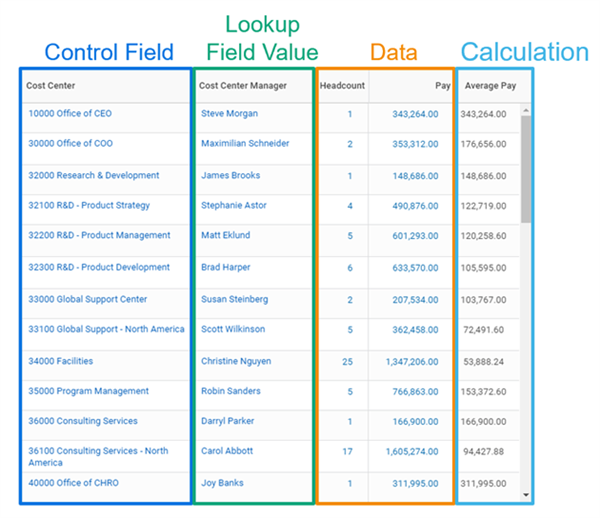
Composite Reporting Column Type Examples
Building a Composite Report
Create a composite report using the
Create Custom Report
task. When you select the composite report type, you can no longer select a data source. Remember, this is because your matrix subreports now function as your data sources. Instead, you have the option to select a prompt set.After selecting the composite report type, enable business objects to use for filtering and grouping data throughout your report.
These enabled business objects drive the available valid values for the control field.
The business object must match the dimensions, such as rows and columns, used in all the subreports compiled in the composite report. If you plan to filter in the lookup data rows, configure the business objects.
Using hierarchical filtering in a lookup data row, data column, or data cell requires that you populate the Hierarchy Structure business object filter. If a field does not have a hierarchical structure, it is not available.
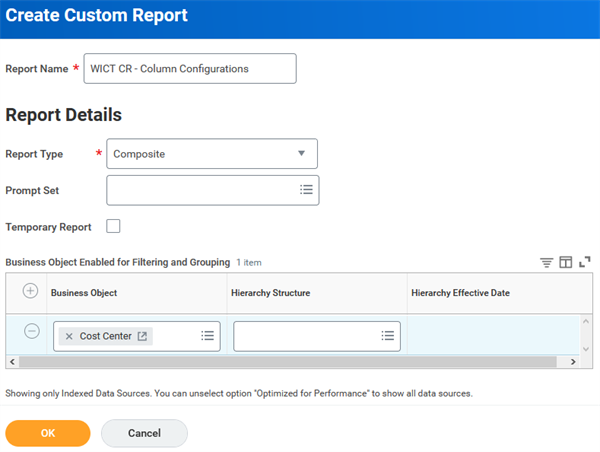
Create Custom Report - WICT CR - Column Configuration
Column and Row Calculations
There are seven Workday-delivered column and row calculation types.
Note
: The explanations below reflect calculation types for rows. However, you can apply the same explanations to the column calculation types.
With column calculations, you can also define a Drill Down Layout Override, allowing you to create composite calculation drill-down definitions. This is not possible with row calculations.Calculation Type | Explanation | Formula |
|---|---|---|
Difference | Compute the difference between two rows by identifying the rows. Column example: Use this to display the difference between actuals and budget. | A - B |
Divide | Divide a row by another row or constant. You select the rows. For 'B', you can also return zero if there is an error in the formula. Row example: Use this to calculate the gross profit margin by dividing gross profit by revenue. For a column calculation that uses the divide option, you can also divide by a cell value to create a percent of the total calculation. | A / B |
Multiply | Multiply two rows. You select the rows. For 'B,' you can also select a numeric constant. Column example: Use this to calculate the next year budget for expense by multiplying the actual expense by the estimated increase. | A * B |
Percent Increase | Compute the percentage of increase. Use primarily when comparing data from the same underlying data source. You select the rows and you can return a zero if there is an error. Column Example: Use this to calculate an increase or change between current period data and prior period data. | (B - A) / A |
Percent Remaining | Compute the percentage remaining. Use primarily when comparing data from different data sources. You select the rows and you can return a zero if there is an error in the formula. Column Example: Use this to calculate how much of the budget is remaining when compared to the actuals. | (B - A) / B |
Sum | Use to Sum data from a set of rows that are not necessarily contiguous. Row example: Use this to calculate various total rows for an overall total if the rows are not contiguous. | A + C |
Sum Range | Sum a range of contiguous rows. | A:D |
Row Types
There are five Workday-delivered row types:
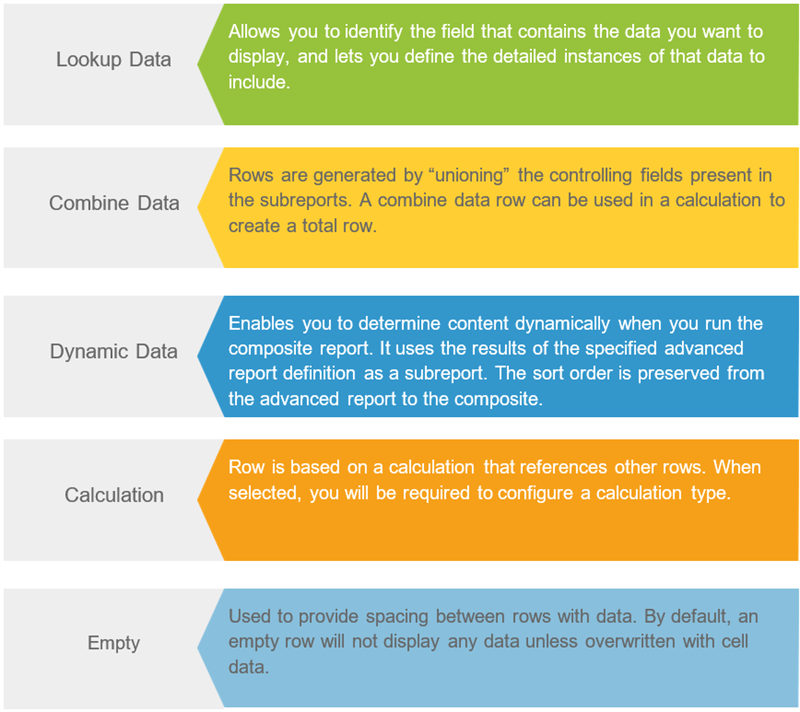
Here are some examples of how you can use each row type:
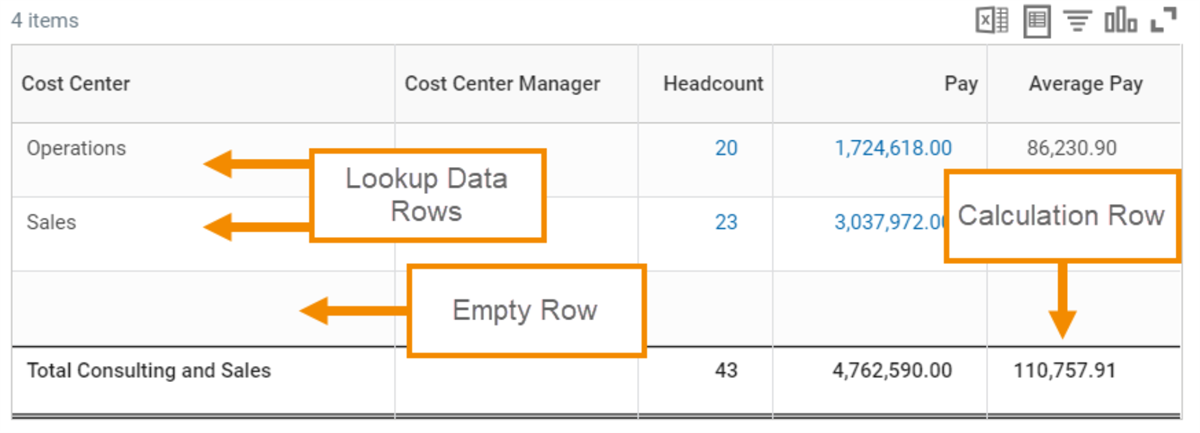
- Lookup Data: This allows you to specify what data to include in the row. For example, if you need a row that reflects revenue, you can define a lookup data row to pull all data that reflects revenue, such as all ledger accounts that roll up into revenue.
- Combine Data: This acts as a bucket where you can put all of your data in a row. It calculates automatically based on the Control Field column or columns specified in your report. You can use this for sorting and totaling. For example, if you want to include a row at the bottom that says "Total," you can add a Combine Data row that will include all necessary information in that row.
- Dynamic Data: You can determine content dynamically when you run the composite report. This row type uses the results of a specified advanced report definition as a subreport. You can also apply an aggregate calculation to the dynamic data row results. For example, you can look up specified values for every cost center that meets criteria you define and sum all cost center values returned by the dynamic data row. Any sorts you define in the advanced report will carry over to the rows in the composite.
- Calculation: This is similar to the Calculation column type, including the types of calculations that the system can perform. For example, you might sum revenue and expense to calculate net income.
- Empty Row: This is similar to the Empty Column functionality; it generates an empty row to separate out sections of data. You can also use this type to enter a text label into a specific cell. We explore this in more detail later in the course.
Outlining
Outlining is a configuration for composite report hierarchies that you use in Workday and when exporting to Excel. You can define hierarchies using an outline structure. Outline structures consist of one or more hierarchies and enable you to 'nest' hierarchies or group by fields. Nesting allows you to drill down to lower hierarchies that may consist of ledger accounts or categories.
Building an Outline Structure
The outline structure consists of the Primary Hierarchy definition and the Expansion Hierarchies grid. You can identify each outline structure by a required title and optional description. You can use the outline structure in any composite report.
Primary Hierarchy
You can select any business object to be the primary hierarchy, i.e., the highest level. Once you select it, the remaining fields within the primary hierarchy populate, but you can override them. You must populate all fields except for the Node Value Display Field Override and the Detail Value Display Field Override.
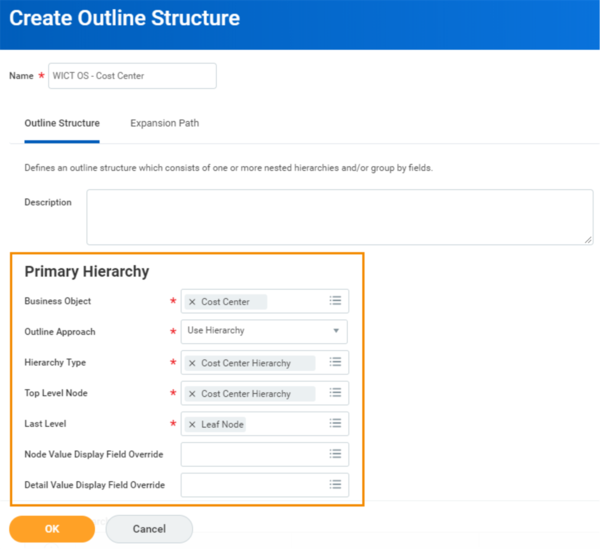
Example of an outline structure based on the cost center hierarchy
Field | Information |
|---|---|
Business Object | This can include any business object. |
Outline Approach | Specify whether the outline level or levels defined are based on one or more levels in a hierarchy or based on a field's value. The approach consists of Use Field Value or Use Hierarchy. |
Hierarchy Type | Select the hierarchy type from the list. Only the hierarchy types for the selected business object are available to select. |
Top Level Node | Select configured hierarchies here. |
Last Level | Configure 10 node levels here, or select the leaf node. A leaf node is the last level of the hierarchy; it has no child nodes associated with it. |
Node Value Display Field Override | Any valid text, single instance, or self-referencing field associated with the class of the top-level node for the hierarchy. |
Detail Value Display Field Override | The report field on the report. Any valid text, single instance, or self-referencing field associated with the business object is valid. |
Note
: You can also use an outline structure when configuring a repeating column group. This allows you to expand the outline for the repeated levels in a hierarchy. Column outlining is only for the primary hierarchy.Also, when you view an outline structure, you can view the usages for it.
Outline Structure within a Composite Report
You can use outline structures in various areas of the composite report.
For control field columns, define the outline structure in the Outline Data section. The Default Outline Data checkbox defaults the outline structure on your row configurations.
By default, the hierarchy structure will not initially expand. However, you can set the Expand on Initial Display option to once or twice to determine the level to which you would like the structure to initially expand.
Include a Hierarchy Effective Date, if you need a date other than today's date.
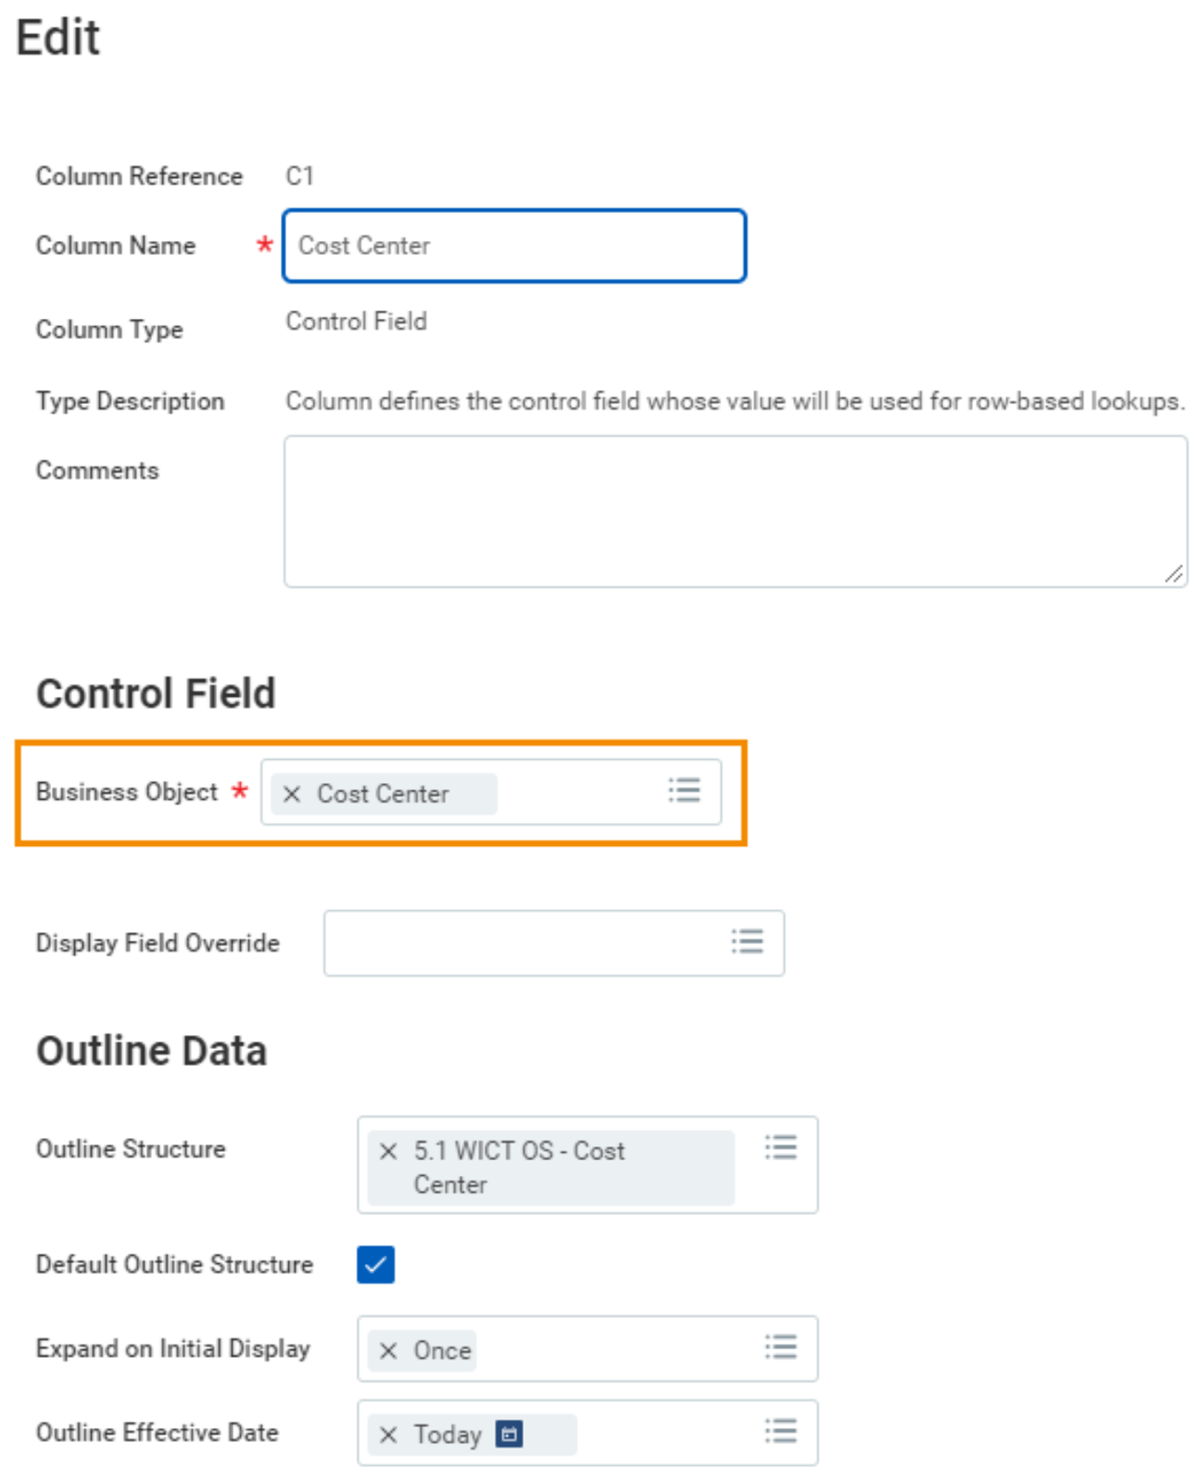
Example of an edit column screen in which you can select the default outline structure
To filter a row based on the outline structure, reference the outline structure in the "Business Object Enabled for Filter and Grouping" section when you create the report. For an existing report, you need to edit this information in the report settings.
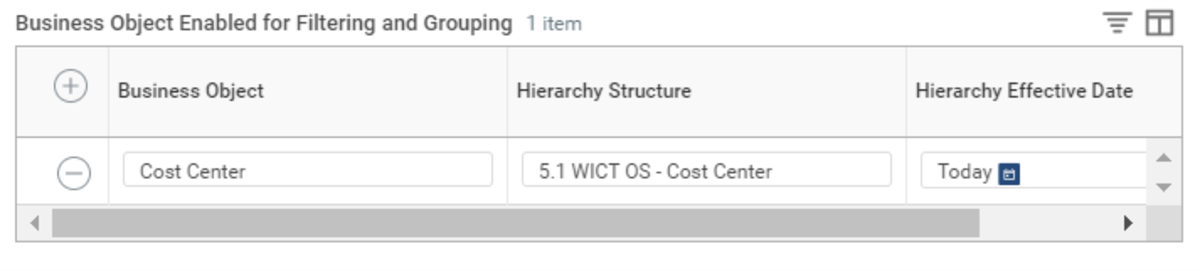
Example of a business object enabled for filtering and grouping.
Within a row, define the outline structure within the Outline Options section. If you select the Default Outline Structure checkbox, the structure will default in. Use the Expansion Level option to specify the primary hierarchy level that displays when you initially expand an outline. Select the "Include Nodes with No Data" checkbox if nodes should display even when there is no data.
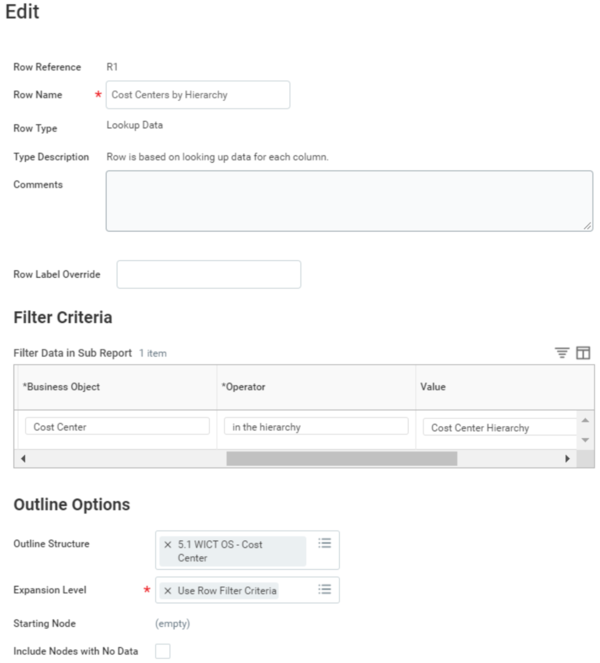
Example of a row edit screen in which you can select the outline structure, expansion level, and whether to include nodes with no data
Repeating Column Groups
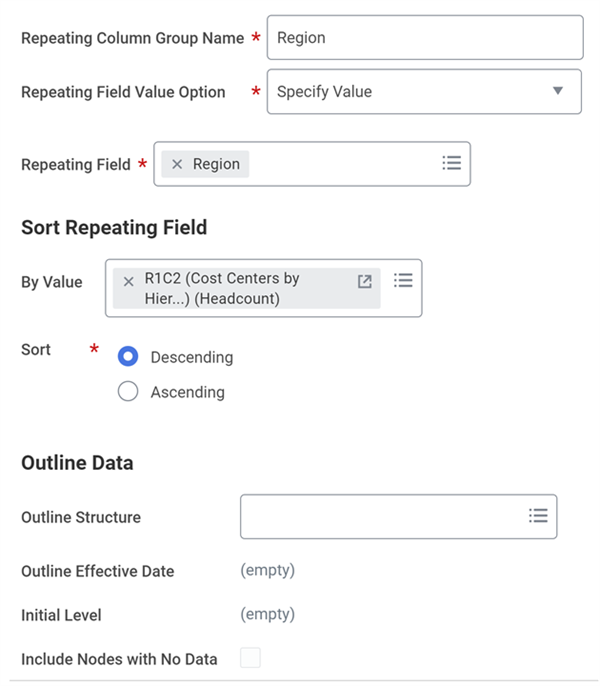
A repeating column group defines a column, or series of columns that repeat within the composite report based on a set of values (e.g., a set of regions). You can define a series of columns for a repeating column group, if they are contiguous (i.e., next to each other with no intervening columns not part of the group).
Data, calculation, lookup field value, and empty column types can all be a part of a repeating column group. Control Field columns cannot be part of a repeating column group.
You can specify the field you want to repeat, or prompt for the repeating value at runtime. This allows for a more reusable report.
You can also set up sorting options to sort by a value in the report in either ascending or descending order. If you do not set up a sorting option, the repeating value sorts by the repeating field in alphabetical ascending order.
At a high level the process of creating a new repeating column group is:
- Select the pull-down for the column you want to include in the repeating column group. Select the Repeating Column Group action.
- Identify a name for the group. This does not appear on the report. This name allows you to pick the appropriate group for other columns.
- Identify what the Repeating Field is. Which field do you want to repeat? Cost Center? Region? Or you can prompt for the repeating field at runtime.
- Optionally, set up Sorting Options.
- Optionally, set up Outline Data.
- Select OK.
- For any other columns that you want to include in this group, edit the column, and select the Repeating Column Group name from step 3.
Note
: When creating a Repeating Column Group, the field must exist in a subreport. Also, when combining two columns with two different data sources, the field must exist on both subreports.However, you do not need to reference the repeating field as a business object in the report settings of the composite report. Reference the field as a row or column grouping in the subreports.
Styles and Formatting
You can create formatting styles or use styles provided by Workday to gain more control over the look of the cells, columns, and rows in your composite report. You can apply formatting to composite reports you export to Excel or view in your browser. You can add items such as currency symbols, colors for negative numbers, shading, double underlines, and more. In addition to formatting styles, you can:
- Control other display options in the report, such as hiding columns or rows. Include blank columns or rows.
- Override the style and visibility of a column, row, or cell, including calculation, data, or empty cells.
- Use analytic indicators.
When using formatting styles, you cannot:
- Apply numerical formatting because Workday treats numerical characters in the control field column as text.
- Create report-specific styles.
- View conditional formatting or all formatting styles on mobile devices.
Column Style and Options
Each column allows you to customize the style and options for that particular column. We cover styles throughout the course.
The Options field varies depending on your column selections. The most common selectable option here is Hide Column. The data for the column still exists, and you can still perform calculations on it, but it is not visible when the report runs.
Row Style and Options
The row style and option selections are like those of the column. Style options allow you to apply formatting to the displayed report data. Row options exist to customize how rows display. You can hide rows from the report output, reverse the sign on a row, and format the row text.
Example
: For the look and clarity of certain reports you may want to highlight total rows or add rows for formatting.Headers and Footers
Headers
There are a few options available to include header information in your report.
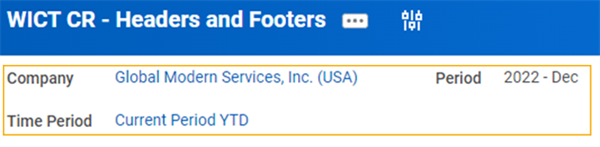
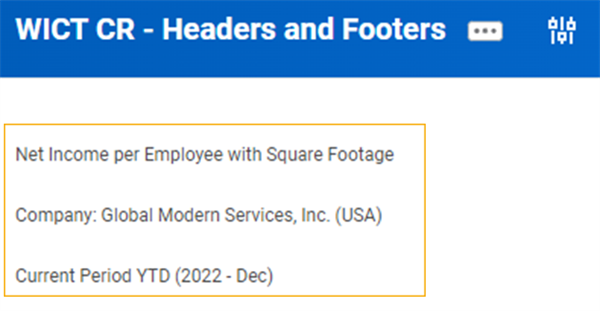
- Display the prompt selections at the top of your report. This requires no additional configuration if you set up the report to display prompts. This option lists the fields and values that you select before running the report.
- Display custom header information at the top of your report. This allows you to customize the wording that displays in the header and uses variables to populate values into that header.
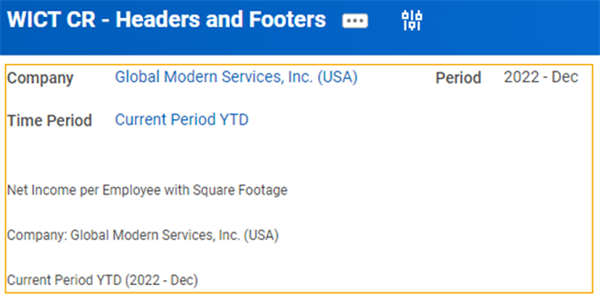
- Display both prompt selections and custom header information. This allows you to display both the report prompt information, as well as any custom header information.
Footers
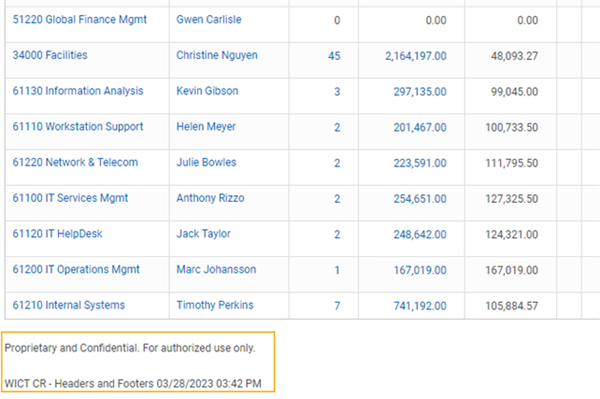
You can only configure footers through the Report Settings window. They are displayed at the bottom of your report.
Custom Variables for Headers and Footers
You can configure headers and footers to display defined text, a variable (e.g. report date), report time, report name, or a variable that comes from the report prompts. You can also include a combination of text and variables such as "For Company: [V1]". You can then configure V1 as the company that populates from the report prompt at run time.
Using Calculated Fields for Custom Variables
You can also create calculated fields for use as variables in report headers and footers. For example, you can create a Text Constant calculated field that returns "Proprietary and confidential. For authorized use only." This calculated field is then reusable in many different reports as a header or footer, thus standardizing language and simplifying report configuration.
As another example, you can create an Extract Multi-Instance calculated field that returns the supervisory organizations managed by the current user. Then, you can create a data column field variable that uses the result of the Extract Multi-Instance field at run time. When you configure the Data Column Field Variable, you must refer to a column because the supervisory manager evaluation has to execute from one of the subreports via the data column.
Configuring Headers and Footers
Defining Text and Variables
Defining a text-only line in the header or footer section is easy. Enter the text into the Text Expression field as you want it to appear on the report.
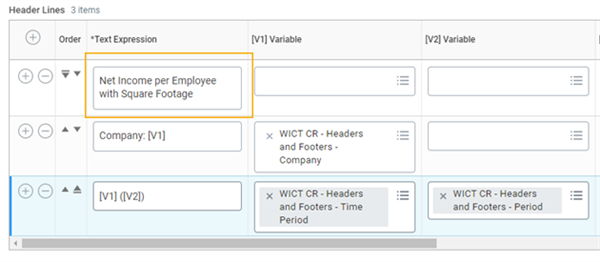
Header and footer text expression
Custom Variables
You can define up to four different variables in a single header row. You can add several different report variables:
- Report Time
- Report Date Time
- Report Name
Additionally, you can also use any of the promptable values within the Report Settings or create your own data column field variable. If you create a data column field variable, you can access global variables like Current User for inclusion in your headers and footers.
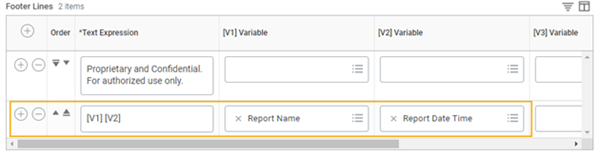
To define variables, add the variable prompt in the Text Expression box and identify the specific variable to use in the variable field. For example, for the report name to appear in the header, add [V1] into the Text Expression field, and the Report Name variable into the [V1] Variable field.
Note
: The variables in the Text Expression box are case-sensitive. Make sure to enter [V1] and not [v1].Combining Text and Variables
You can also display a combination of customized text and specific variables in a header or footer row. For example, to add the text "Company:" before the Company variable, your Text Expression would match the image below. The [V1] variable populates with your Company report prompt.
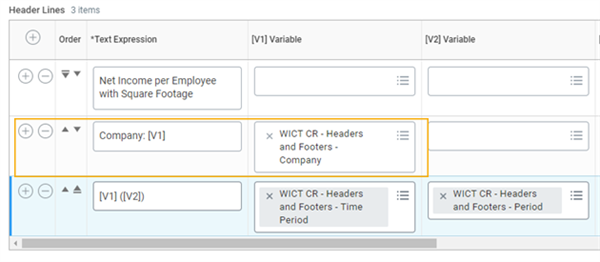
Headers, Footers, and Report Prompts
By default, your prompt selections appear on a system-generated report, which may include additional header and footer configurations and can feel repetitive.
To prevent the prompts from appearing on your report, use the Prompts tab. To suppress all prompts from appearing, select Edit Prompt Settings and clear the Display Prompt Values in Subtitle checkbox. Alternatively, to suppress only specific prompts in the header, select the Do Not Include in Subtitle checkbox in the Prompt Defaults grid for those individual prompts.
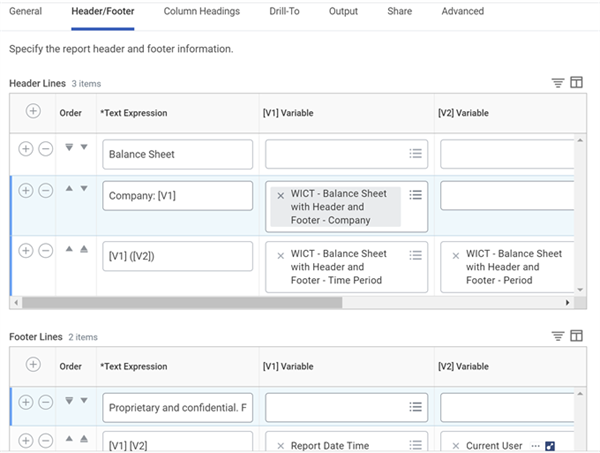
You can define headers and footers in a composite report as text, variables, or a combination of both. You can also specify the order in which you want the header and footer lines to appear.
Multiple Data Sources
Workday captures a variety of datasets, and maintains each in a unique report data source. For example, Trended Workers is a data source that stores snapshots of worker data over a period of time. You can use this data source to create trending reports.
Some reports require data from multiple data sources. Composite reporting allows you to build a single report pulling from multiple subreports with each reflecting a different data source. Here are some data sources that support reporting requirements:
- Trended Workers
- All Custom Reports
- All Standard Reports
The data sources contain all transactional fields and calculated fields needed to give composite reporting its dynamic reporting power.
Reminder: You can find more information on the report data sources listed above, including how you can use them as well as their primary filters, in the previous chapters.
Two Subreports with Common Object Building Composite Report
The first report we saw contains two subreports using two different data sources, All Standards Reports and All Custom Reports, and uses a common object/grouping. Using both of these sources, we create a total calculation that otherwise would not be possible.
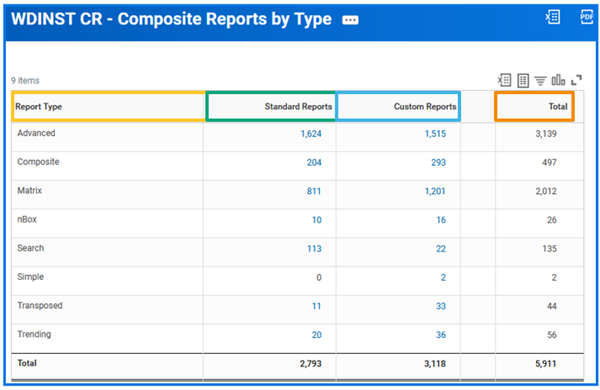
WDINST CR - Composite Reports by Type - Headers
Prompt Behavior and Prompt Sets
Prompt Behavior
Prompt configuration starts with the subreport. Here you establish which prompts do or do not display for the user, and if a value prepopulates in the field. Selecting the "Do Not Prompt at Runtime" checkbox for a prompt in your subreport makes it not configurable in your composite report.
When a composite report pulls in a subreport, you can modify the prompt values used at runtime. You can also change the prompt settings from running with the default values to prompting the user to input a value.
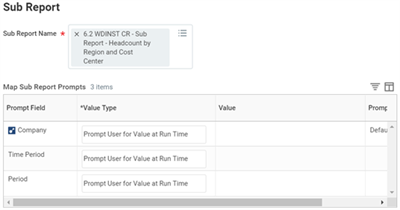
Example of modifying the prompt values in the composite report to allow user input
When you run a composite report that prompts a user at runtime, the system displays something like this:
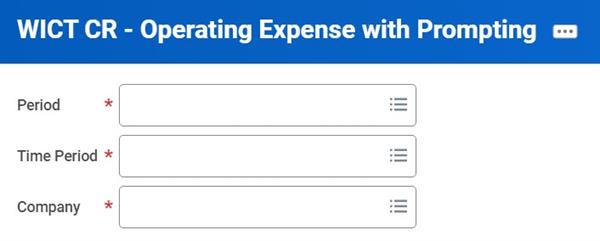
Operating Expense with Prompting
In a composite report, the values that you pull from the subreport into the Map Sub Reports Prompt field function differently. Let us explore those behaviors:
Setting in Subreport | Behavior in Subreport | Behavior in Composite Report |
|---|---|---|
"No default value" "Do Not Prompt at Runtime" | No prompt appears when the report runs. | No prompt appears in the report configuration. |
"No default value" Prompt at Runtime | Prompt appears with no value when the report runs. | Prompt appears in the report configuration and you must set it before you can save the column settings. |
"Specify default value" "Do Not Prompt at Runtime" | Prompt runs with a preset value when the report runs (no prompt appears). | Prompt does not appear in the report configuration (runs with default setting in subreport). |
"Specify default value" Prompt at Runtime | Prompt appears with a preset value that you can modify when the report runs. | Prompt appears in the report configuration screen. If you do not make a change, no prompt appears when the composite report runs (uses the default value specified in the configuration). |
When you modify a prompt within the composite report to "Prompt User for Value at Runtime," notice that you cannot set a default value. The prompt configuration settings for a composite report are elsewhere.
To access the prompt settings for the composite report:
- Edit the custom report.
- Select the Prompts tab. The fields you mark as "Prompt User for Value at Runtime" in your Column configuration appear here.
- From here, you can add the default values, toggle on the Do Not Prompt at Runtime flag, choose for the prompt field not to appear in the report results, and more.
If the prompts do not display, remember to select the Populate Undefined Prompt Defaults checkbox.
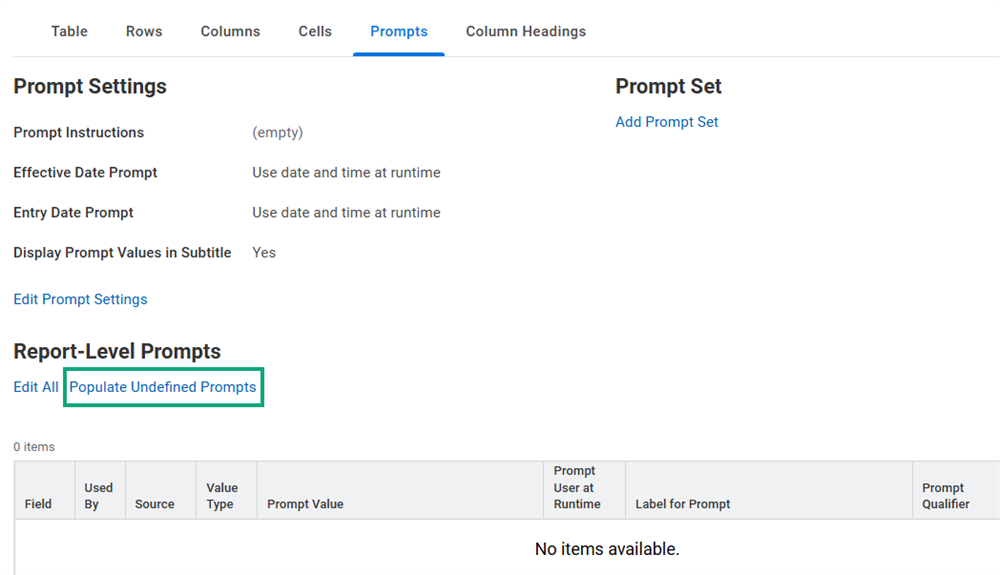
Example of the Prompts tab within a composite report.
Note
: You cannot delete subreport prompts within the composite report. However, you can set prompts to Prompt User for Value at Runtime in the column configuration screen. You can then set the prompt in the Report Settings screen to No Default Value, and Do Not Prompt at Runtime. This allows you to use the same subreport in multiple composite reports.Prompt Sets
A prompt set is a group of commonly used prompt fields that have interdependencies. Prompt sets define the order, restrict the field by making the prompt required, and provide a default label override and default value.
Prompt sets are beneficial when you have a composite report that pulls from more than one data source. Without prompt sets, duplicate prompts might display when the report runs.
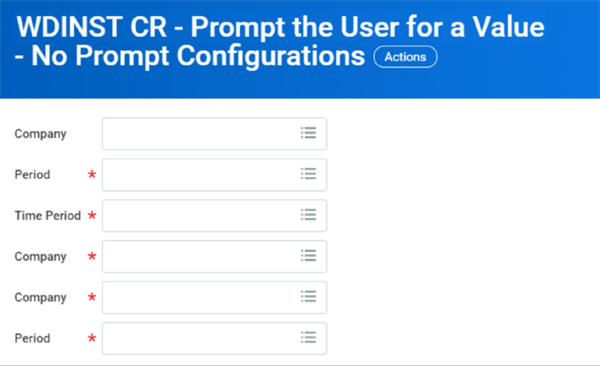
Prompt the User for a Value - No Prompt Configurations
You can select prompt sets on the Prompts tab within the Report Settings. There are several Workday-delivered prompt sets. With the right security, you can create your own prompt sets.
Note
: To configure columns to use prompt sets, first identify which prompt set to use in your Report Settings window. Otherwise, you cannot use a prompt set for a field at the column level.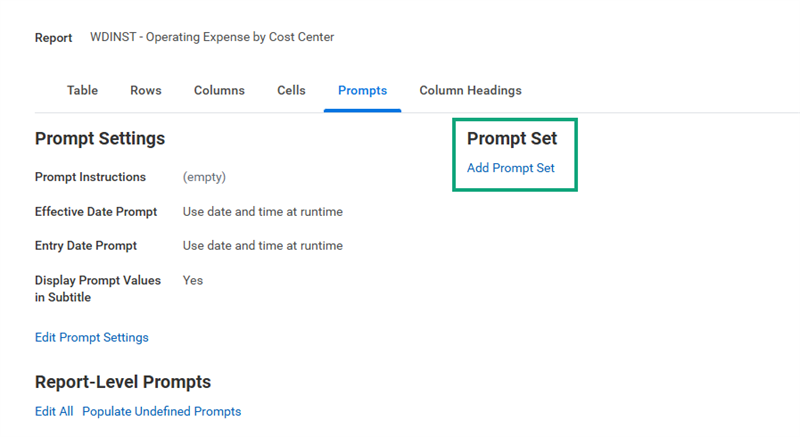
Example of prompt set configuration on the Prompts tab.
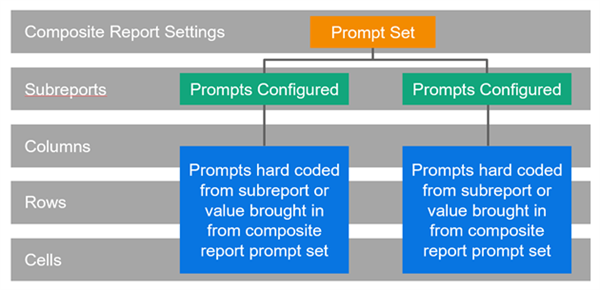
Composite Report Settings Prompt Configuration
- Execute Report: Prompts page displays; prompts from here overwrite the default values from the prompt set.
- Subreport Gets Built: The subreport executes for each data configuration. You set each data configuration to either use the prompt set for the value or use a specified value.
- The Composite Report Output Is Built: The criteria for the report come from the values in the data configurations of the composite report (either prompt set or specific value). The subreport ignores the prompt values if they are left promptable. If the prompt values in the subreport are not promptable, the report uses any populated values.
Reminder
: The hierarchy of composite reports is:- Report Settings
- Column Configuration
- Row Configuration
- Cell Configuration
Chapter Summary
- Composite reports allow you to pull contents of multiple subreports into a single report. Those subreports can each have different data sources.
- Subreports use common control fields to unify them in the composite report.
- Composite reports have configurable rows and columns that determine what data displays.
- Define outline structures to use them in any composite report.
- You can use repeating column groups to repeat one or more columns based on a set of values.
- You can apply styles and formatting at the column, row, or report levels.
- You can add headers and footers as text, variables, or a combination of both.
- You can configure prompts to determine their behavior at runtime, and prompt sets group prompts that can be shared across multiple subreports for ease of use.