
Composite Reporting: Advanced Concepts
Overview
Now that we've covered basic composite reporting functionality, we'll explore additional concepts and use cases relating to composite reports. Then, we'll put all the concepts together in a composite reporting workshop.
Objectives
By the end of this chapter, you will be able to:
- Configure a Dynamic Data row.
- Choose the appropriate cell type for certain cells and configure the cells accordingly.
- Configure complex column headings with multiple rows and variables.
- Configure the Expansion Hierarchies grid to define the expansion path in report outlining.
Dynamic Data Rows
Dynamic Data Rows use advanced reports as subreports to populate the control field column. The advanced report sorts the data based on the business object instead of referring to the columns in the output. The report dynamically determines content when you run the composite report. The advanced report filters the data, and, if needed, you can further filter it in the row configuration. You can also apply an aggregate calculation to the dynamic data row results.
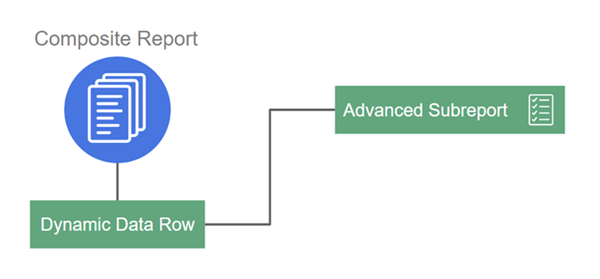
Dynamic Data Row Relationship
Example:
You can look up specified account values for every account that meets the criteria you define and sum all the account values returned by the dynamic data row. Any sorting defined in the advanced report carries over to the rows in the composite report. Additional Uses for Dynamic Data Rows
You can use dynamic data rows to:
- Create a summary without drill downs.
- Display specific levels of hierarchy.
- Create custom totals, hiding control field details.
Some report users may not want to display the entire outline structure or all the details. You can use dynamic data rows to present data more effectively. For instance, you can use dynamic data rows to display only summed rows for an entire hierarchy, or for particular groupings of cost centers defined in the report.
In our example, we notice how setting up a dynamic data row allows us new ways to present composite report data. We can set up our own rows that reference the advanced subreport to filter just the data we specify. In this case, Teresa only wants to display the sum totals of her own groupings of cost centers.
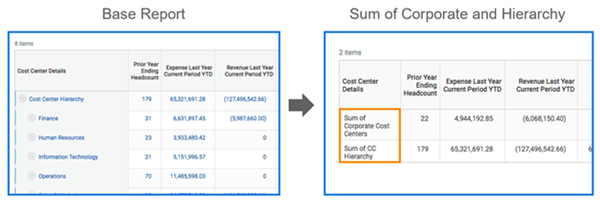
Dynamic Data Row Summary without Drill Downs
Cells
Composite report data consists of columns, rows, and cells. Cells provide an additional way for you to pull in data from another data source. A cell is the intersection of a column and row. You can create a cell that can contain a calculation, data, label, or a conditional override.
Note
: You cannot delete columns or rows that have cells if the cell dependencies are more than three levels deep. Cells must also have limitations on column headers, drill down layout row overrides, and chart options.Data Cells
Data cells enable you to retrieve data from your subreport. The subreport in the cell override can be any matrix or trending report defined in Workday. You can configure data cells at the intersection of a:
- Calculation column and calculation row.
- Calculation column and empty row.
- Data column and calculation row.
- Data column and empty row.
When configuring data cells, you can:
- Apply additional filter data for subreports.
- Map subreport prompts.
Note
: You can only limit subreports by control fields in data columns and rows. Cell data stands alone from control fields.Calculation Cells
Calculation cells derive from values calculated from other cells within the composite report. The calculation type determines the result, and is one of six types:
- Difference
- Divide
- Multiply
- Percent Increase
- Percent Remaining
- Sum
You can use calculation cells with outlining.
Label Cells
Label cells enable you to set up labels, such as Total Number of Employees, at the intersection of a control column and empty row. You can create labels that are static text where the label does not change, or dynamic text where you define variables. When using variables, Workday replaces the variables in the text expressions with the values of the variables when the report runs.
Example
: Workday replaces [V1] with the date in the text expression Last updated on [V1]
.Conditional Value and Format Cells
Conditional Value cells enable you to override the value of an undefined cell at the intersection of a lookup data row and data column. You can set up the cell to display zero or the actual value based on whether the condition is true or false. Conditional Format cells enable you to override the style and visibility of an undefined cell.
Column Headers
When you define configurable columns, the column name is what appears on the report. With column headings, you can customize columns with variables to give more meaning to the data, e.g., Headcount as of 2022 - Dec instead of just Headcount.
You can configure the column headings from the Report Settings window. Navigate to the Column Headings tab to find two options: Column Heading Rows and Column Heading Cells.
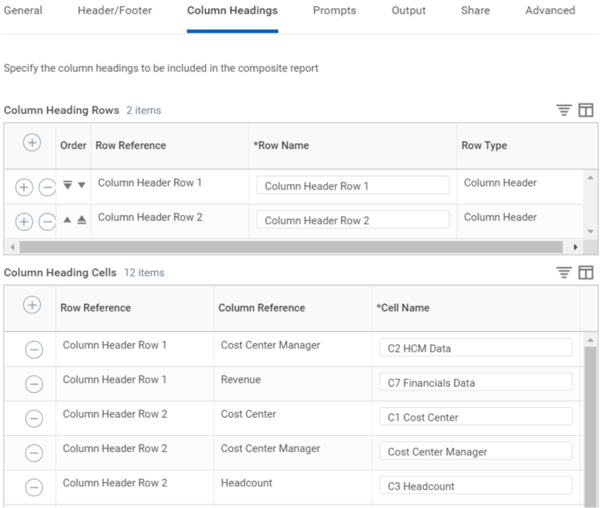
Example of column headings that have been configured
Column Header Style
Any styles you apply to the column headings apply to the column heading rows. You can also define a different style for the individual column heading cells. By default, when outlining, the column headings are not centered. To center the column headings over the column, apply the Workday-delivered Column Headings style.
In the Column Headings tab, select Define Default Style to apply styles to your column headers.
Automatically Generate Column Heading Information
You can also automatically generate column heading information based on the labels in the report. To do this:
- Go to Report Settings > Column Headings.
- Select the Generate Column Headings checkbox at the bottom of the Column Headings configuration screen.
- Select OK to save the new column heading.
- Now, you can edit the column headers in the Report Settings or the Column Headings tab.
Column Header Rows
Define column header rows by entering the Row Reference and Row Name. If multiple column heading rows exist, you can order them. You might do this to create a multilayered header. For example, the first row could say HCM and Financials, and the second header row could have variable dates for each.
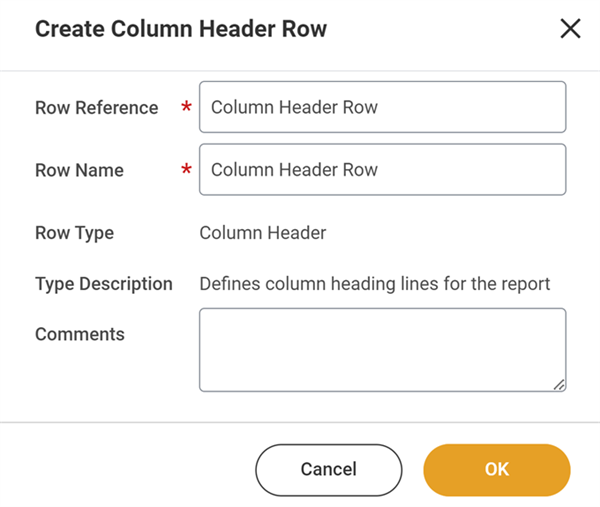
Column Header Cells
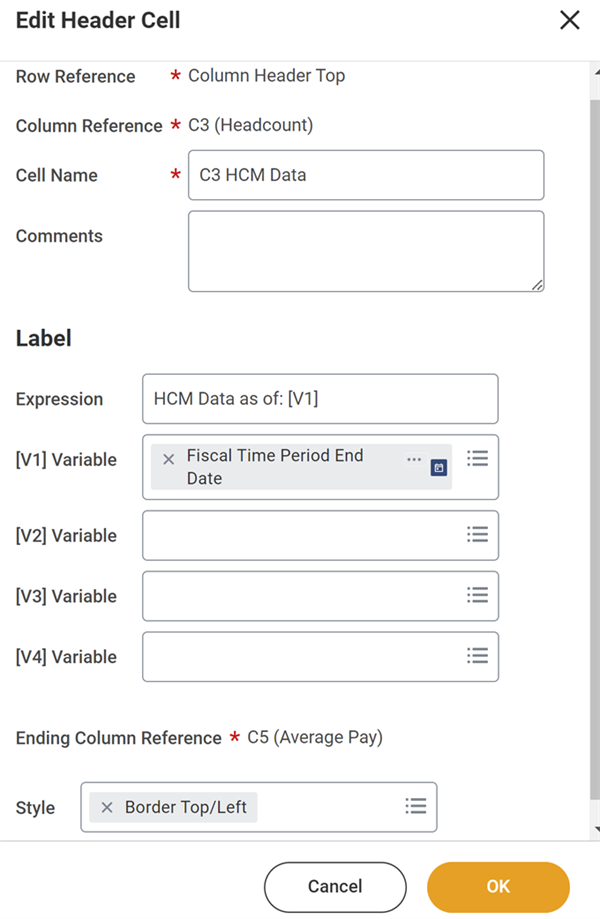
Define column header cells by populating the Row Reference, Column Reference, and Cell Name fields, as well as other variables you want on the report. In the Label section, you can define variables to make the report more descriptive. Default variable fields include Column Name, Report Date, Report Date and Time, and Report Name. Report prompts depend on the report.
In some cases, the column header may group more than one successive column. Do this by selecting the Label Spans Multiple Columns checkbox. Or, if you are using the Column Headings tab, select the column cell in the table, hold shift and select through which column you would like the column header to span. The image below shows the Edit Column Header Cell configuration using the Column Headings tab.
You can use the Style field to apply a different style to a column header cell.
Complex Column Headers: Multiple Rows and Working with Variables
You can configure your own column headers on the Column Headings tab in your composite report settings and specify the column headings to include in your report.
If you are using a single row of headers, consider these options:
Option | Description |
|---|---|
Generate Column Headings | Select to add available column headings to the grid. |
Style | Select from Workday-delivered styles, custom styles, or create your own style to apply to all the headings in your report. |
To format individual rows:
- Hover over the cell name you want to format and select theSee in New Tabicon.
- From the View Column Header Cell's Related Actions menu, selectColumn Header Cell>Edit.
Multiple Header Rows
You can configure column headers for multiple levels of your composite report. For example, one column heading could span multiple columns and another level could have custom headers for each of the specific columns in that group. We can achieve this format in the composite report settings. This configuration follows a different set of steps using both the Column Heading Rows grid and the Column Heading Cells grid. By using variables, we can configure custom headers and still maintain a repeating column group header.
We start with how we want our final report to appear. We want three levels of headings: one for our repeating regions, the next groups our columns by Prior and Current, and on the last level, we have our existing composite column heading names. We also notice how we can customize these for better readability.
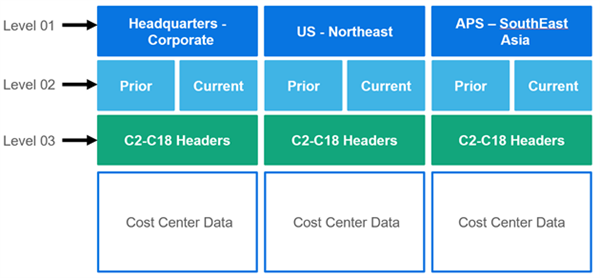
Complex Column Headers with Levels
The overall steps to working with multiple column headers are as follows:
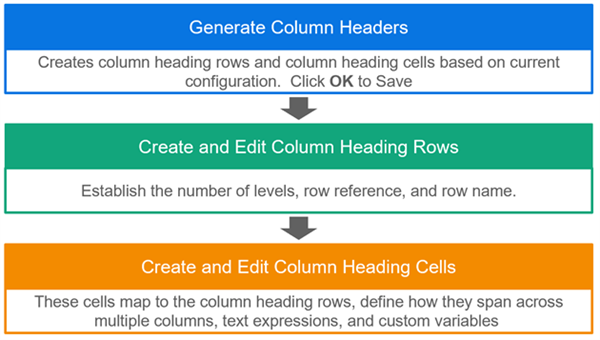
Steps to configure multiple column headers
Generate Column Headers
The first step is to generate our column headers. These populate based on our existing configuration. We can also modify this configuration to achieve an additional header level. When you generate the column headers, you can also apply a style to the entire configuration. For example, you might want to center the column headers.
Create and Edit Column Heading Rows
When we initially generate our column headers, the row references and row names are not easy to distinguish. To make them easier to follow, create one new Column Heading Row and edit the existing Heading Rows with Row Names and Row References easier to follow.
Create and Edit Column Heading Cells
The next step is to define our Heading Cells. In our example, we need to consider how to define all three levels. Notice how the system configures the Level 01 cell for Region and uses a variable to display these values in the output. Next, we define how Level 02 cells span across multiple columns. We define them as a combination of Text and Variable Data, i.e. "Prior YTD (12/31/2020)" and " Current YTD (12/31/2022)." When we configure these column header cells, we map them to a row and column reference, define the name of the cell and define the cell label. The cell label is a Text Expression that can consist of text, a variable, or a combination of text and variable data. Additionally, you specify where the span for the cell starts and ends. The start position for the Cell is the column reference. The end of the span is defined by selecting Label Span Multiple Columns and entering the Ending Column Reference.
After configuring Level 01 and Level 02, we edit the Level 03 Column Heading Cells to modify the text expressions on the report. By default, these map to the Column Heading Rows. These cells do not span, so we modify the text expression.
Individual cell styles can differ from the overall style of the column headers and you can apply those styles during cell configuration.
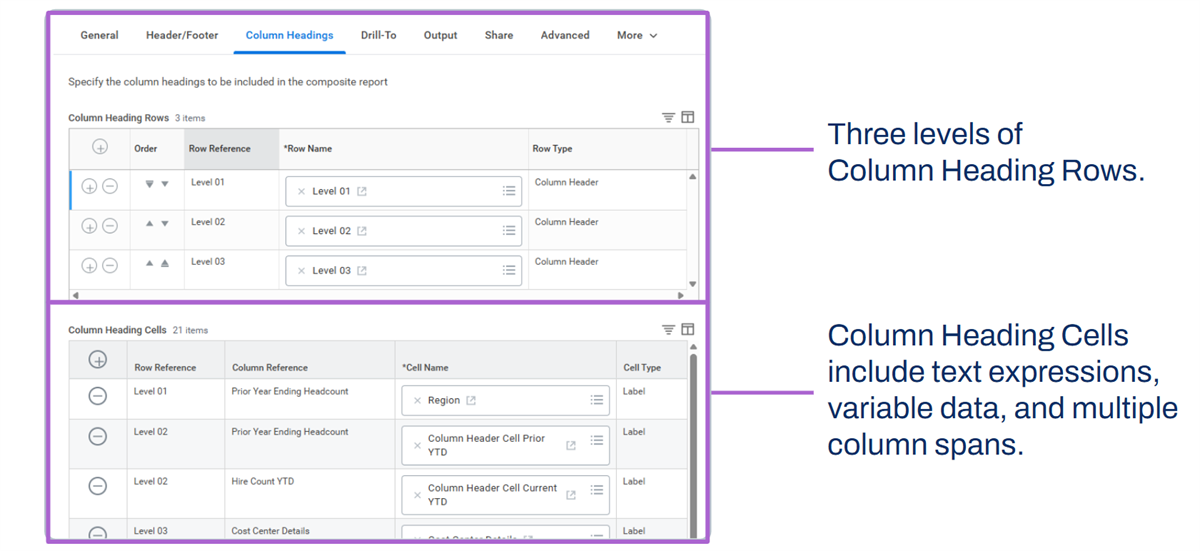
Column headings rows and cells
The image below is our final result. It includes three column heading row levels, with column heading cells that reference each of these levels:
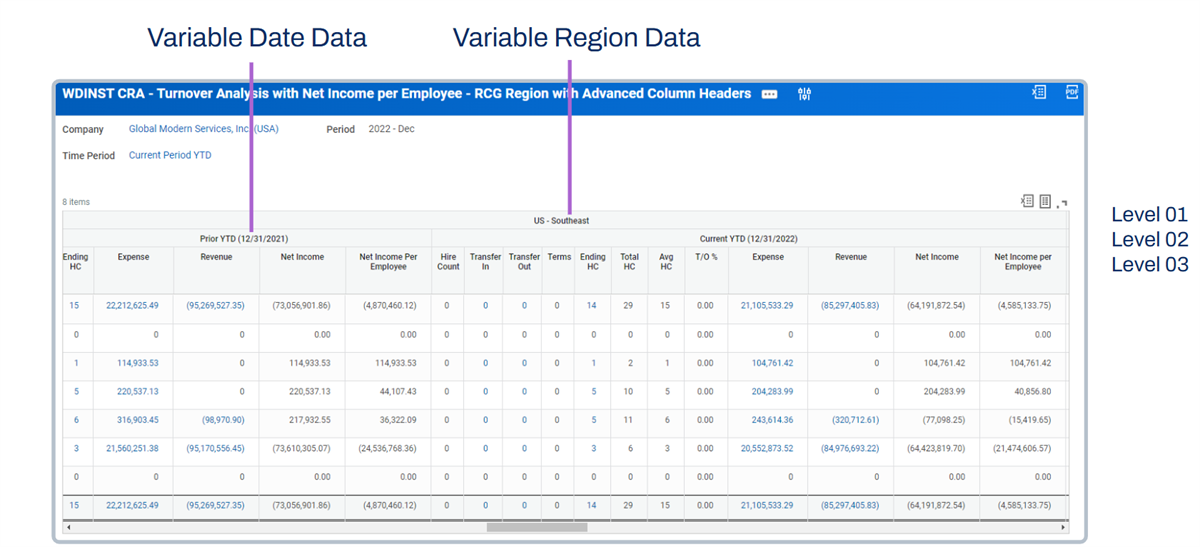
Column headings with repeating column group
Expansion Hierarchies
When working with outlining on a composite report, you have the option to set up hierarchies associated with the business object on the Expansion Hierarchies grid. Once you reach the desired level in the primary hierarchy, you can configure subsequent hierarchies to expand the hierarchy. This allows you to further customize the drilling experience in your report.
On the Expansion Path tab, configure the subsequent expansions to use once you reach the desired level on the primary hierarchy. As you complete the tab, consider:
Option | Description |
|---|---|
Business Object Enabled | Select the business object used in each subreport. |
Business Object Hierarchy | Select the business object that corresponds to the business object selection in the Expansion Hierarchies grid. |
Expansion Field | Select a field related to the business object. |
Note
: Expansion hierarchies do not export to Excel, unless you enable the advanced option to export to Excel (Report Settings > Advanced tab). With this option turned on, the report runs in the background to send the expansion to Excel. Expansions can only expand up to eight levels in the Excel outlining.Chapter Summary
Key takeaways:
- Dynamic Data Rows use advanced reports as subreports to populate the control field column. Use Dynamic Data Rows to create a summary without drill downs, display specific levels of a hierarchy, or create custom totals.
- You can configure column headings to be formatted and nested.
- You can configure cells to override column or row data.
- You can customize the drilling experience in your report output by configuring an expansion hierarchy.