
Using Multiple Data Sources and Cell Configuration
Overview
You understand the framework of building composite reports, how to build and include subreports into composite reports, and how to configure rows and columns.
Now, we discuss the features that add complexity to data, including multiple data sources and control fields, as well as display options to format the data. We also learn to change how data is displayed on the report by hiding columns and rows, and reversing the sign of the data in the report.
Objectives
By the end of this chapter, you will be able to:
- Create a composite report with multiple data sources.
- Hide columns and rows and reverse the sign of data.
- Configure cell values to incorporate data from a new source to:
- Include a label on a row.
- Perform a cell-level calculation.
- Configure drillable rows.
Multiple Data Sources
Workday captures a variety of datasets, and maintains each in a unique report data source (RDS). For example, the system creates most journals from operational transactions and contains journal lines. Workday stores these in a Journal Lines RDS. Plan structures maintain budgets and you can either manually enter or upload data via EIB. Workday stores this budget data in a Plan Lines RDS.
Some financial reports require data from multiple RDSs. Composite reporting allows you to build a single report pulling from multiple subreports. Each single data source has a separate subreport, and those subreports need to be grouped by a similar field. All the subreports used in a composite report must have a common object for the data to appear in the composite report.
The data sources contain all transactional fields and calculated fields needed to give composite reporting its dynamic reporting power.
Column and Row Display Options
Workday composite reports can show favorable and unfavorable report variances. To do this, you modify the display options within the composite report. For example, the option to display revenue as a negative or positive amount is available within the row configuration. This change can allow a row to display as favorable or unfavorable.
Reverse the Sign
When data is retrieved on a report, users may want to view that data displayed in a specific format. When reporting on revenue, which is a credit balance, it is standard for revenue to display on a report as a positive.
There are two ways to reverse the sign on a report. For rows, in the Options field select Reverse the Sign. This will apply the sign reversal to all cells within the row.
For columns, you can select Reverse the Sign for columns defined as a calculation type column. Column changes override any cells in a row with a Reverse the Sign option already applied. However, you can change this override by defining a row category and applying the reverse the sign functionality to rows associated with the row category.
Note
: The option to reverse the sign is only a formatting change; it does not affect the data. The calculation ignores whatever sign is on the number when the report runs.Display Favorable and Unfavorable Variances
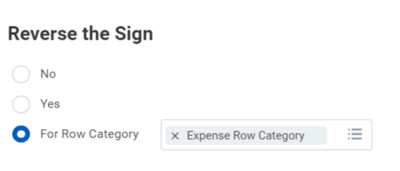
In addition to reversing the sign on a row to reflect a positive outcome, you can add column calculations to override the sign reversal on a row. To specify where to apply a column calculation and sign reversal, you need to create row categories to tell Workday how to format a given row.
Once you define a row category, you can specify in the column calculation that Reverse the Sign should be applied to rows in that category.
Cell Configuration
Report data consists of columns, rows, and cells. Cells provide an additional way for you to pull in data from another data source. A cell is the intersection of a column and row. You can create a cell that can contain a calculation, data, label, or a conditional override. The contents of the intersecting column and row types determine the actions available in each cell.
Cell Type | Definition |
|---|---|
Data |
|
Calculation |
|
Label |
|
Note
: You cannot delete columns or rows that have cells if the cell dependencies are more than three levels deep. Cells must also have limitations on column headers, drilldown layout row overrides, and chart options.Cell Types
Data
Data cell types derive from subreport data. The subreport in the cell override can be any matrix or trending report defined in Workday. The Edit Data window appears similar to that of a Column Edit Data window, and you can enter the same required and optional information. You can also duplicate data cells.
Note
: You can only limit subreports by control fields in data columns and rows. Cell data stands alone from control fields.Calculation
Calculation cells derive from values calculated from other cells within the composite report. The calculation type determines the result, and is one of six types:
|
|
You can use calculation cells with outlining.
Label
Labels define text items within your report, i.e. titles, headings, or other characters. You can define cell labels only for cells within a Control Field column, or within a Column Header row. You can create labels that are static text where the label does not change, or dynamic text where you define variables.
Example
: An example of a dynamic label is "Time Period 1/1/2022 to 1/31/2022." The variables are the start and end dates and render based on the time period selected in the report criteria.If a variable is a multi-instance field, meaning you can define many values in the field, then the values appear linked, sorted alphabetically, and separated by a comma. (Example: Boston, Chicago, and New York).
You can select variables from either report variables (such as Report Name or Report Date) or report prompts. We explore variables in a later chapter.
Cell Calculations
Calculation cells derive from values calculated from other cells within the composite report. The calculation type determines the result, and is one of six types:
- Difference
- Divide
- Multiply
- Percent Increase
- Percent Remaining
- Sum
Note
: Notice there is no cell calculation for sum range. In Workday, there is no concept of contiguous cells.Cell Data as a Drillable Total
Another common use of cells is creating a drillable total for a data column. To create a drillable total, you need to:
- Define an empty row.Important: Cell data must go into a defined row and defined column.
- Define a cell label in the control field column (e.g. Total).
- Define a cell data configuration in each data column where you want a total. Ensure that the cell data subreport has the same configurations as the column data subreport (e.g., filter criteria, prompt values).
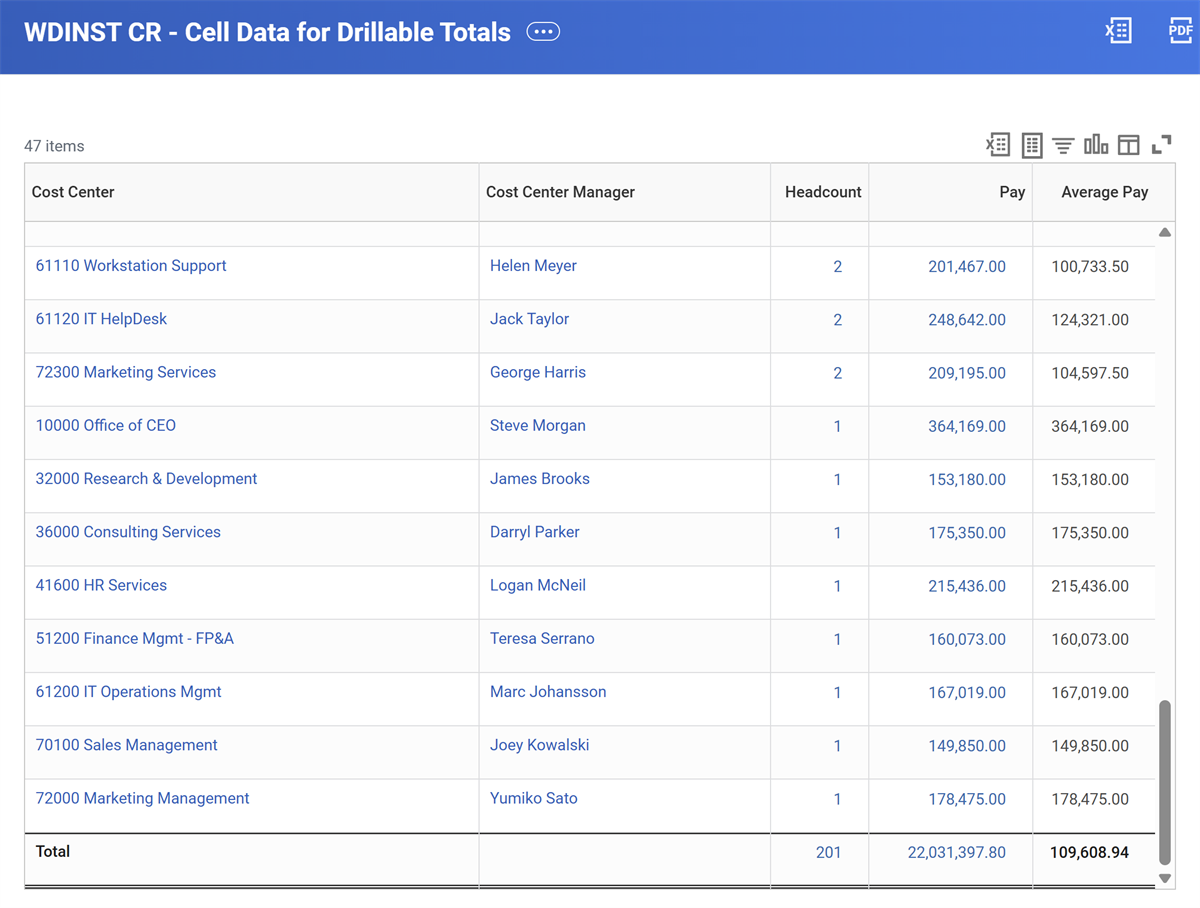
In the image below, this Cell Data for Drillable Totals report has an empty row labeled Total. Drillable cells were configured for the Headcount and Pay column cells that intersect with the empty row. The Average Pay column cell is configured as a calculation cell.
Chapter Summary
- You can pull multiple data sources into a single composite report using control fields.
- You can configure cells to override column or row data.
- You can pull cell data from a subreport using any data source.
- You can use cells to create drillable totals for a data column.