
Building a Basic Financial Statement Using Composite Reports
Overview
In this chapter, you will start building an income statement using the composite report type. You will configure columns and rows in your Income Statement. You will also style and format the report and explore the different calculation types. Lastly, you will learn how to use hierarchies to define an outline structure for a composite report.
Objectives
By the end of this chapter, you will be able to:
- Create configurable columns on a composite report.
- Build a financial statement with subreports.
- Apply styles and formatting to a composite report.
- Configure rows to a composite report and add row calculations.
- Add drillable totals to a composite report for outlining and filtering.
- Apply hierarchy and outline structure to a composite report.
Building a Composite Report
To create a composite report, you will use the
Create Custom Report
task. If you select the composite report type, you can no longer select a data source. Remember, this is because your matrix reports now function as your data sources. Instead, you have the option to select a prompt set.After selecting the composite report type, you will enable business objects to use for filtering and grouping data throughout your report in the report settings. These enabled business objects drive the available valid values for the control field.
The business object must match the dimensions, such as rows and columns, used in all the subreports compiled in the composite report. The business objects are required if you plan to filter in the lookup data rows.
Column Configuration
After creating the report, identify the correct type of columns to configure. There are five Workday-delivered column types:
- Control Field
- Data
- Lookup Field Value
- Calculation
- Empty
Once you identify the type of column, enter the information appropriate for the column type. Each column or row type requires different information.
Column Type Information | Image |
|---|---|
Column Type : Control FieldRequired Fields :
Additional Information :
* Use the Display Field Override to change the label of the business object. For example, instead of showing the label for the ledger account value, you could display the label of its account set. ** We will discuss outlining data in more detail in another chapter. Reminder : Use this column configuration to identify the "key" value for lookups. | 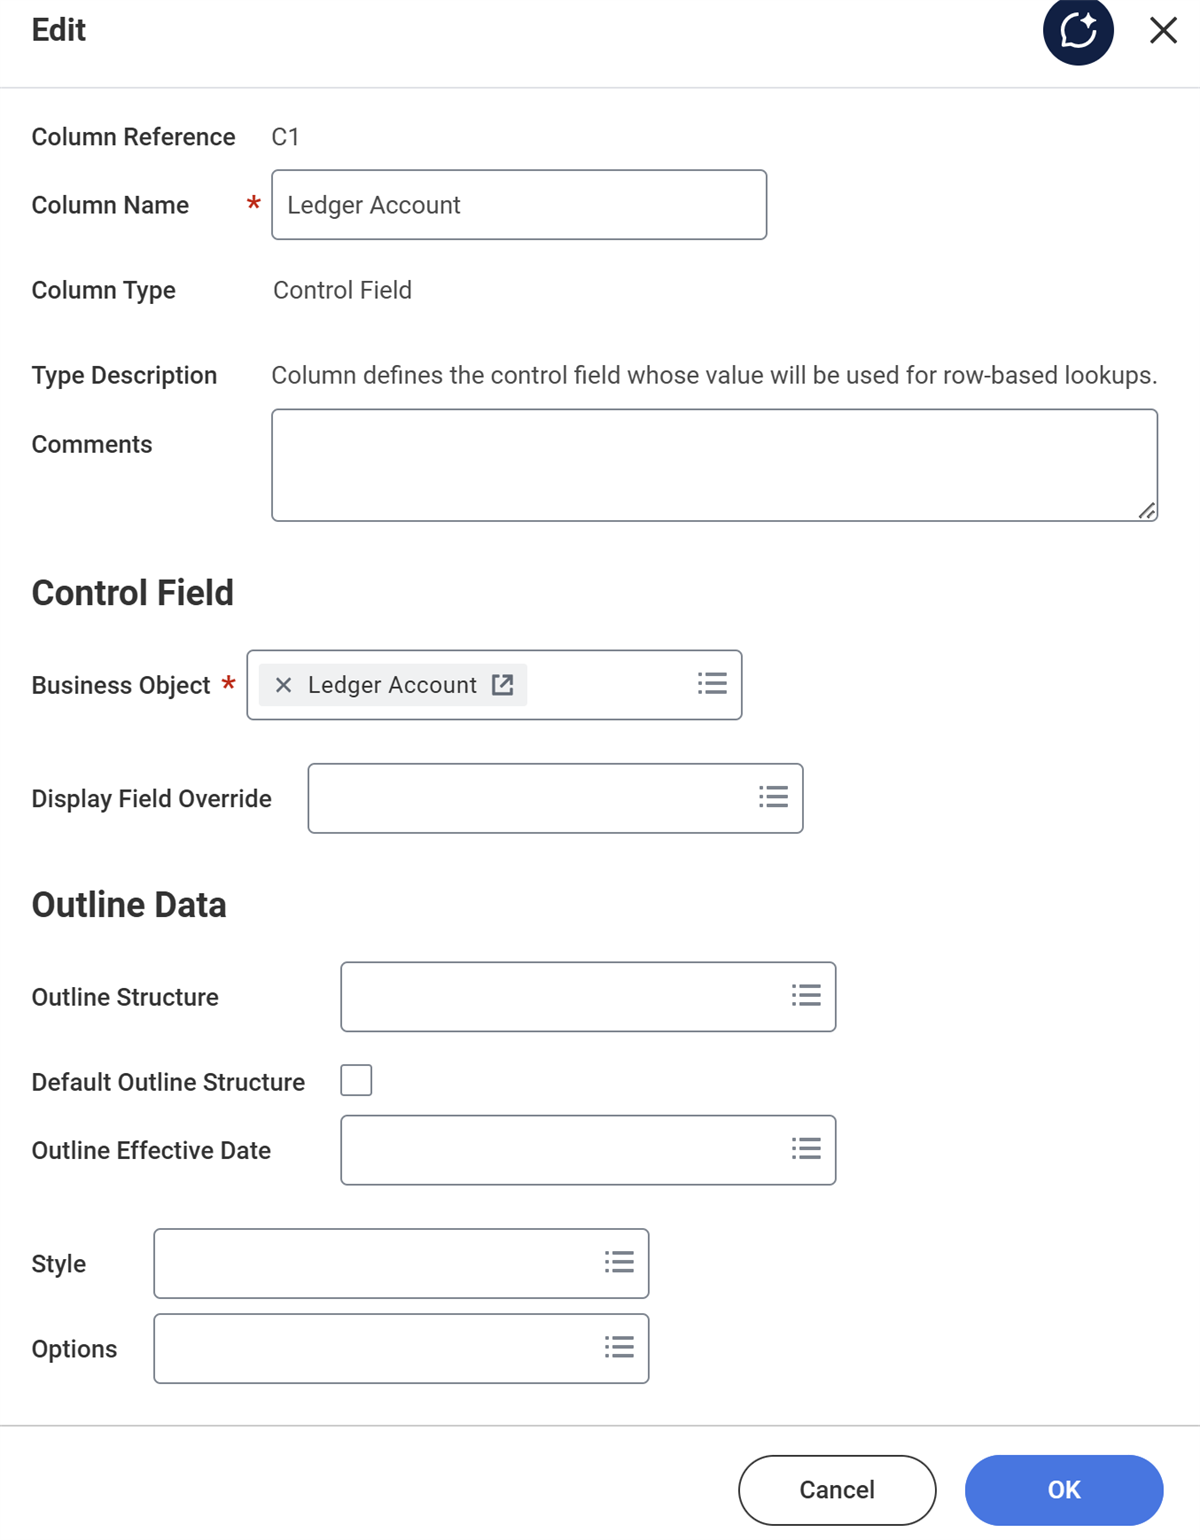
|
Column Type : DataRequired Fields :
Additional Information :
Note : Once you define the Sub Report Name, the subreport prompts (where you have selected "Specify default value" or "Determine default value at runtime") will automatically populate.Reminder : Use this to identify the subreport you want to pull data from. | 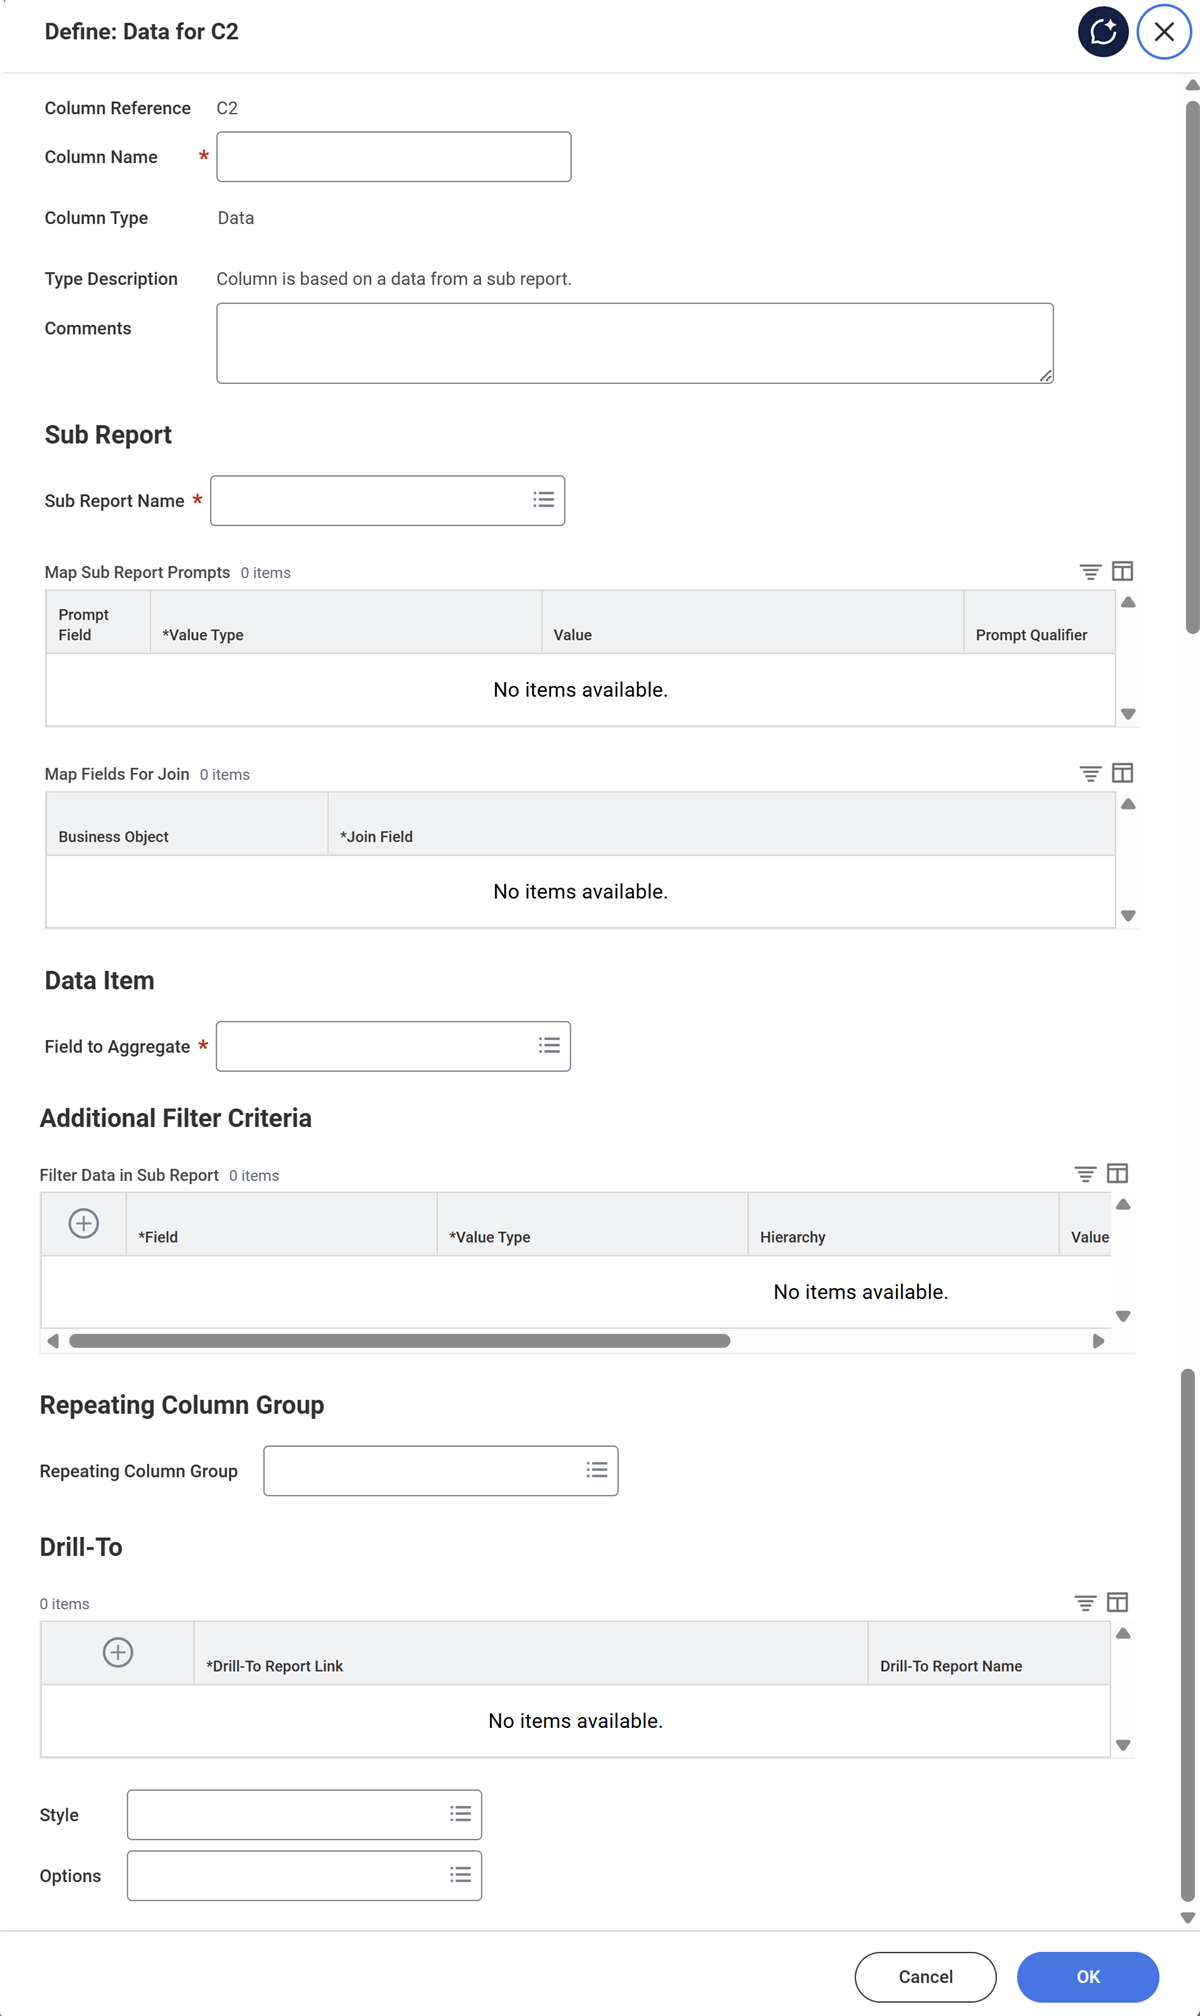
|
Column Type : Lookup Field ValueRequired Fields :
Additional Information :
Note : The Return Field is the field you want to include. It must be an attribute of the business object associated with the control field. Use numeric or currency lookup column types in other calculated columns, rows, or cells. The column returns empty values if the report row aggregates multiple instances together.Reminder : Use this to include fields associated with the Control Field in the composite report. | 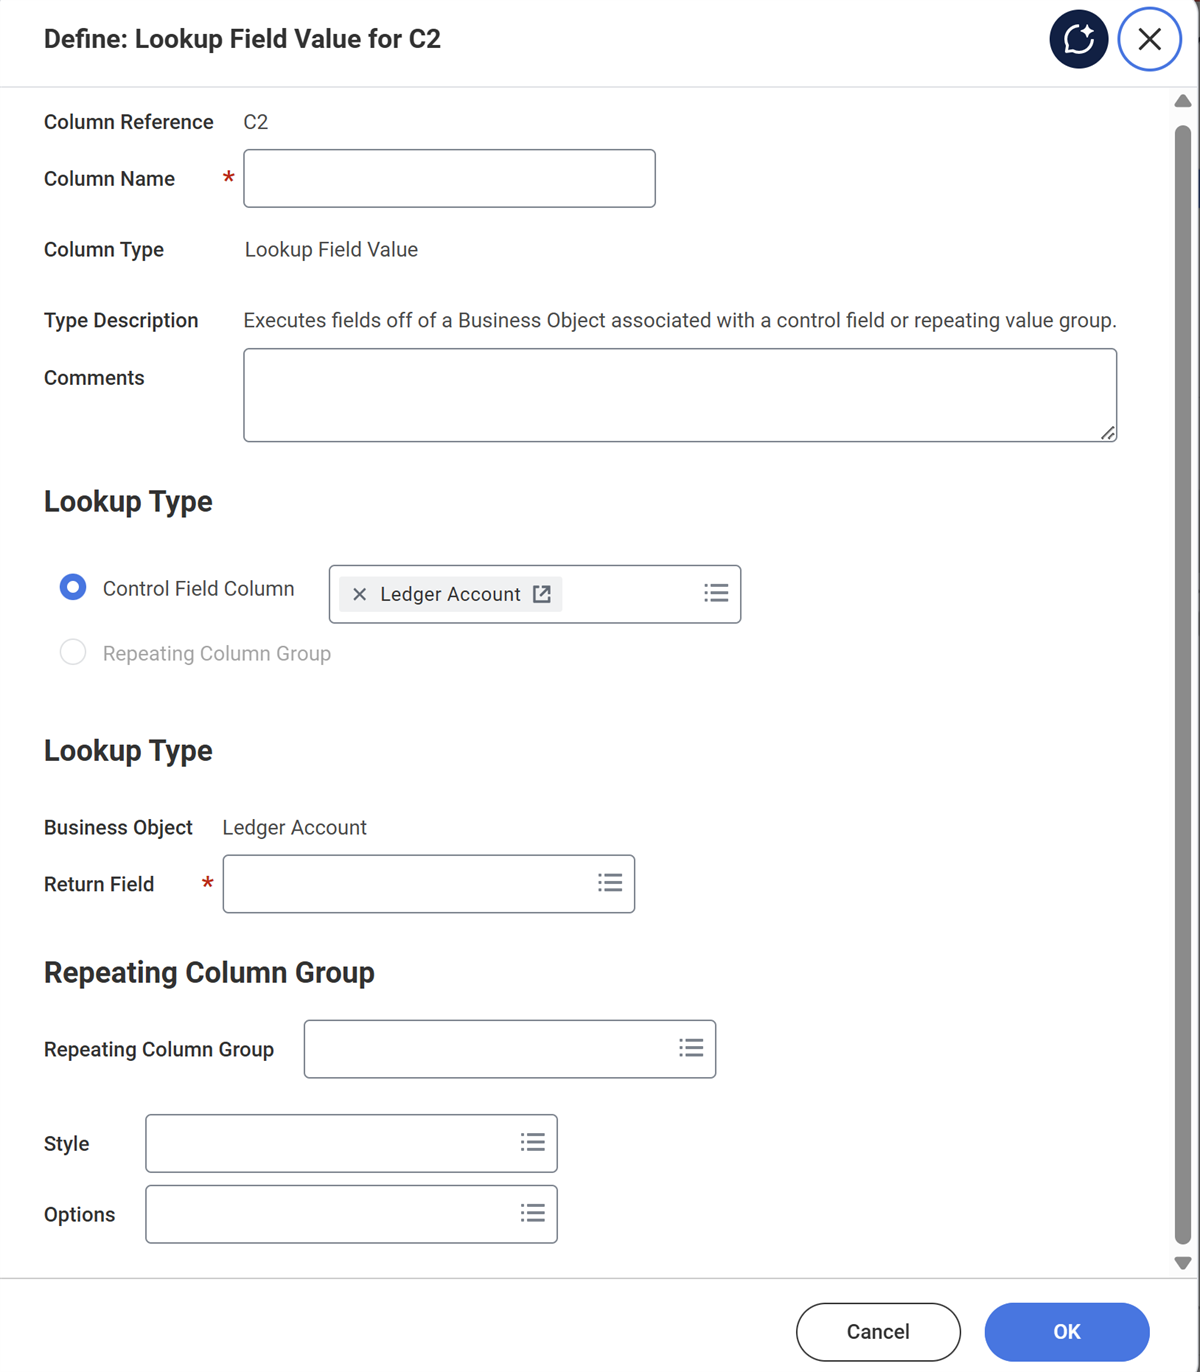
|
Column Type : CalculationRequired Fields :
Additional Information :
Note : You can override the Reverse the Sign settings at the report level.Reminder : Use this when you want to perform a calculation on the data columns identified in the report. | 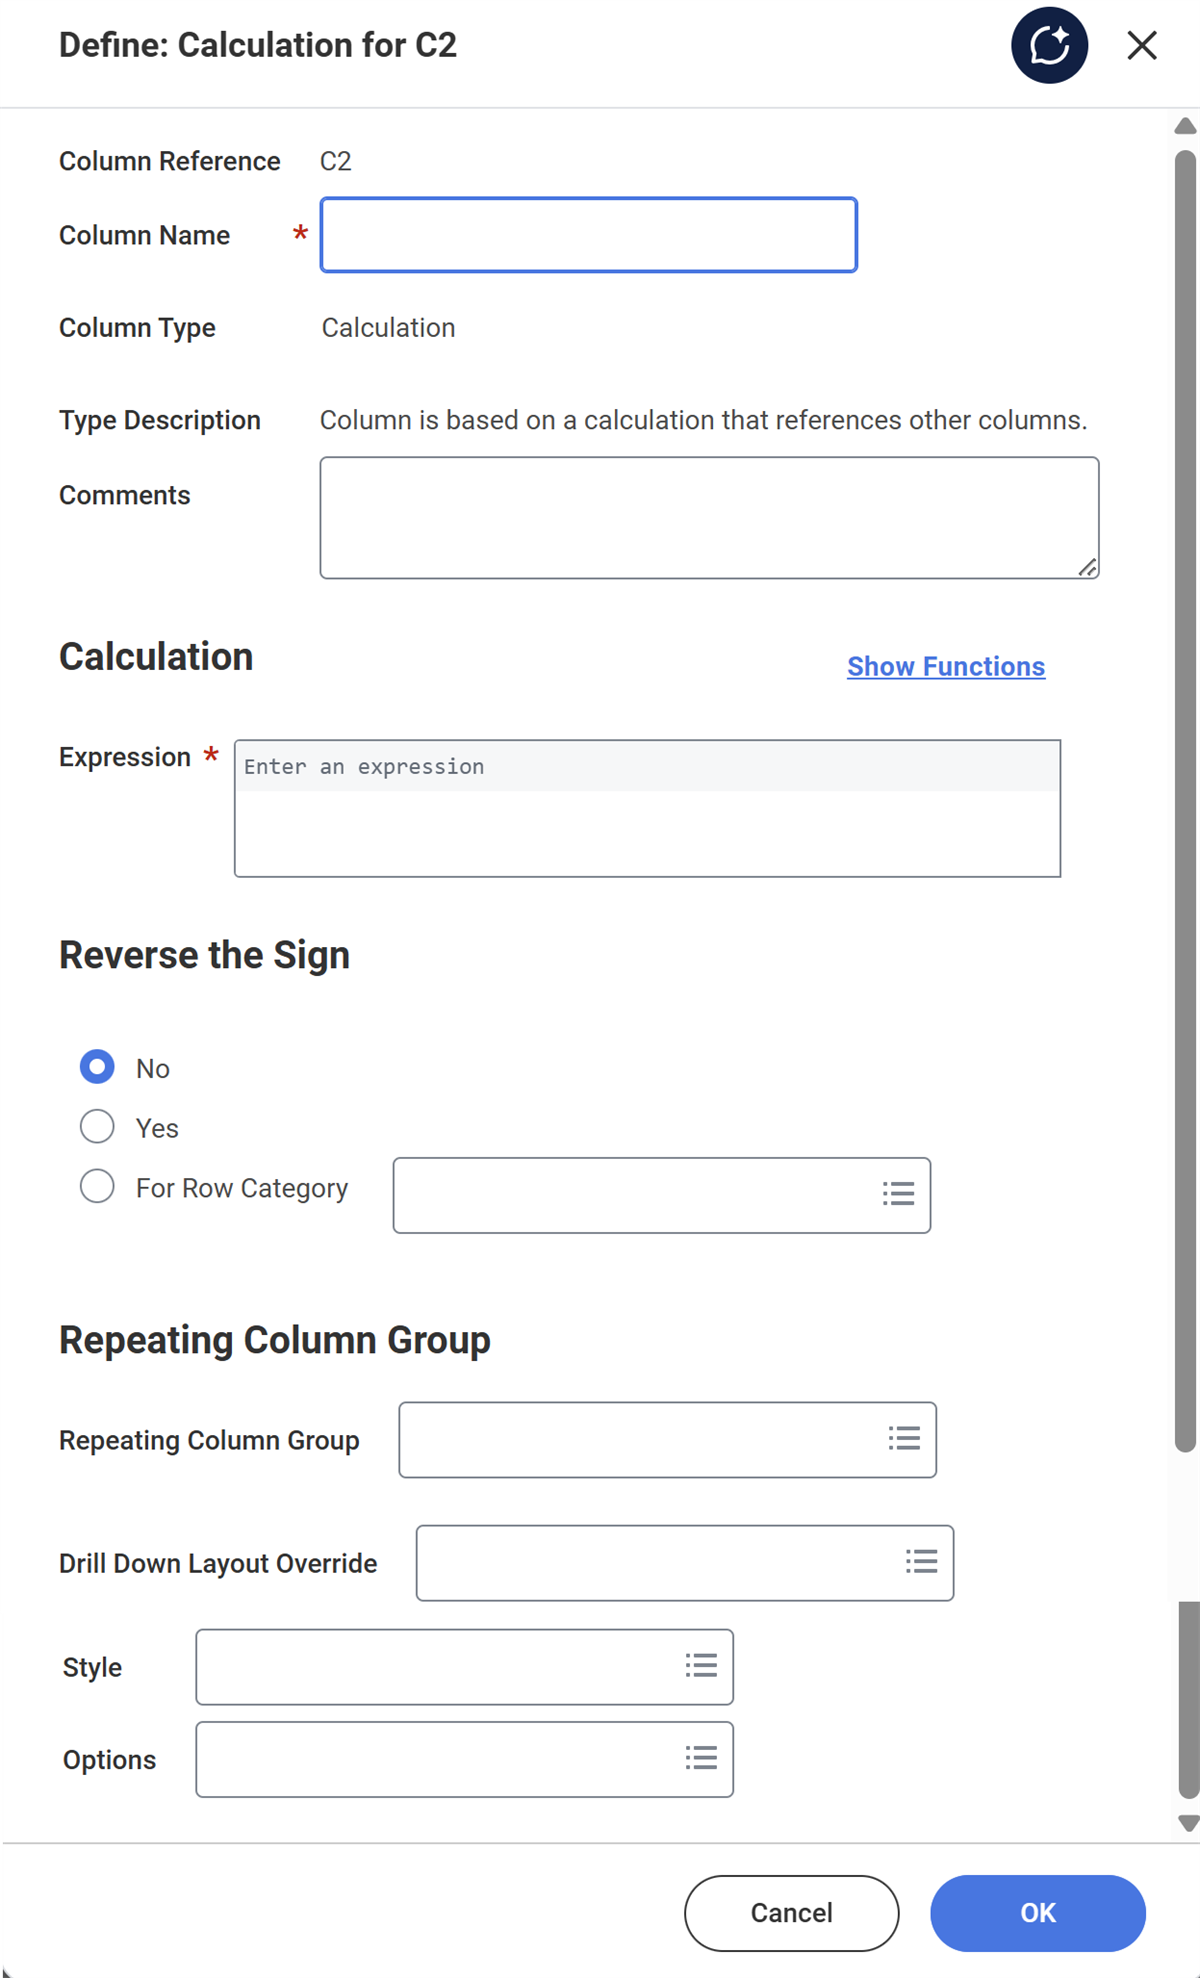
|
Column Type : EmptyRequired Fields : Column NameAdditional Information : Repeating Column GroupReminder : Use this when you want to insert an empty column. It is also a good practice to name your different columns so that you know where they appear, e.g., Empty Column 1. | 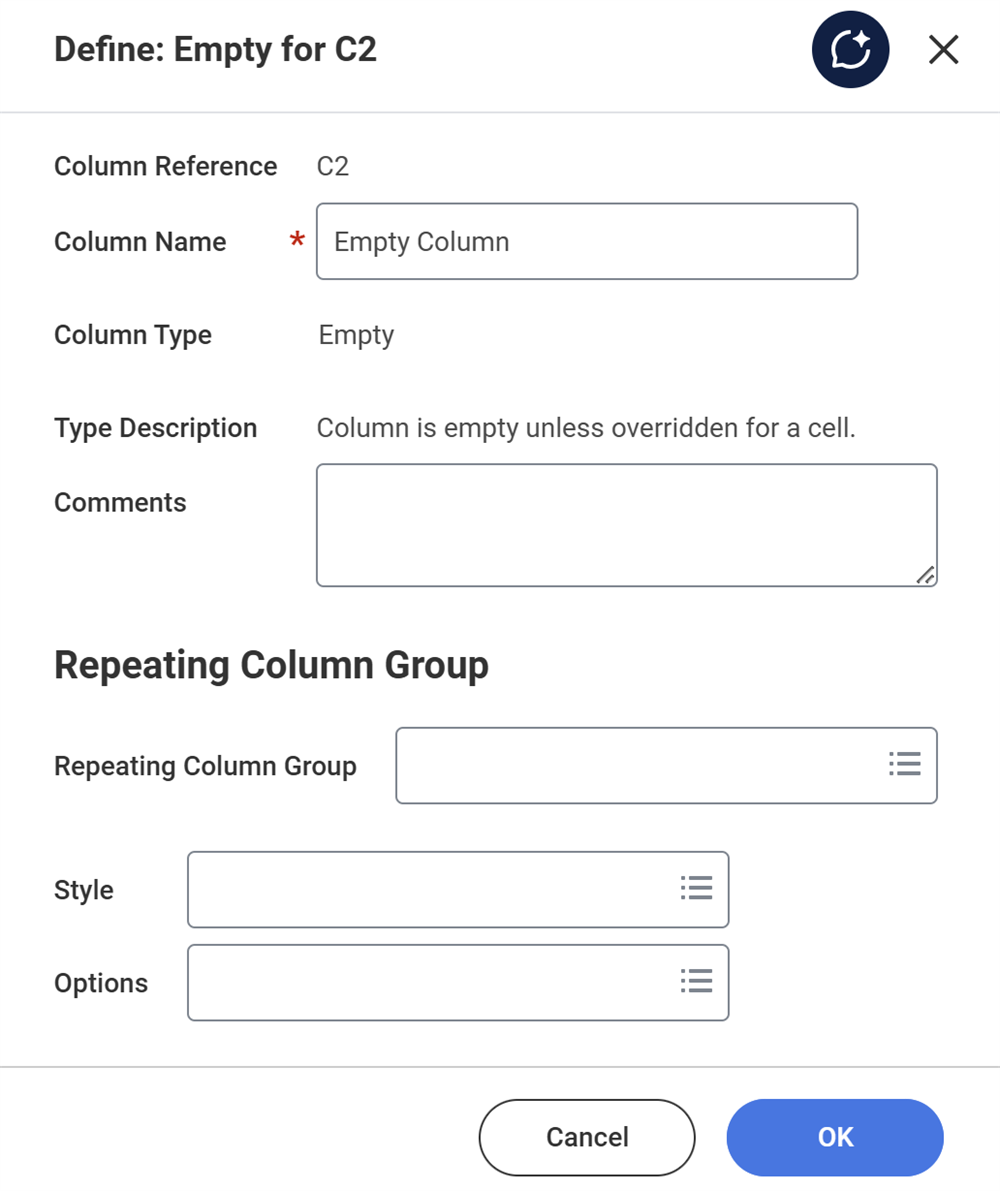
|
Delete Multiple Composite Report Columns
On the Columns tab, hold the Shift key to select multiple columns and select
Delete
to delete multiple columns at one time. If there are column references in the report select Clear All
to remove the columns and any references to that column. The image below highlights the Clear All
button.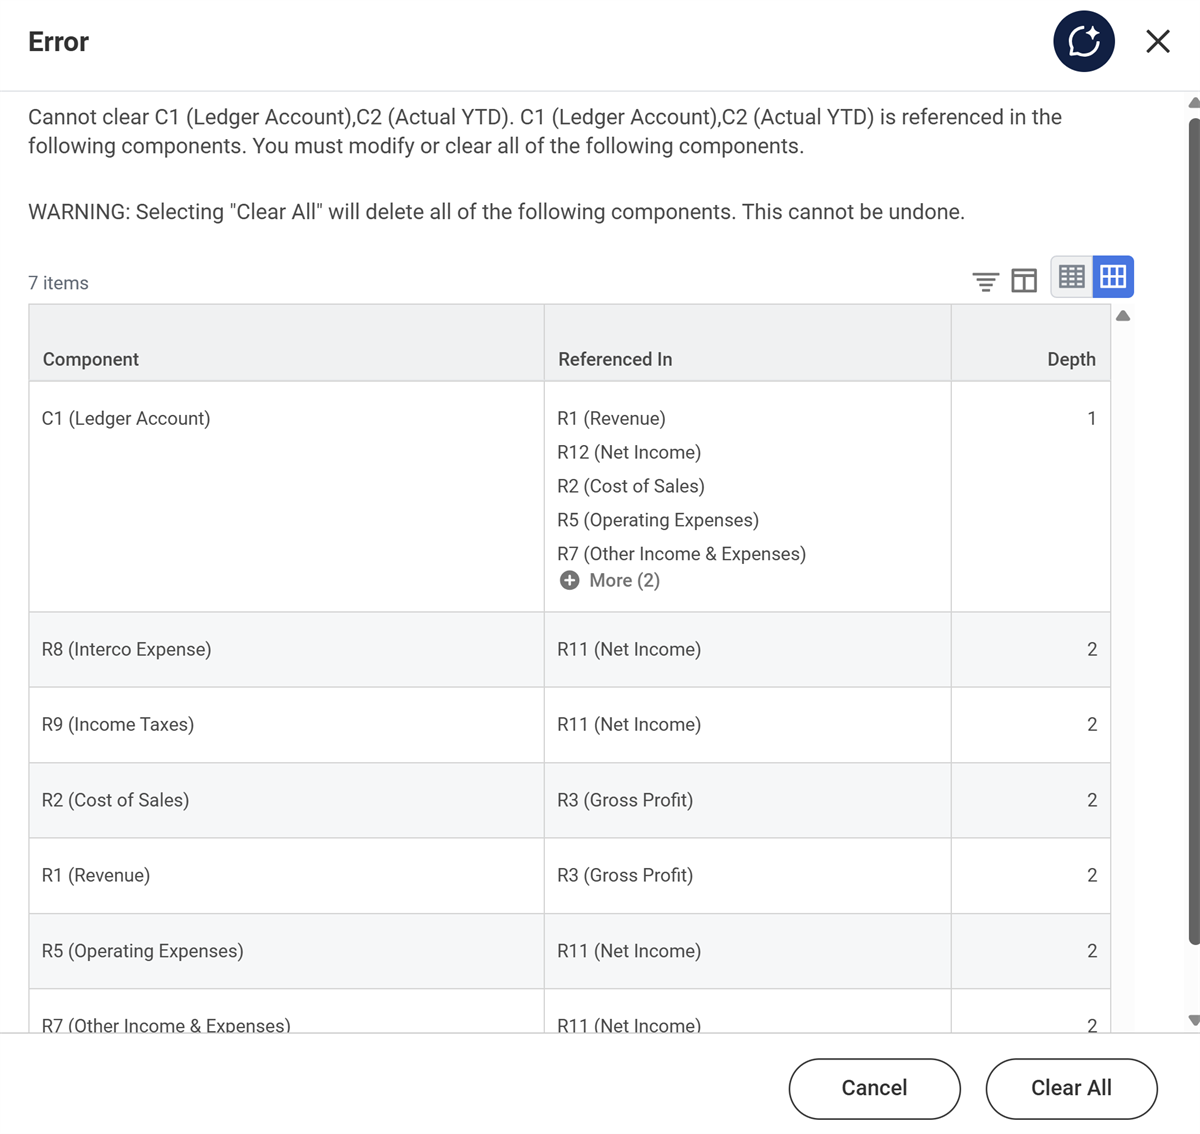
Styles and Formatting
You can create formatting styles or use styles provided by Workday to gain more control over the look of the cells, columns, and rows in your composite report. You can apply formatting to composite reports you export to Excel or view in your browser. You can add items such as currency symbols, colors for negative numbers, shading, double underlines, and more. In addition to formatting styles, you can:
- Control other display options in the report, such as hiding columns or rows. Include blank columns or rows.
- Override the style and visibility of a column, row, or cell, including calculation, data, or empty cells.
- Use analytic indicators.
When using formatting styles, you cannot:
- Apply numerical formatting because Workday treats numerical characters in the control field column as text.
- Create report-specific styles.
- View conditional formatting or all formatting styles on mobile devices.
Column Style and Options
Each column allows you to customize the style and options for that particular column. We cover styles throughout the course.
The Options field varies depending on your column selections. The most common selectable option here is Hide Column. The data for the column still exists, and you can still perform calculations on it, but it is not visible when the report runs.
Row Style and Options
The row style and option selections are like those of the column. Style options allow you to apply formatting to the displayed report data. Row options exist to customize how rows display. You can hide rows from the report output, reverse the sign on a row, and format the row text.
Example
: In the case of credit recorded revenue, you need to reverse the sign so that it appears positively on a report. Some calculations might also need the sign reversed so that the value or values appear correctly.Cell Style and Options
You can apply style formatting to selected cells just like you would a column or row. Cell style overrides all report, column, and row styles. You can also select display options such a reverse the sign and hide the cell value.
General Report Style
You can apply styles to the entire report instead of at the column, row, or cell level. You can set this in the General tab of the Report Settings section.
Changing the style here applies to the whole report. Individually configured column, row, or cell styles overrule this general report style, however.
Row Configuration
Row Types
There are five Workday-delivered row types that are configurable:
Row Type | Definition |
|---|---|
Lookup Data | Use to summarize and filter data. Allows you to identify the field that contains the data you want to display and allows you to define the detailed instances of that data to include. |
Combine Data |
|
Dynamic Data | Dynamic Data rows are a configurable row type that allow you to dynamically determine the content of a row at the time the report is run by using the results of a specified advanced report as a subreport.
|
Calculation | Based on a calculation that references other rows. When selected, you are required to configure a calculation type. |
Empty | Used to provide spacing between rows with data. By default, an empty row will not display any data unless overwritten with cell data. |
Here are some examples of how you can use each of the row types:
- Lookup Data: This allows you to specify what data to include in the row. For example, if you need a row that reflects revenue, you can define a lookup data row to pull all data that reflects revenue. Such as, all ledger accounts that roll up into revenue.
- Combine Data: This acts as a bucket where you can put all of your data in a row. It calculates automatically based on the Control Field column or columns specified in your report. You can use this for sorting and totaling. For example, if you want to include a row at the bottom that says "Total," you can add a Combine Data row that will include all necessary information in that row.
- Dynamic Data: You can determine content dynamically when you run the composite report. This row type uses the results of a specified advanced report definition as a subreport. You can also apply an aggregate calculation to the dynamic data row results. For example, you can look up specified values for every cost center that meets the criteria you define and sum all cost center values returned by the dynamic data row. Any sorts you define in the advanced report will carry over to the rows in the composite.
- Calculation: This is similar to the Calculation column type, including the types of calculations that the system can perform. For example, you might sum revenue and expense to calculate net income.
- Empty Row: This is similar to the Empty Column functionality; it generates an empty row to separate out sections of data. You can also use this type to enter a text label into a specific cell. We explore this in more detail later in the course.
Row Category
Category is useful whenever the option to Reverse the Sign is used on specific rows. This allows rows to be treated differently than a column calculation.
Example
: A composite report definition contains Revenue, Cost of Sales, and Gross Profit rows. Reverse the Sign has been selected for the Revenue and Gross Profit rows. When a column calculation is added, the column formatting will override the Reverse the Sign option selected on the row (for example, the % variance between current and prior year numbers).Adding a row category to rows requiring the sign to be reversed specifies that options for those rows should be treated differently.
Bulk Row Creation
On the rows tab, select the
Bulk Add Rows
button to add multiple rows at one time. This opens the Bulk Add Row screen where you can select one or more rows to add. Bulk Add Rows enables you to:- Change or view the selectedBusiness Object And Hierarchyoption.
- Expand or collapse all nodes in the hierarchy using the icons at the top of the screen.
There are three options to add rows:
- Select a node to add to the report.
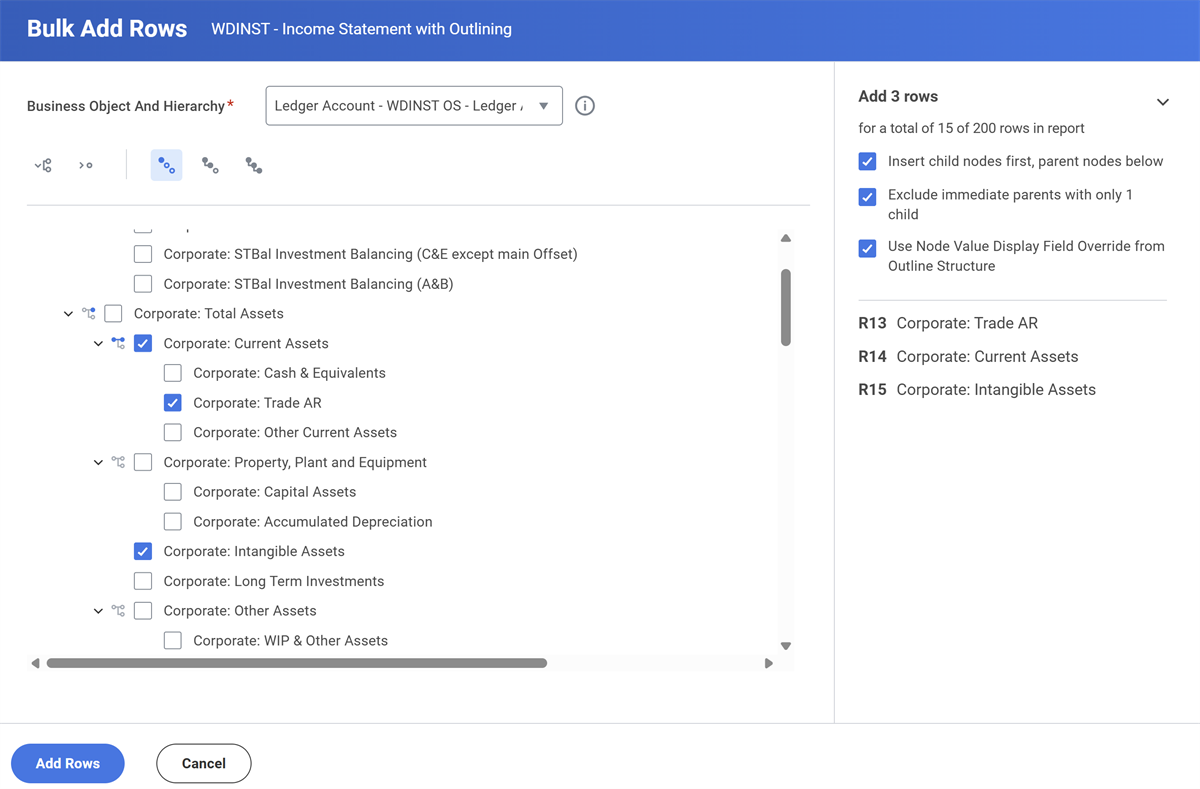
- Select a node and its children to add to the report.
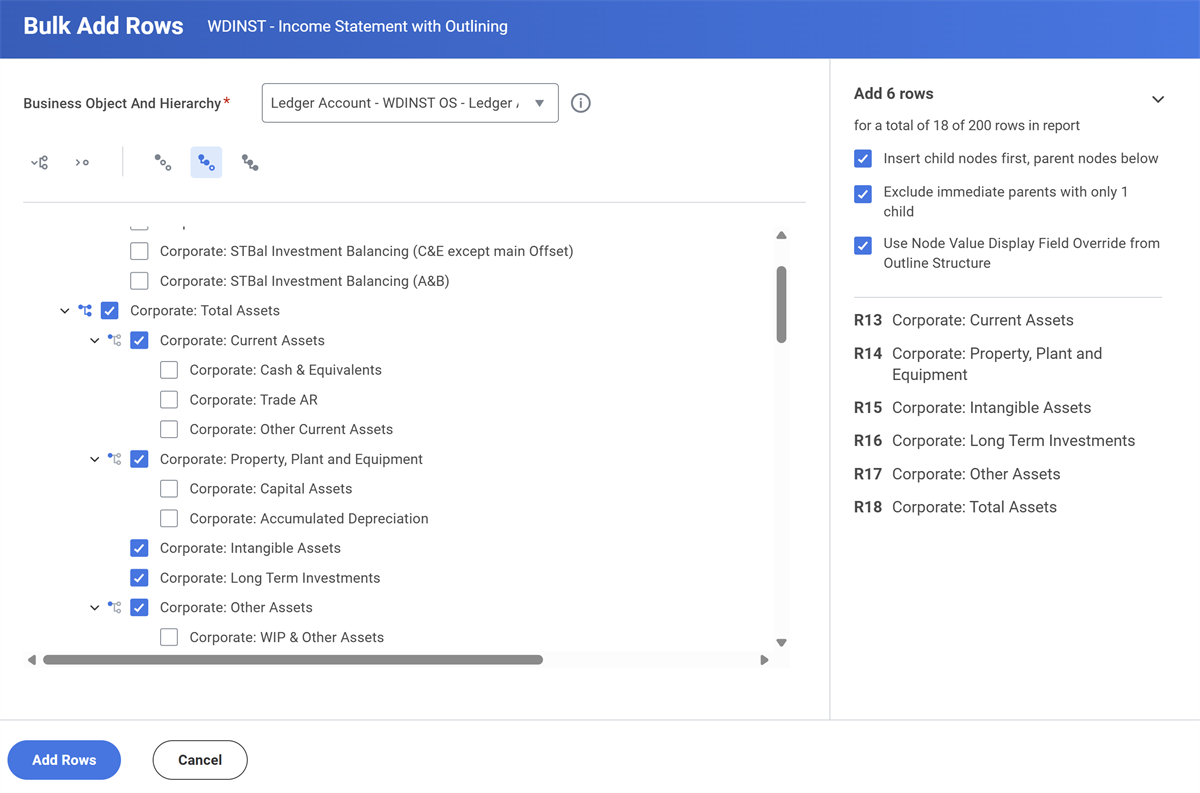
- Select a node and its descendants to add to the report.
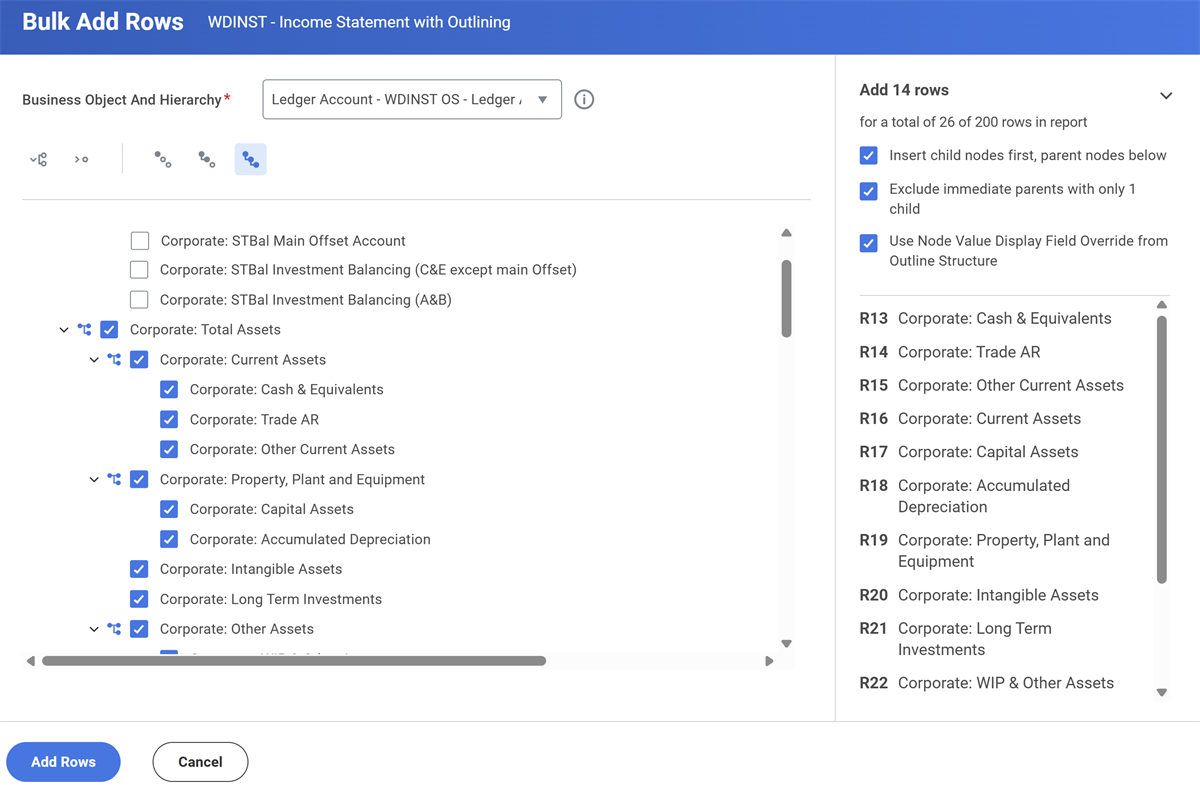
Note
: Workday disables Bulk Add Rows
if you exceed 200 rows.Column and Row Calculations
Workday provides a calculation expression builder that enables you to configure formulas and nested functions on calculation columns, calculation rows, and cells in your composite report.
When creating or editing a calculation, select Show Functions to display the function library and view descriptions and examples for all available functions. In addition to the functions, you can create expressions directly with columns. Workday displays valid options for your expressions when you enter a left square bracket in the expression field.
You can enter an expression in the Calculation section two ways:
- Enter the column or rows for the expression. For example: [C3] - [C4].
- Select the function to apply to the columns or rows. Difference([C3],[C4]).
The following table gives a description and examples of each function available in the expression builder.
Function | Description | Examples |
|---|---|---|
Difference | Subtracts the second value from the first value. | [R5]-[R3] Difference([C5],[C3]) |
Divide | Divides the first value by the second value. The second value supports cells when the first value is a column. Workday defaults the third parameter, Return Zero on Error, to true. You can divide by a constant value with up to 10 digits. You can't divide by:
| Divide([C3],[C5]) Divide([C3],10) Divide([R3],[C5],true) Divide([C3],[C5],false) Divide([C3],[R3C5]) [C3]/1234567890 |
Multiply | Multiplies more than 1 value. You can multiply by:
You can't multiply by zero. | Multiply([C3],[C4]) Multiply(([R3],[R4])*[R5]) Multiply([C3],1.04) Multiply([C3],123456789012) Multiply([C3],10) [R3]*[R4]*[R5] [C3]*0.123456 |
PercentIncrease | Returns the difference in percentage of the first value from the second value. Workday defaults the third parameter, Return Zero on Error, to true. | PercentIncrease([R3],[R5]) PercentIncrease([C3],[C5],true) PercentIncrease([R3],[R5],false) |
PercentRemaining | Returns the percentage remaining after dividing the second value by the first value. Workday defaults the third parameter, Return Zero on Error, to true. | PercentRemaining([R3],[R5]) PercentRemaining([C3],[C5],true) PercentRemaining([R3],[R5],false) |
Sum | Returns the sum of multiple values. | Sum([R2],[R3],[R5]) Sum([C5]) [R2]+[R3]+[R4]+[R5]+[R6]+[R7] |
SumRange | Returns the sum of all columns, from the first column to the last column. The first column must precede the last column in the table. | SumRange([C3],[C5]) SumRange([R2],[R9]) |
Note
: You can nest up to five functions in one expression. Workday uses the standard order of operations, also known as PEMDAS, for mathematic expressions:- Parentheses
- Exponents
- Multiplication
- Division
- Addition
- Subtraction
Workday reads functions from left to right.
Example
: In the expression [C3]/[C2]*[C3], Workday divides, then multiplies the values. However, if the expression is [C3]/([C2]*[C3]), then Workday will multiply first, then divide.Creating a Drillable Total
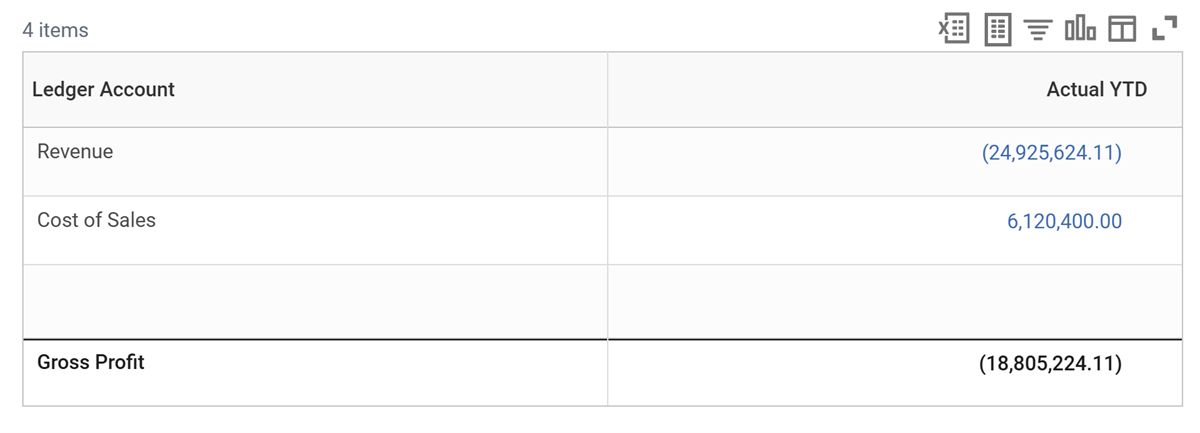
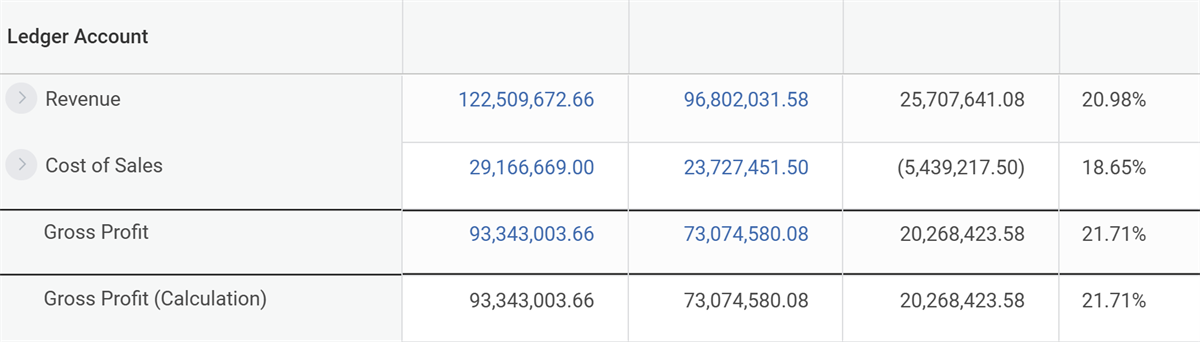
Once you configure rows and columns, you can create a drillable total for rows and drillable data columns. Use a Lookup Data or Calculation row type to create a total row. As seen in the screenshot, a calculation row will not have a drillable total, but a lookup data row will. You can also configure a drill down layout override for calculation columns.
Hierarchies & Ledger Account Summaries
In composite reporting, you can use hierarchies to perform consolidated reporting. In other words, you can report on levels below the top level. With hierarchies, you can build an outline structure used by the composite report to drill into (or "expand") the different levels of the hierarchy. In this way, outline structures both display the hierarchy and allow filtering on its various levels.
Hierarchies define the superior and subordinate relationship between objects in Workday. Hierarchies are used for:
- Organizations.
- Revenue Categories.
- Spend Categories.
- Ledger Account Summaries.
Ledger account summaries establish hierarchical relationships between ledger accounts and include a range of accounts, specific ledger accounts, or several account summaries. Once you create a ledger account summary, you can use it to report on data such as:
- Hierarchy level.
- Hierarchy name.
- Included ledger accounts.
To view a ledger account summary, launch the
View Ledger Account Summary
task.Location Hierarchies
A worker's location is an attribute of their position or job. Locations must be business sites or subordinate to a business site. A location hierarchy is an ordered organizational structure of locations. Workday automatically includes workers as members of the location hierarchy containing the location of their position. You can use location hierarchies in many ways, for example:
- Assign roles on a location hierarchy.
- Use location hierarchies to define geographical areas for regulatory reporting.
Note
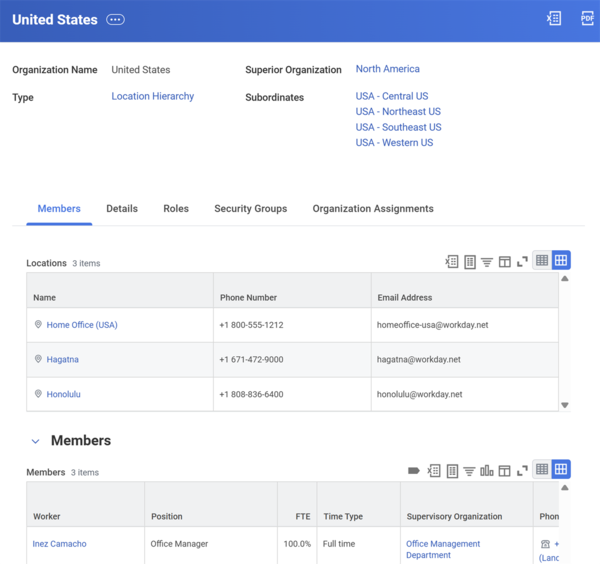
: The image above shows the location hierarchy of the United States. Its superior organization location is North America, and has four subordinates, which you can drill into by selecting them. Toward the bottom of the image, are the members, details, roles, and security groups associated with this particular location hierarchy.Cost Center Hierarchies
Workday typically assigns cost centers to a cost center hierarchy. This hierarchy provides a tiered way to view groups of financial transactions separately from the supervisory organization. The hierarchy dictates parent-child relationships between organizations and workers.
Note
: Here you can view the subordinate cost center organizations of the superior organization Cost Center Hierarchy, including Finance, Human Resources, Information Technology, Operations, and Sales & Marketing.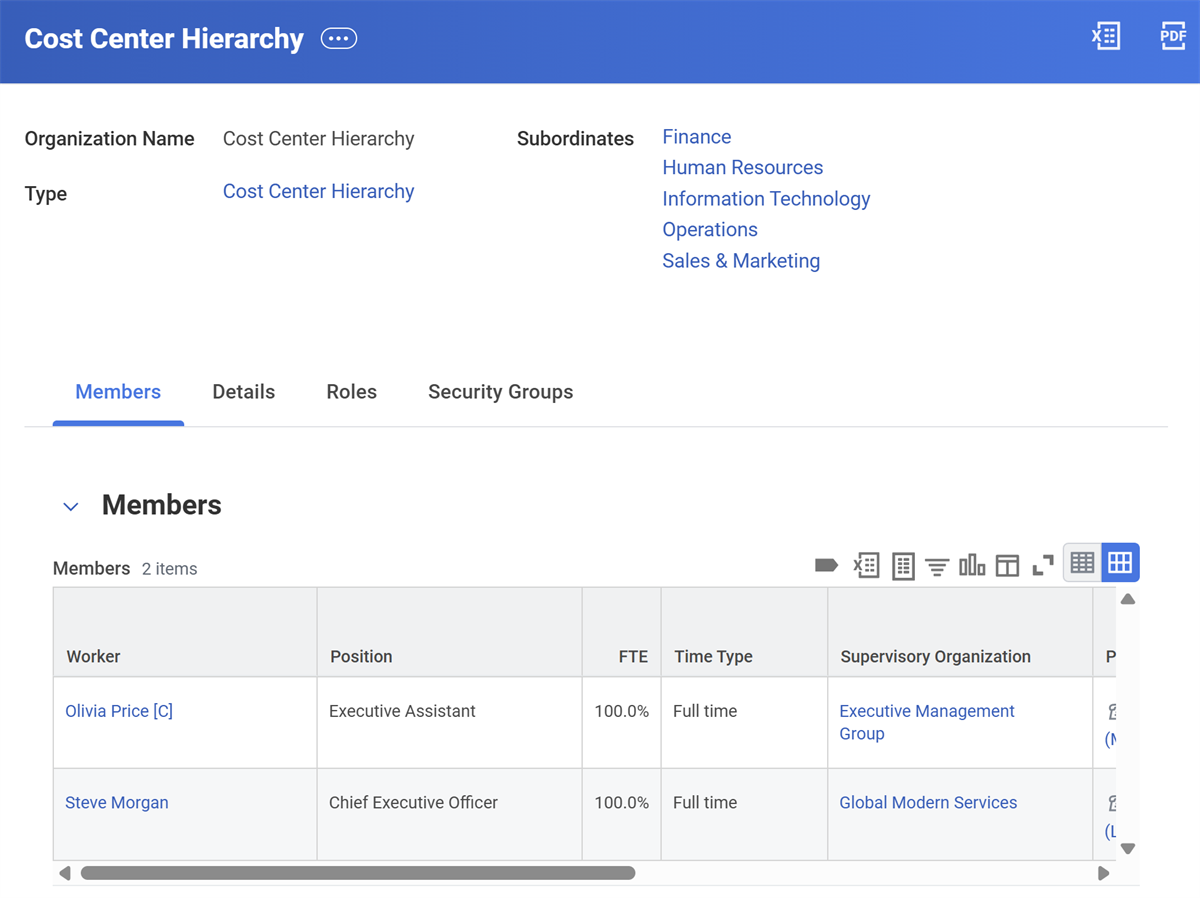
Outline Structures
Outlining is a configuration for composite report hierarchies that you use in Workday and when exporting to Excel. You can define hierarchies using an outline structure. Outline structures consist of one or more hierarchies and enable you to 'nest' hierarchies or group by fields. Nesting allows you to drill down to lower hierarchies that may consist of ledger accounts or categories.
Terminology
Term | Definition |
|---|---|
Nested Hierarchies | Using multiple hierarchies together where one hierarchy (e.g., cost center hierarchy) continues after the maximum level of another hierarchy (e.g., ledger account) ends. |
Primary Hierarchy | The high-level hierarchy in the report that also displays on the initial report. |
Secondary Hierarchy | The second-level hierarchy in the report. For online reports, you can only access the secondary hierarchy when the user expands a node in the hierarchy beyond the leaf nodes of the primary hierarchy. |
Expansion Hierarchy | Any hierarchy that is not a primary hierarchy. |
Example
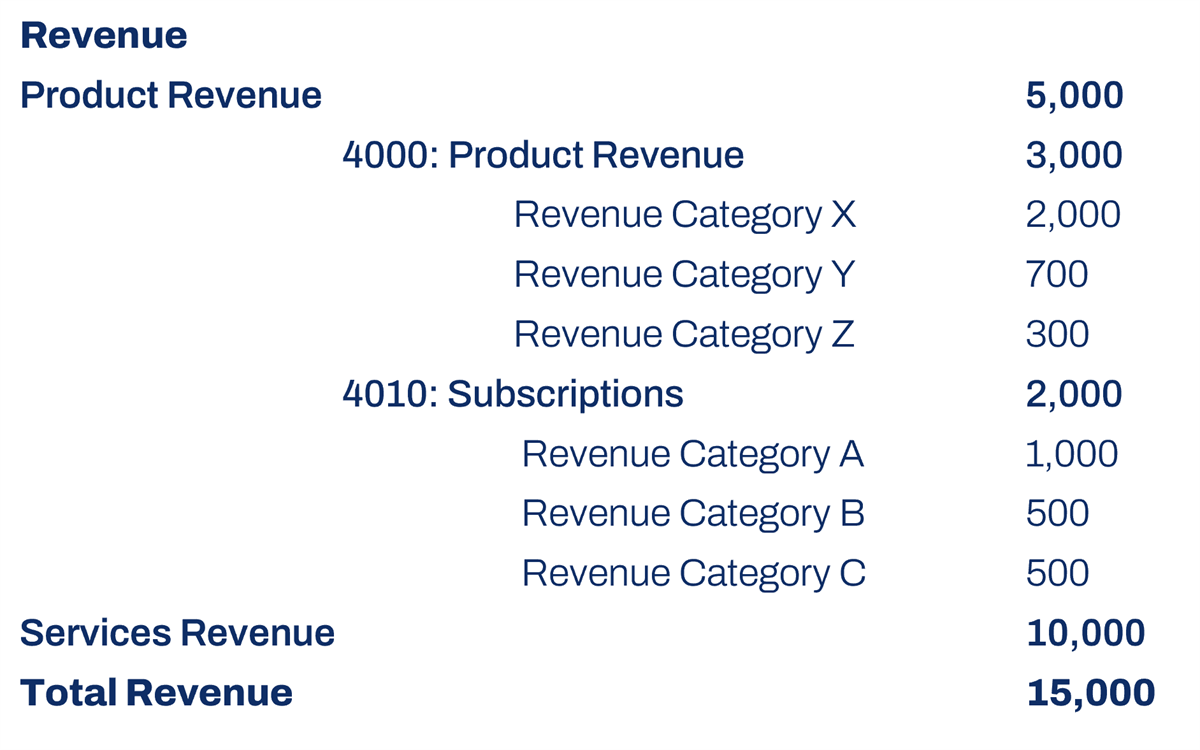
: Here is an example of a nested hierarchy.The Product Revenue label is a hierarchy that consists of two detail accounts, 4000: Product Revenue and 4010: Subscriptions. Revenue category is a separate dimension nested under each account.
Primary Hierarchy
The outline structure consists of the Primary Hierarchy definition and the Expansion Hierarchies grid. You can identify each outline structure by a required title and optional description. You can use the outline structure in any composite report.
You can select any business object to be the primary hierarchy, i.e., the highest level. Once you select it, the remaining fields within the primary hierarchy populate, but you can override them. Populate all fields except for the Node Value Display Field Override and the Detail Value Display Field Override.
Field | Information |
|---|---|
Business Object | This can include any business object. |
Outline Approach | Specifies whether the outline level or levels defined are based on one or more hierarchical levels, or based on a field's value. The approach consists of Use Field Value or Use Hierarchy. |
Hierarchy Type | Select the hierarchy type from the list. Only the hierarchy types for the selected business object are available to select. |
Top Level Node | You can select configured hierarchies here. |
Last Level | You can configure 10 node levels here, or you can select the leaf node. A leaf node is the last level of the hierarchy; it has no child nodes associated with it. |
Node Value Display Field Override | Any valid text, single instance, or self-referencing field associated with the class of the top-level node for the hierarchy. |
Detail Value Display Field Override | The report field on the report. Any valid text, single instance, or self-referencing field associated with the business object is valid. |
Outline Structures in Composite Reports
You can use outline structures in various areas of a composite report. For Control Field columns, define the outline structure in the Outline Data section. The Default Outline Data checkbox will default the outline structure on your row configurations.
By default, the hierarchy structure will not initially expand. However, you can set the initial display to Once or Twice to determine the level at which you would like the structure to initially expand. Include a Hierarchy Effective Date if you need to use a date other than today's date.
To filter a row based on the outline structure, you must reference the outline structure in the Business Object Enabled for Filter and Grouping table in the report settings.
Within a row, you need to define the outline structure in the Outline Options section. Use the Expansion Level option to specify the primary hierarchy level to display when you initially expand an outline in a composite report.
Chapter Summary
- Composite reports have rows and columns that are configurable and determine what data is displayed.
- You can apply styles and formatting at the column, row, report, or cell levels.
- The system can perform calculations on data from subreports.
- Hierarchies define superior and subordinate relationships between objects, providing a simple way to consolidate reporting.
- Define outline structures to use them in any composite report.
- You can expand each node in a hierarchy to view the data it contains.