
Composite Reporting for Financials Overview
Overview
In this chapter, you will start planning to build an income statement using the composite report type. Composite reports use subreports to combine data from multiple data sources into a single report. Using composite reports, you can set up cells, columns, and rows to perform calculations. You will learn the components of a composite report and build a matrix subreport to use in your income statement.
Objectives
By the end of this chapter, you will be able to:
- Describe the components of a composite report.
- Understand the composite report settings.
- Navigate through a composite report.
- Build a matrix report as a subreport for a composite report.
Financial Statements in Workday
Workday Financial Management allows you to build core financial statements that are timely, actionable, and flexible. Most financial statements use the composite report type.
- Timely Data: Traditional systems rely on batch processing, which can be time-consuming and costly. Workday, however, captures business dimensions at the point of transaction and maintains them through transactional, management, and financial reporting. In addition, the in-memory architecture in Workday creates and updates accounting and financial reports in real time.
- Actionable Data: Workday gives you the capability to filter, sort, and drill down into the data. For example, you can view an invoice from a specific day or time.
- Flexible Data: You can add worktags to classify your data. You can use worktags to run daily, monthly, and annual reports by a specific worktag. For example, when workers fill out purchase orders or expense reports, they can assign worktags, such as the department and the project it is for.
Features of Composite Reporting
Composite reporting has a wide variety of uses. The main use for composite reports is to join and format data.
Report Uses | |
|---|---|
Join Data |
|
Formatting |
|
Composite reports allow you to pull the contents of subreports into a single report. This enables you to specify and configure both columns and rows displayed on the composite report. You can also report on the data at the column, row, or cell level. You can perform column, row, and cell calculations and sort and filter them.
Additionally, you can format data with options similar to that of a spreadsheet, creating headers and footers as well as applying different styles.
Report Features | |
|---|---|
Functionality |
|
Multi-Dimensionally |
|
Design and Format |
|
Composite Reporting Framework
Composite reporting is a powerful tool that allows you to combine data from multiple data sources, using subreports, into one report. Additionally, composite reports allow you to:
- Perform column, row, and cell calculations.
- Apply formatting styles.
- Filter rows with outlining by multiple business objects.
- Apply outlining to repeating columns.
Components of a Composite Report
Columns
Columns are customizable to meet your reporting needs and unique to composite report types. You define columns at each column level, including defining their calculations.
The following table lists the five different column types and their corresponding definitions.
Column Type | Definition |
|---|---|
Control Field | A common control field can be a delivered, calculated, or custom field on the report's primary business object. To find a common control field, identify common instance data dimensions that have the same related business object. |
Data | Defines the subreport from which you are pulling data. Once you identify the subreport, you will need additional configuration to specify how to treat the data. Once the composite report generates, you can drill into the data. |
Lookup Field Value | This gives you the ability to include fields associated with the Control field in the composite report. You will need to define the field to return as an attribute of the business object associated with the Control field. |
Calculation | Based on a calculation that references other columns. When selected, you will need to configure a calculation type. There are seven different types of calculations. By default, calculation columns are not drillable. |
Empty | Used to provide spacing between columns with data. By default, an empty column does not display any data unless overwritten with cell data. |
Here are some examples of how you can use each of the column types:
- Control Field Example: If you have identified multiple subreports to include in your composite report, this is the field that ties all of those subreports together. For example, if you build your composite report to identify the linkage between budgets and actuals, the control field is likely going to be Ledger Accounts.
- Data Column Example: This is going to include any information from your subreport. For example, in our Income Statement, you will pull in the Amount (Ledger/Budget Debit-Credit) totals that generate for each ledger account in our Journal Lines subreport.
- Lookup Field Value Example: If you want to include additional data related to your control field column, you can include that data here. For example, including the ledger account type of a control field of ledger account or including the cost center manager for a control field of cost center.
- Calculation Example: If you are working with a report that has a large number of columns that we want to sum on a report. Rather than using a Sum calculation and identifying each individual column that we want to include in the sum, we can use a Sum Range calculation to identify the first column and last column to sum and it will pick up all columns within that range.
- Empty Column Example: This just inserts an empty line where you specify in the report. For example, you might want to do this in between time period columns, or after Totals columns. You could also use this to include a cell calculation. We will explore this in more detail later in the course.
Rows
Like columns, rows are customizable to meet your reporting needs and are unique to composite report types. You define rows at each row level, including defining their calculations.
This table defines the five different row types available in composite reporting.
Row Type | Definition |
|---|---|
Lookup Data | This allows you to identify the field that contains the data you want to display and lets you define the detailed instance of that data to include. |
Combine Data | Generate rows by uniting the controlling fields present in the subreports. You can use a combine data row in a calculation to create a total row. |
Dynamic Data | This enables you to determine content dynamically when you run the composite report. It uses the results of the specified advanced report definition as a subreport. The sort order is preserved from the advanced report to the composite. |
Calculation | This row is based on a calculation that references other rows. When selected, you will need to configure a calculation type. |
Empty | Used to provide spacing between rows with data. By default, an Empty row will not display any data unless overwritten with cell data. |
Below are some examples of how to use row types:
- Lookup Data Example: This allows you to specify what data to include in the row. For example, if you want to have a row that reflects Revenue, you can define a lookup data row to pull all data that reflects revenue (such as all ledger accounts that would roll up into revenue).
- Combine Data Example: This can act as a bucket where you can put all of your data in a row. It calculates automatically based on one or more Control Field columns specified in your report. For example, if you want to explore Trial Balance and include a Total row, you can add a Combine Data row that will include all of this information in that row.
- Dynamic Data Example: You can determine content dynamically when you run the composite report. This row type uses the results of the specified advanced report definition as a subreport. You can also apply an aggregate calculation to the dynamic data row results. Example: You can explore up specified account values for every account that meets the criteria you define and sum all account values returned by the dynamic data row. Any sorts defined in the advanced report will carry over to the rows in the composite.
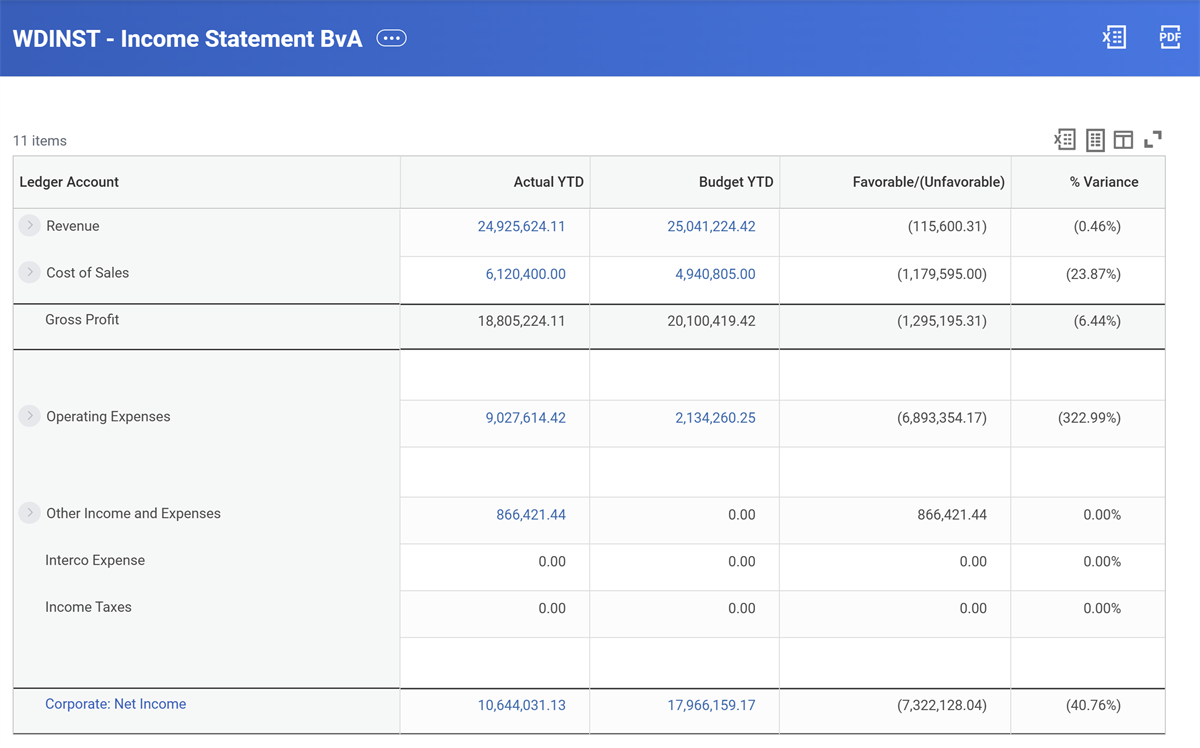
- Calculation Example: This is similar to the Calculation column type, including the types of calculations that the system can perform. For example, you might sum Gross Profit, Operating Expenses, Other Income and Expenses, and Taxes to calculate Net Income.
- Empty Row Example: This is similar to the Empty Column functionality; it generates an empty row to separate out sections of data. You can use this type to enter a text label into a specific cell.
Cells
In composite reporting, cells provide an additional way for you to pull in data from another data source. A cell is the intersection of a column and row. Workday provides the ability to create a cell that can contain a calculation, data, a label, or a conditional override.
Cell Type | Definition |
|---|---|
Cell Data | Data cell types are derived from data from a subreport. Cell data can pull data from any related data source. |
Cell Calculation | Calculation cells are derived from values calculated from other cells within the composite report. The calculation type determines the result and is one of six types:
|
Cell Label | Labels define text items within your report (i.e., titles, headings, or other characters). Cell labels can only be defined for cells within a Control Field column or within a Column Header row. Labels can be static text where the label does not change, or dynamic text where variables are defined. |
Planning a Composite Report
When planning a composite report, consider the following before you start to build:
- What are the common dimensions that serve as the control field column between data sources?
- How are you summarizing groupings?
- What information do you want to display via the drill-down and detail data fields?
- Are you using prompts at runtime? If so, which prompts do you need?
The Steps to Build a Composite Report:
To build a composite report, first build the subreports. When you build a subreport you:
- Define the Group by Fields.
- Select the Summarization Types.
- Define the Drill Downs and Details.
- Select the Filters and Prompts.
A composite report can contain one or many subreports. Each subreport needs to have a common object or grouping to build the composite report.
Once you build all your subreports, you can build a composite report. When building your composite report, you can:
- Specify the Business Object / Control Field.
- Define the Control Field Column.
- Define the Data Columns.
- Define the Rows (Optional).
- Define the Cells (Optional).
Finding a Common Control Field
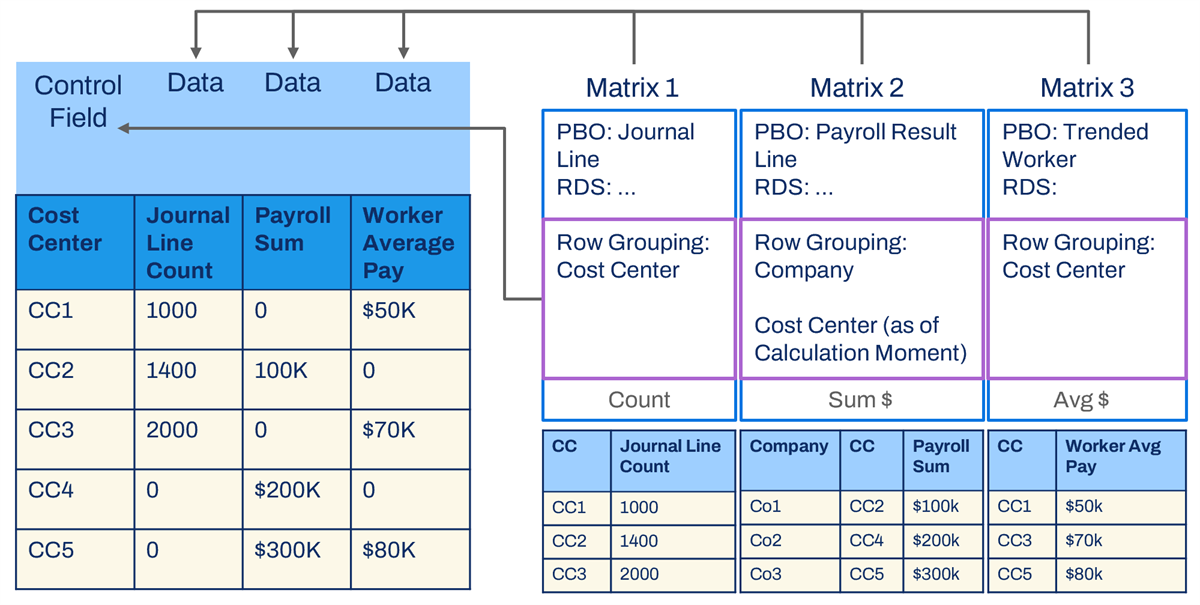
A common control field can be a delivered, calculated, or custom field on the subreport's primary business object. To find a common control field, you identify single instance type fields that have the same related business object.
In the following example, we want to build a composite report from three separate business objects: Journal Line, Payroll Result Line, and Trended Workers. To do this, we run the Business Objects Details report for these business objects to find a common dimension to use as the control field.
- Journal Line: The field name is Cost Center, the field type is single instance, and the related business object is Cost Center.
- Payroll Result Line: The field name is Cost Center (as of Calculation Entry Moment), the field type is single instance, and the related business object is Cost Center.
- Trended Worker: The field name is Cost Center, the field type is single instance, and the related business object is Cost Center.
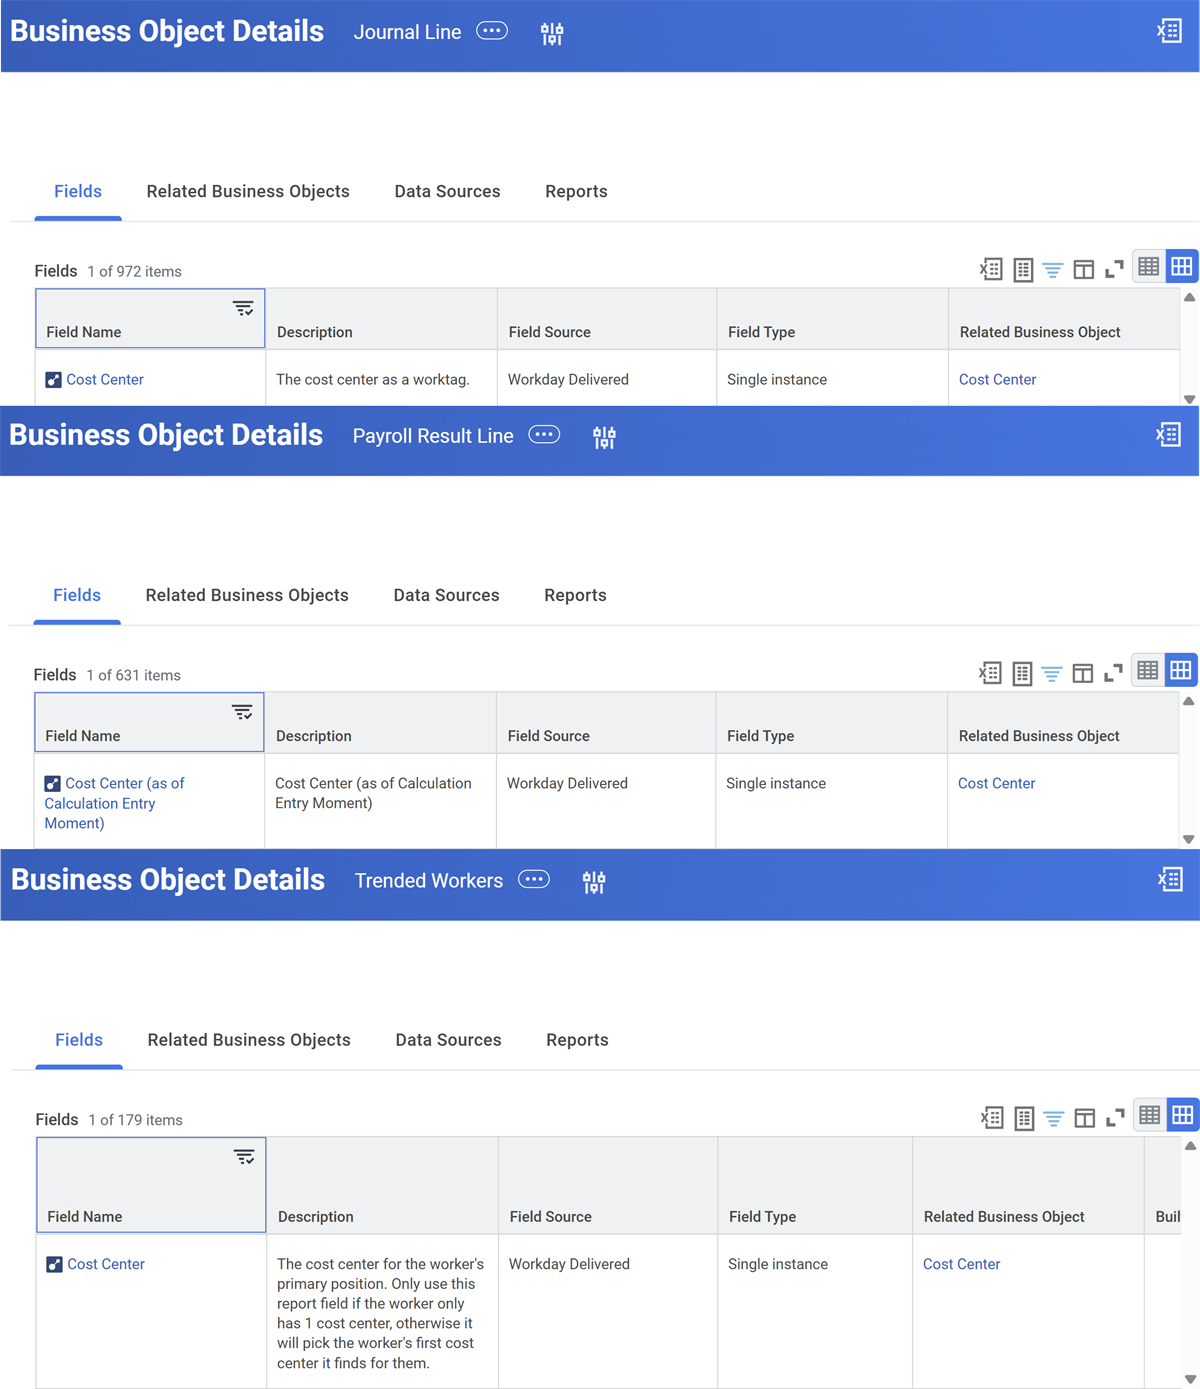
These fields are all single instance type fields and have the same related business object of Cost Center. We can use this business object as the common dimension between reports.
Note
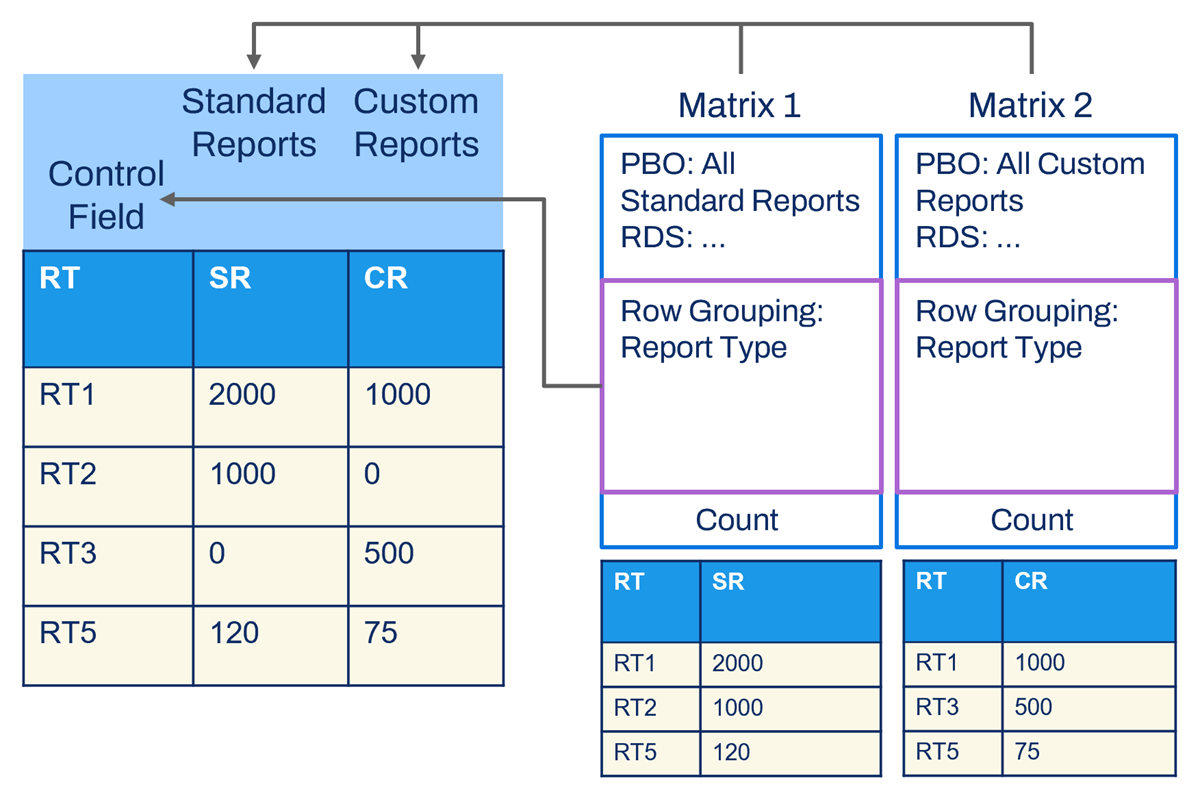
: The fields will often have a common name, but not always, as shown here.The following image shows two subreports using different primary business objects joined by a common dimension of Report Type.
Composite Report Settings
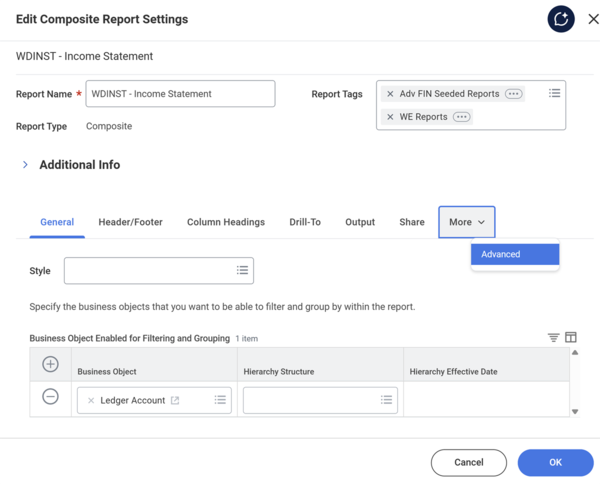
Composite report settings include several different components. In the header, you can edit the report name and add any report tags. In the tabs, you can configure overall report settings.
Tab | Configuration Options |
|---|---|
General | In the General tab, you have the option to define the prompt set and style of your report. The General tab is also where you choose your Business Objects and Hierarchy Structure. |
Header/Footer | In the Header/Footer tab, you can define the headers and footers for your report. |
Column Headings | The Column Headings tab is where you specify the column headings to include in your composite report. |
Drill-To | On the Drill-To tab, create or manage drill-to report links. |
Output | The Output tab allows you to configure the output options for your report. |
Share | From the Share tab, you can share the report with all authorized users, or with specific authorized groups and users. |
Advanced | The Advanced tab has some advanced report options similar to the options for matrix and advanced report types. This includes Enable Save Parameters and Exclude Execution Link from Search. |
Note
: It is important to understand the hierarchy of composite report configuration from general to specific:- Report Settings
- Column Configuration
- Row Configuration
- Cell Configuration
Report settings are the most general. You can override them in the settings at the column, row, and cell levels. The cell level is the most granular. Any settings configured at this level will override the settings at the other levels.
Using Matrix Reports as a Subreport
Subreports are the foundation of composite reports. Types of subreports are advanced, trending, or matrix report types. In this course, we focus on basic matrix subreports that allow you to drill down on and summarize your data. Matrix reports are similar, but not identical to pivot tables and crosstabs found in other systems.
In a subreport, you group data in a row and, optionally, a column. The Group by field on your subreports must use the same related business object as the control field column on your composite report. At runtime, the matrix report builds both horizontally and vertically on the page, according to the criteria specified. Once the matrix report displays, you can view the summarization data by different fields. You can drill into the cell values of the matrix report and group the results by another field (View By). You can also view the details (View Details) that comprise the number in the cell of the matrix.
When building a composite report, the system pulls data in from one or many subreports and reports on data that shares a common control field. The composite report does not have any of its own data. Therefore, it is important to define what information you want to appear on your subreport.
Security Note
: If you create a matrix report and share it with a user not authorized to view the Summarization field, a runtime error appears when the user attempts to run the report. This is true of the composite report as well.Naming Conventions
A best practice is to come up with a consistent naming convention across all subreports to help you find your subreports more easily. Some common naming conventions for subreports include adding "subreport" to the report name. It is also common to include the data source in the report name, which helps to identify what type of data is in the report output. You can also include the composite report name that the subreport is created for. Those three elements for subreports should give users a general idea of what the report is for.
Data Visibility
Before you start building your matrix report, keep in mind what data will appear, or not appear, on your subreport. The filters and prompts on your subreport determine what data flows into your composite report.
Excluding a Report from Search
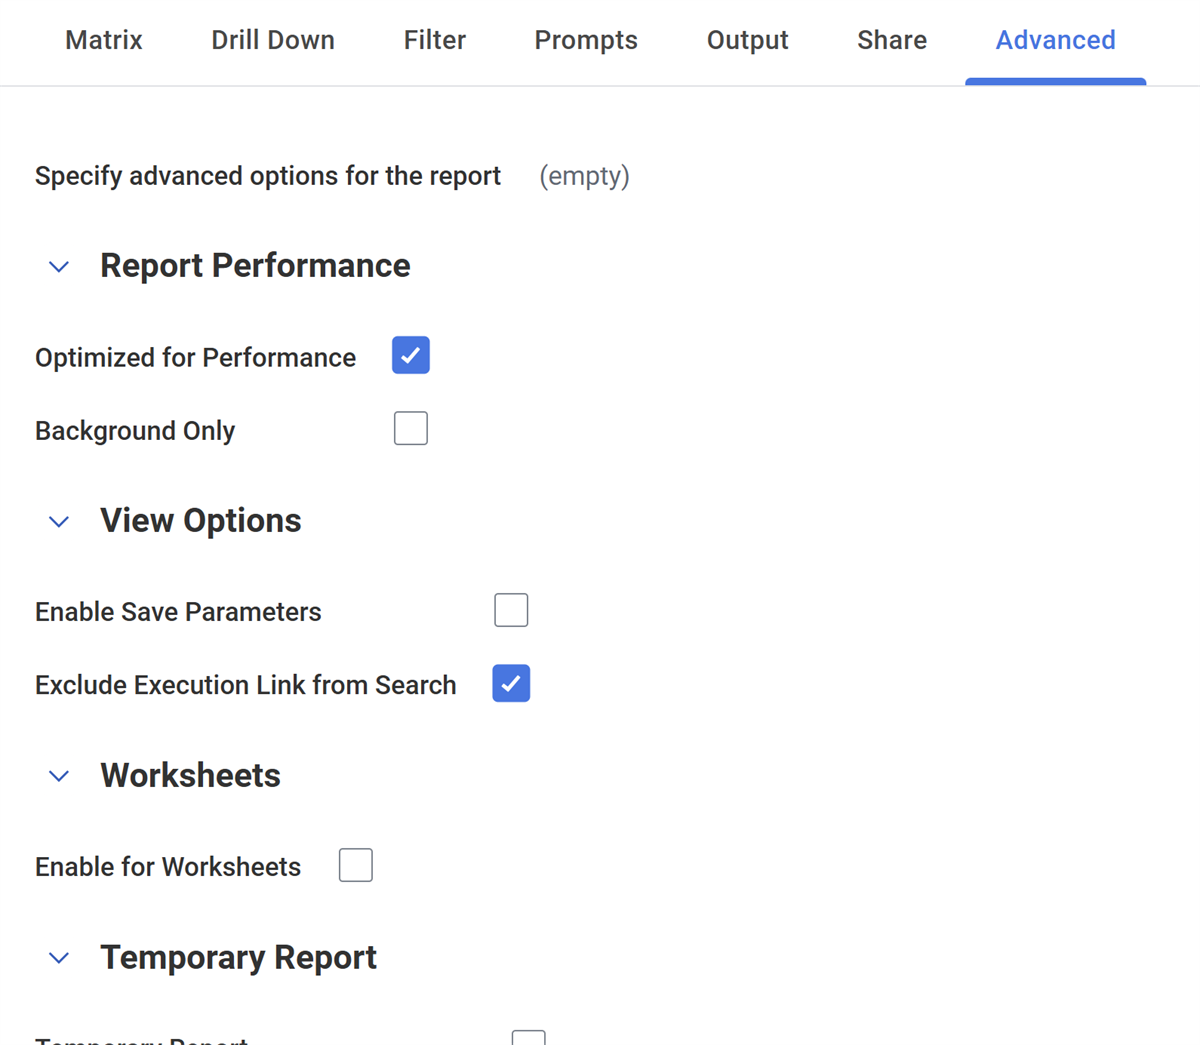
A best practice when working with subreports for composite reporting is to configure your subreport settings to exclude the subreport from global search results. Most subreports are not standalone reports. Instead, you create them to provide data for a composite report.
To exclude a subreport from the global search results, edit the subreport's report definition. Navigate to the Advanced tab and select the Exclude Execution Link from Search checkbox. This excludes the subreport from appearing in search results.
Documenting Your Reports
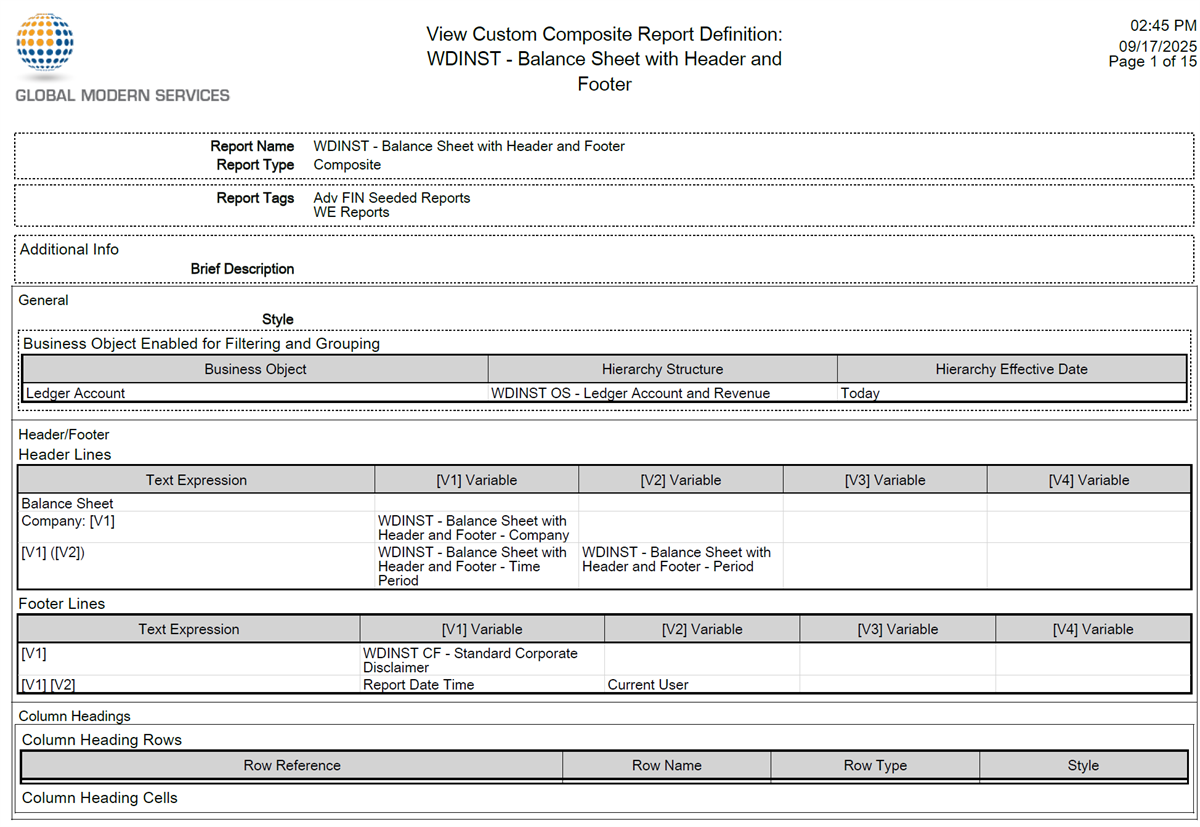
Workday Report Writer provides the ability to print documentation for your composite report. Once you print the documentation, you can send it to Excel or a PDF file.
You can print the report definition from the view mode for the report definition, or from the report output after it runs. Use the report's Related Actions and select the option to print.
The print of the definition will allow you to view the full details for all configurations. For example, once you print the definition, you can select the Columns tab to view details on all column configurations:
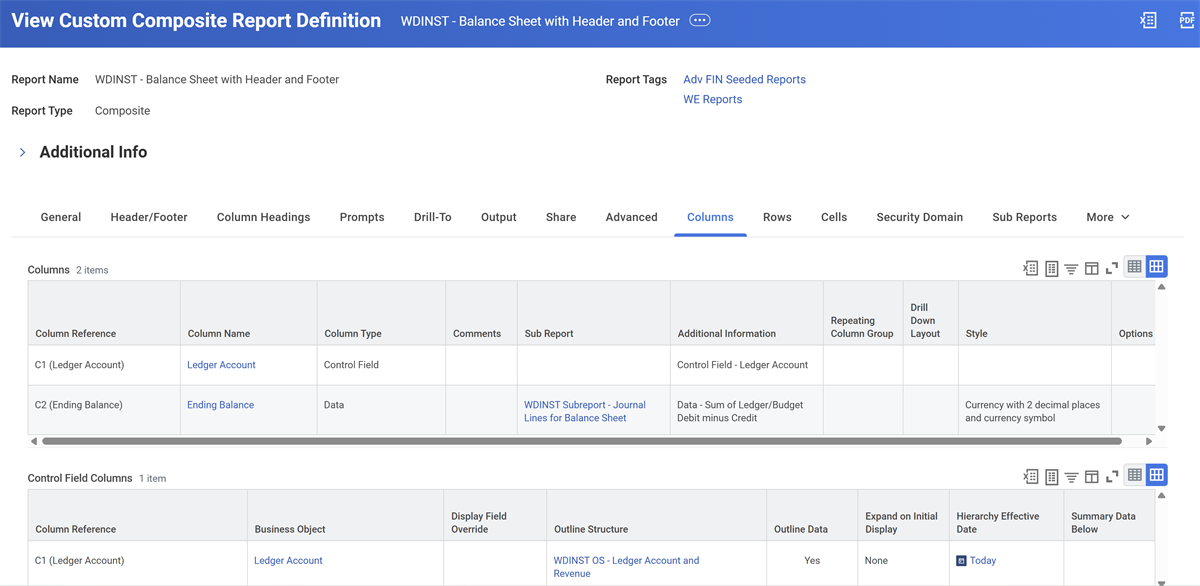
Working from the print view, you can access the subreports, make modifications, and take other actions from the output.
If you do not need to work on the definition in an interactive mode, you can output it to Excel or PDF for full documentation of the configurations.
Chapter Summary
- Composite reports allow you to pull the contents of multiple subreports into a single report.
- Those subreports can each have different data sources.
- Subreports use common control fields to unify them in the composite report.
- You can use subreports that use different data sources to join data in composite reports.
- You can use Advanced, Trending, or Matrix reports as subreports.