
Workday Reporting for Finance
Overview
In this chapter, you will become familiar with Workday Reporting for Finance. You will build a custom financial report using the Journal Lines data source. You will learn how to locate and run standard financial reports. In addition, you will become familiar with financial business objects and data sources. You will also create a custom reporting time period.
Objectives
By the end of this chapter, you should be able to:
- Build an advanced report using the Journal Lines data source.
- Define business objects and data sources specific to financial reporting.
- Access delivered financial reports.
- Create custom reporting time periods.
- Build a matrix operational report using a custom reporting time period.
Workday Reporting Concepts Review
Review the following reporting concepts:
- Reports in Workday
- Workday Standard Reports
- Report Types
- Reporting Terminology
Reports in Workday
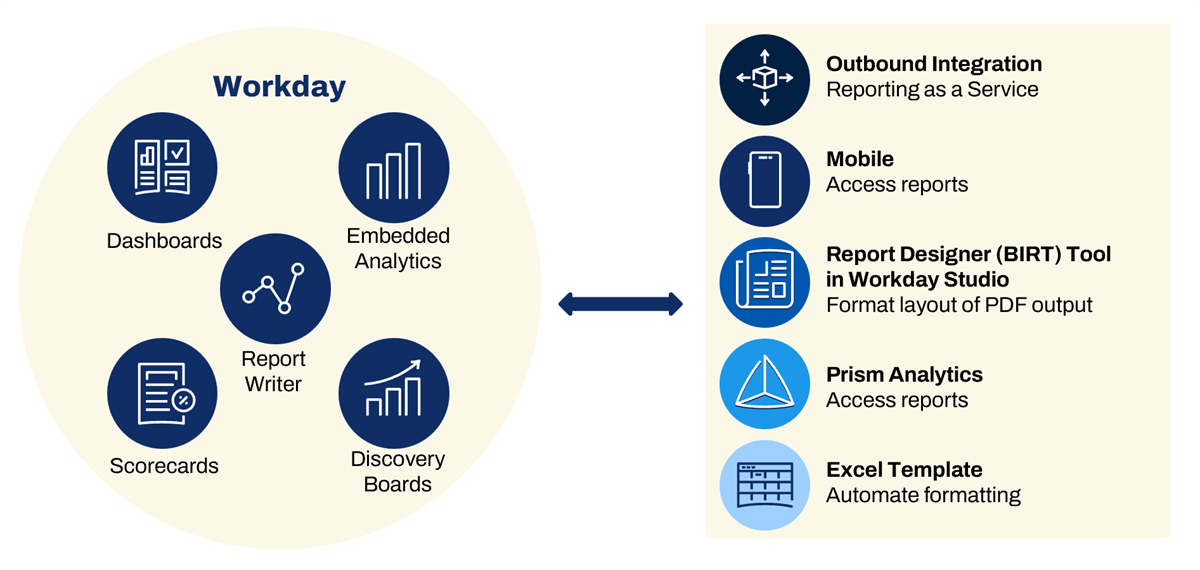
Reports in Workday are designed for the functional user and have an easy-to-use, consumer-friendly interface. Reports are built into the application, which allows users to act on the report output directly from the user interface. Because they are built in and not bolted on, reports in Workday also use your security configuration, which allows you to access real-time, relevant data.
You can build custom reports using the Report Writer tool. You can embed reports in your business process transactions to provide relevant data to make decisions. You can also enable reports as worklets and display them on dashboards. In addition, you can use scorecards to display a snapshot of important metrics for a specific organization over a particular period. These metrics are sometimes called KPIs (or key performance indicators).
You can use reports in outbound integrations (Reporting-as-a-Service) and access them from mobile devices.
Workday allows you to associate layouts with your custom reports, which it uses to generate PDF files. In Workday, these designs are known as business form layouts. You can define a business form layout using the Report Designer (BIRT) tool in Workday Studio.
You can use PRISM to analyze data from both Workday and external sources.
Workday helps you automate your Excel processing and formatting when exporting a Workday custom report. Excel templates reduce the time and effort needed to deliver Excel workbooks based on Workday custom reports, particularly when you export a report regularly and reformat the data in Excel. This feature supports any macros, calculations, and formatting you define in the associated workbook template.
Workday Standard Reports
Workday creates and delivers standard reports to all customers. Workday creates these standard reports using Report Writer and XpressO.
Report Type | |
|---|---|
Report Writer Reports |
|
XpressO Reports |
|
You can use the
Workday Standard Reports
report to view Workday-delivered reports. Below is a list of some of the key financial reports Workday delivers:
|
|
The
Workday Standard Reports
report is also a good starting point for creating custom Workday Financial Management reports. Run this report to determine whether reports are created by the Report Writer tool or XpressO. You can only copy or modify Report Writer reports. Using a report's Related Actions, you can copy the report to create a new custom report.Other benefits to using the
Workday Standard Reports
report include the ability to:- Determine whether a report is schedulable.
- Hide a report.
- View the domains that secure the report.
When you run this report, it asks you to select the category whose reports you want to list. You can select as many categories as you want.
Some common financial-related categories include:
- Business Assets
- Expenses
- Financial Accounting
- Financial Reconciliation and Close
- Revenue
Security Note
:- Workday security does not validate whether you have the proper permissions to access the standard report or the categories. All reports and categories are visible.
- You must have access to the Custom Report Administration security domain to run theWorkday Standard Reportsreport.
Below are the columns displayed in the report.
Column | Description |
|---|---|
Category | The category for the standard report. |
Report | Related Actions for the standard report. |
Name | Name of the standard report. |
Description | Description of the standard report. |
Type | The type of report, either XpressO or Report Writer. XpressO reports use a proprietary programming tool that provides special capabilities for building reports. You cannot copy or modify these reports using the Report Writer tool. Report Writer reports use the same Report Writer tool that is available to you. You can copy a Report Writer report, change it any way you want, and then save it. |
Schedulable | Indicates whether a report is schedulable. |
Domain | This column shows the domain name. You must have access to one of the security domains to run the report. |
Hide a Standard Report
After you copy a standard report, you may want to hide the original standard report so that you do not have two versions of the reports on:
- Menus.
- Related Actions menus.
- Scheduling options.
- Search results.
To hide a standard report, access the
Hide Workday Delivered Report
task.Note
: You cannot hide the report when Workday references it in another location, including integrations or scheduled report groups.Report Types
Report Writer provides the following report types for creating custom reports:
- Advanced
- Matrix
- Composite
- nBox
- Search
- Simple
- Transposed
- Trending
In this course, we will use the advanced, matrix, and composite report types. Below is a description of each type. Later, we will go through them in more detail.
Report Type | Definition |
|---|---|
Advanced | Advanced reports allow you to display data from the primary and related business objects. Advanced reports let you:
|
Matrix | Matrix reports form the foundation for custom analytics. It allows you to group data, summarize the metrics for each grouping, and drill into the summarizations for further analysis. |
Composite | Composite reports allow you to combine several existing matrix or advanced reports into one report. Each report is considered a subreport and can have its own data source. It also provides advanced formatting options. |
Reporting Terminology
Before you view or create financial reports in Workday, review the key terms and report components you will use.
Business Object
Workday stores data in business objects, which you can think of as database tables or worksheets in Excel. Just as a database table or worksheet has columns and rows, a Workday business object has fields and instances.
A primary business object (PBO) is the main business object for the report. It holds the data that will be displayed in your report. A related business object (RBO) is the object that is associated with the PBO. RBOs can have a one-to-one or one-to-many relationship with PBOs. A field on the PBO links the two business objects together.
Data Source
The report data source (RDS) provides a view into the primary business object (PBO). You can think of the data source as the starting filter for reporting on the given PBO. Choosing your data source is the first and most important step in developing a custom report.
Class Report Field
When working with Workday custom reports, you can select available fields called class report fields (CRFs). These fields can be Workday-delivered fields, calculated fields, or custom fields.
Class report fields can be simple types or object types. Simple types are not actionable and appear as black text. Object types are actionable and appear as blue text. Security controls access to class report fields.
The following table shows the field type icons and their definitions.
Icon | Definition |
|---|---|

| Text - Represents a simple text field, such as First Name. |

| Rich Text - Represents a rich text field, such as Overall Comment - Manager. |

| Numeric - Represents a numeric field, such as Employee Count. |

| Currency - Represents a currency field, such as Base Pay. |

| Date - Represents a date field, such as Hire Date. |

| Time - Represents a time field, such as End Time. |

| DateTimeZone - Represents a date and time (in a specific time zone) field, such as End Date/Time. |

| Boolean - Represents a True/False field, such as Active Status. |

| Single instance : Represents a one-to-one (1:1) relationship between two objects. For example, a Custom Report Definition can have only one Report Owner or one Created By Worker. |

| Multi-instance : Represents a one-to-many (1:M) relationship between two objects. For example, one worker can have multiple dependents. |

| Self-referencing instance : A reference back to itself. For example, a self-referencing instance of worker identifies the worker and allows you to drill into the details and access Related Actions. |
Instance
Instances of a business object in Workday are like rows in a table or spreadsheet. Each instance represents a unique occurrence of that type of object, such as a given organization or worker.
Securing a Report
Configurable security allows you to provide Workday system users with access to reports, tasks, and business process steps. Users gain access to these securable items via membership in security groups, which are given permissions to domain and business process security policies. You might be familiar with the following picture, showing the components of the configurable security framework:
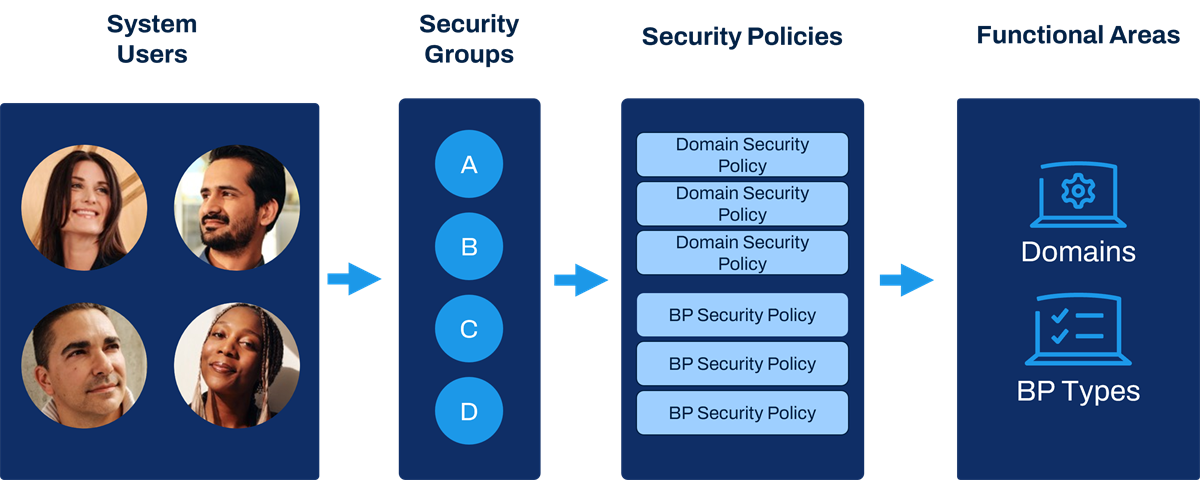
The Workday configurable security framework.
A security domain is a predefined set of related securable items that include reports, tasks, report fields, data sources, and data source filters. You cannot change the securable items that make up a domain.
Each domain has a domain security policy where you can add (or remove) security groups to give (or take away) access to secured items.
A security group is a collection of system users that have access to specific instances in Workday. Security groups are added to security policies to give members permissions to secured items in Workday, such as reports.
In this course, we will reference two types of security groups. The first is the report owner. When a user creates a custom report, they become the report owner. When the report owner selects the data source for the report that determines which domain the report is secured in. Ultimately this determines which security groups have access to that report.
The second security group is the group who controls all custom reports in the Workday tenant, the Report Administrator security group.
Using Report Tags
You can use report tags to easily categorize and find reports. When editing a custom report, you can create a new report tag by selecting Create Report Tag from the Report Tags field. When searching for a report tag name, all associated reports are displayed.
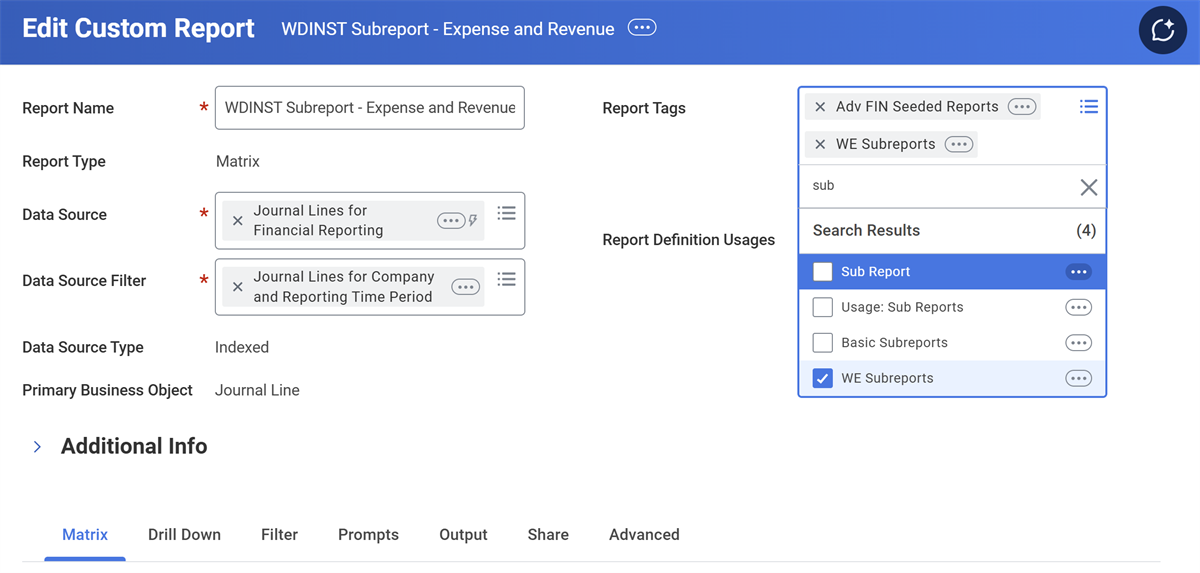
Use the "rdt" prefix to display only custom report definitions in the global search results.
Note
: To create report tags, a user must have access to the Report Tag Management security domain. When using report tags to find custom reports, users will only see reports of a given tag that are shared.Advanced and Matrix Reports
Advanced Reports
Advanced reports display fields from primary business objects and related business objects with advanced design options. Advanced report types offer a lot of functionalities while being relatively easy reports to create.
Some advanced design options include:
- Filtering
- Subfiltering
- Prompting
- Sharing
- Outlining
Advanced report results can display on charts and worklets with multiple headings and subtotals. Data from advanced reports can also be sorted and filtered.
Below is a list of common advanced reports for Workday Financial Management.
Report | Definition |
|---|---|
Find Journals | This report lists all the journals for a selected company, year, and period. |
Find Suppliers | This report allows you to find suppliers based on key supplier attributes, such as supplier name, ID, status, supplier category, supplier group, spend category, etc. |
Find Customers | This report allows you to find customers based on key customer attributes, such as customer name, status, customer category, customer group, payment type, payment terms, parent customer, etc. |
Find Payments | This report allows you to find payments based on key payment attributes, such as company, bank account, payment category, status, currency, payment dates, payment amount range, etc. |
Components of an Advanced Report
After selecting your data source, you can begin to build the other components of your report.
Tab | Definition |
|---|---|
Columns | The Column tab is where you select the fields to display on the output of your advanced report. The available fields depend on the business object for your advanced report. |
Sort | The Sort tab is where you can set the sort order for data groups. |
Filter | The Filter tab is where you can filter the data that displays on your report. |
Subfilter | The Subfilter tab allows you to further define filters for your report. |
Prompts | The Prompts tab is where you define what prompts the user will see at runtime. You can configure the default prompts for the business object selected. Use the Populate Undefined Prompt Defaults checkbox to populate prompt values. |
Output | In the Output tab, you can set up output display options. This includes help text, output types, time series, and worklets. |
Share | The Share tab has options to share your report. |
Advanced | The Advanced tab has some advanced report options. |
Sharing Reports
By default, custom reports are not shared. A custom report is visible only to its owner and users who have access to manage all custom reports.
The Share tab allows the report owner to share a custom report with authorized users. The domain securing the custom report's data source determines which security groups the report owner can share the custom report with.
You can share the report in different ways, such as:
- With all users who have access to the report data source and data source filter.
- With specific groups and users who have access to the report data source.
When you share a report with users, they can run the report but cannot edit the report. Only the report owner, and those who can manage all custom reports, can edit their own report.
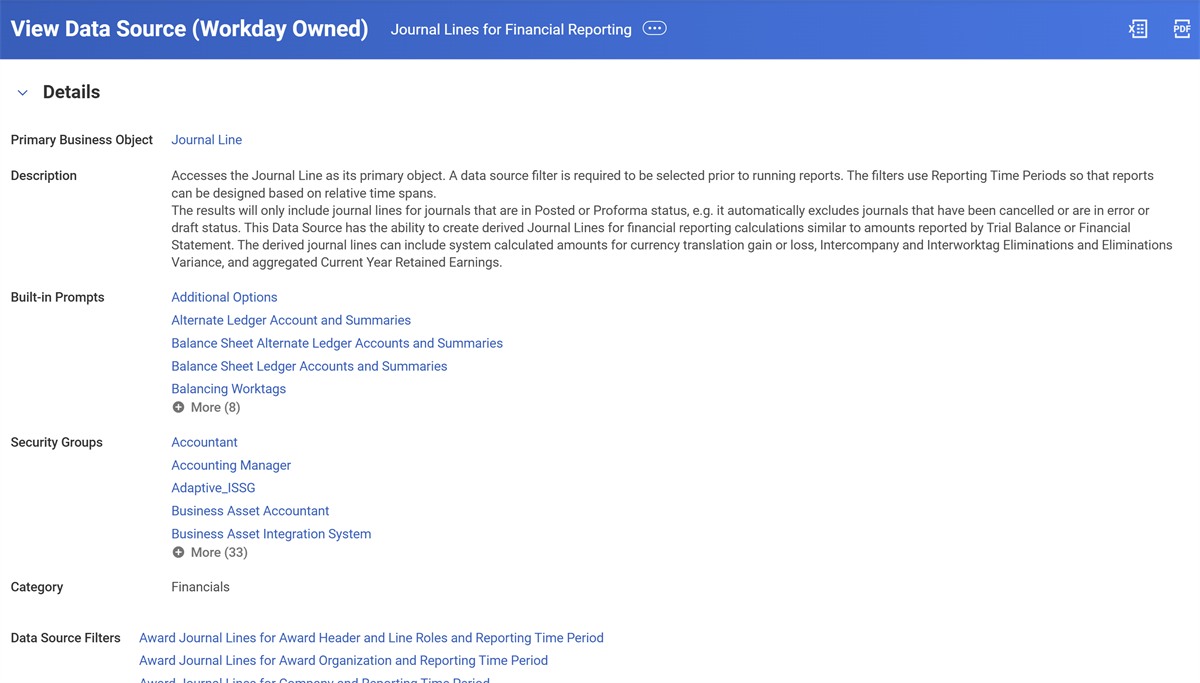
For financial reporting purposes, sharing the report with all authorized users will generally be the best choice. To verify which security groups have the appropriate access to view the report, you must check the allowed security groups for the data source. The image below highlights the security groups for the Journal Lines for Financial Reporting data source.
Matrix Reports
Matrix reports provide the foundation for custom analytics and interactive reporting in Workday. This report type allows for grouping, aggregation, and interactive drilling across different dimensions, enabling the user to gain new insights into the data and act on the results.
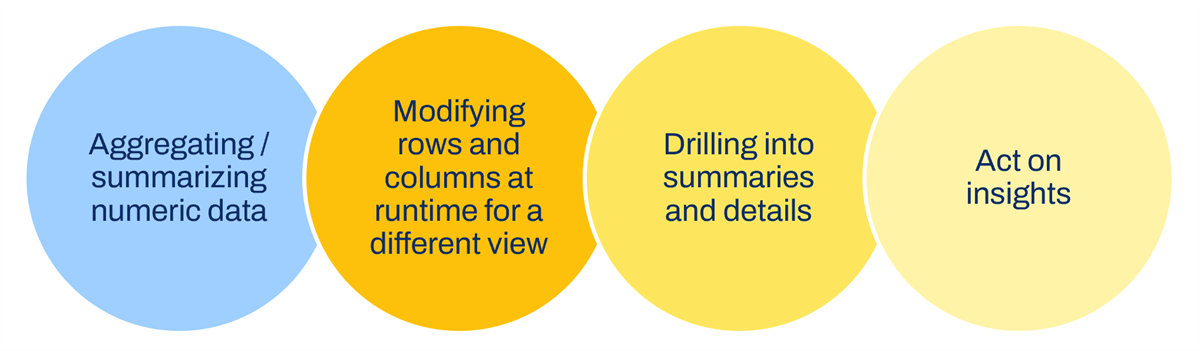
Matrix results can be displayed as a table or chart that you can drill into, enabling you to perform custom analytics and interactive reporting across dimensions.
Matrix reports are similar, but not identical to, pivot tables and crosstabs. You can group data by column or row and configure cells to display summary values where groupings intersect.
You can use matrix reports to:
- Explore data relationships to identify correlations.
- Identify patterns that could predict future behavior.
- Locate anomalies and exceptions and determine their cause.
- Show data in charts and graphs to find specific quantities and relationships.
- Validate assumptions about how your organization behaves.
Matrix versus Advanced Reports
The table below lists the main differences between advanced and matrix report types:
Advanced Reports | Matrix Reports |
|---|---|
Immediate access to detailed data | Summary view of data |
No need to drill down | Can drill down in specific results to access more information. |
Uses sorting and filtering to narrow results | Provides a clearer, more global summary of data |
Can return values on related business objects | Performs faster than advanced reports |
Using Worktags for Filtering
Worktags are a key aspect of financial reporting. They classify transactions and supporting data to make their business purposes clear. For financial reporting, they provide a simple method for accessing information, filtering searches to focus results, and analyzing data in aggregated and summarized reports. You can assign worktags to any line item that generates a financial update.
Resource
: Workday delivers many worktag types that you can use to tag your business transactions and supporting data. You can search Workday Community for "worktag types" to see a list of delivered worktag types.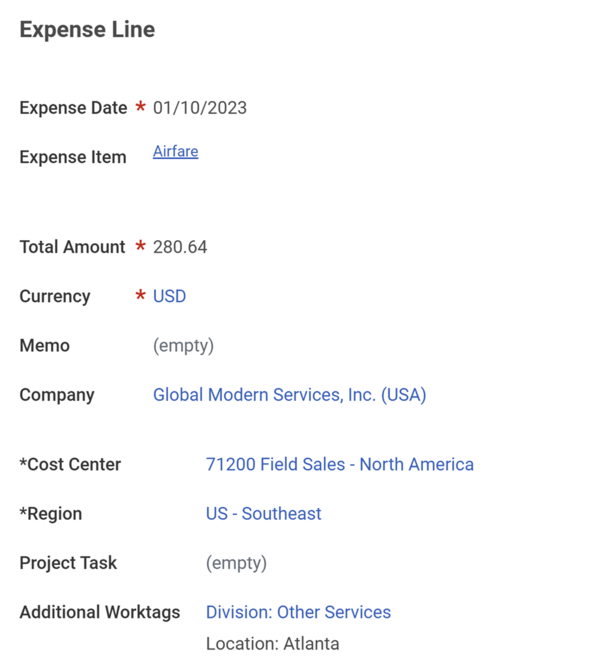
In the screenshot, each expense report line includes worktags that you can use to access and filter the data in a report. This expense report line contains worktags for Cost Center and Region, as well as several other worktags.
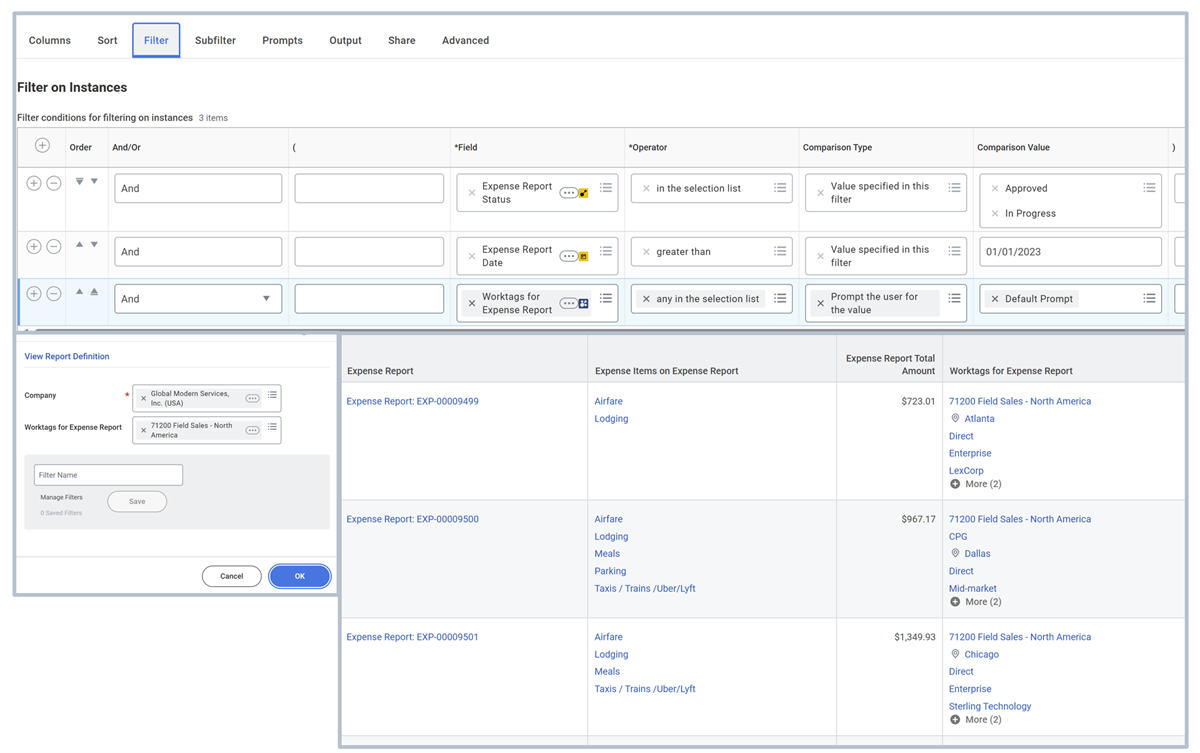
You can create a report that filters on worktag values. In the following screenshot, the report filters the data to show only worktags that contain the cost center 71200 Field Sales - North America.
Financial Reporting Business Objects
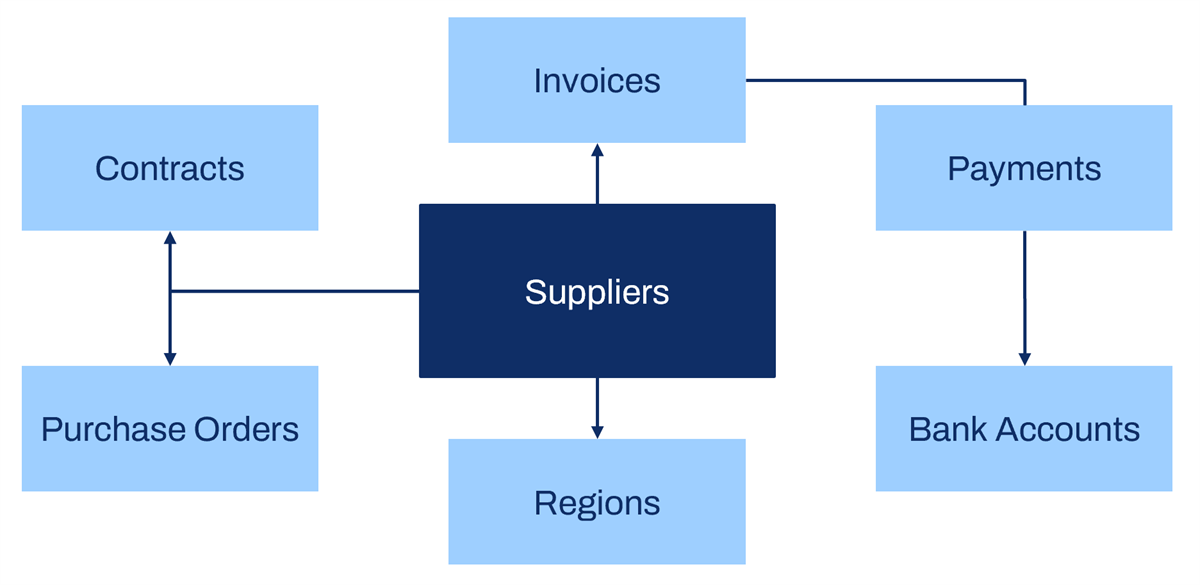
Workday stores finance-related data as business objects (e.g., organizations, suppliers, ledger accounts) in Workday fields and instances. Workday automatically links related business objects together. For example, a supplier is associated with supplier invoices, the invoice is associated with a supplier invoice payment, and the payment is associated with a bank account. In addition, the supplier is associated with contracts, purchase orders, and other related business objects.
Choosing a Data Source
The most fundamental step in building your custom report is to identify the data source that will provide the necessary data and suit your organization's security requirements.
Workday defines and delivers data sources. Workday delivers zero, one, or multiple data sources for business objects. The report data source is the view or selection of instances of a given primary business object; this is essentially the starting data for your report.
Except for composite report types, you must select a single report data source when creating a report. The report data source will determine the primary business object for your report and contain one row for each instance of the primary business object.
Review the
Data Sources
report to view a full list of data sources in your tenant. You can filter by category to view only data sources related to financial accounting, financials, and financial reconciliation and close, among others.In Workday, there are two types of data sources: standard and indexed.
Standard Data Sources
Most data sources in Workday are standard data sources. A given Workday business object can have several standard data sources associated with it, each representing a different filter or selection into instances of that object. Think of the data source as a starting filter. Choose the data source that returns the smallest dataset but still includes all the needed data. This is more efficient than using a data source that returns a larger dataset and applying filters to only display a subset of the data.
You will often find multiple standard data sources on objects where you may want to report on effective dated data. Effective dated data sources must be standard, so you will want to start with the smallest dataset possible. For most other objects, you will often find one standard data source and one indexed data source.
Indexed Data Sources
Indexed data sources are a special type of data source optimized for performance, aggregation, and faceted filtering on large volumes of data. It is recommended that you use these whenever possible to get the best-performing reports.
Just like with standard data sources, a given Workday business object can have multiple indexed data sources associated with it. Each indexed data source provides a different filter into instances of that object. For example, the Journal Line business object has two indexed data sources: Journal Lines and Journal Lines for Financial Reporting. The Journal Lines data source will return more instances than the Journal Lines for Financial Reporting data source.
To gain the performance benefits of indexed data sources, use indexed delivered fields. You can use nonindexed fields, but these will not let you realize all the benefits of indexing. Additionally, fields may be indexed for different purposes. The biggest impact to performance would be using a field for grouping, aggregation, or filtering that is not indexed for those purposes. Nonindexed fields in detailed reporting do not have as great an impact to the overall performance.
Data Source Filters
When you create a custom report based on an indexed data source, Workday prompts you to select from a list of predefined data source filters, if available. A data source filter can limit or reorganize the data returned in your report. Data source filters are secured so users will only be able to use filters to which they have access.
Use a data source filter's Related Actions to view a description of the data source filter, along with the data source and security information. These descriptions will tell you if the data source filter includes additional prompts. In addition, they will often include tips on how the data source filter would best be applied.
Data Sources and Financial Reporting
Workday delivers many data sources optimized for financial reporting. Below is a list of data sources, their primary business objects, and data source filters frequently used in financial reporting.
Report Data Source | PBO | Type | Filter | Usage |
|---|---|---|---|---|
Journal Lines for Financial Reporting | Journal Line | Actuals | Journal Lines for Company and Reporting Time Period | Company-based Financials Reports, such as Balance Sheet or Income Statement based on Legal Entity. |
Journal Lines for Organization and Reporting Time Period | Organization-based Financials Reports, such as a P&L Report for Cost Center Managers. | |||
Journal Lines for Project and Reporting Time Period | Project-based Financials Reports secured by Project Roles | |||
Project Journal Lines for Company and Reporting Time Period | Project-based Financials Reports secured by Company Roles | |||
Plan Lines for Financial Reporting | Plan Entry Line | Plan | Budget Lines for Company and Reporting Time Period | Company-based Financials Reports, such as Balance Sheet or Income Statement based on Legal Entity. |
Budget Lines for Organization and Reporting Time Period | Organization-based Financials Reports, such as a P&L Report for Cost Center Managers | |||
Budget Lines for Project and Reporting Time Period | Project-based Budget Reports secured by Project Roles | |||
Project Budget Lines for Company and Reporting Time Period | Project-based Financials Reports secured by Company Roles | |||
Statistical Lines for Financial Reporting | Statistic Line | Statistics | Statistic Lines for Company and Reporting Time Period | Use to pull statistical information into your Company-based Composite Reports |
Statistic Lines for Organization and Reporting Time Period | Use to pull statistical information into your Organization-based Composite Reports | |||
Workers by Company for Financial Reporting | Worker | Headcount | Company-based Headcount Reports | |
Supplier Invoice Lines | Supplier Invoice Line | Various | ||
Purchase Order Lines | Purchase Order Line | Various | ||
Customer Invoice Lines | Customer Invoice Line | Various | ||
Revenue Recognition Installment Lines | Revenue Recognition Installment Line | Various |
You will notice that some data sources have "Lines" at the end of them, such as Journal Lines. The difference between the Journals data source and the Journal Lines data source is that the Journal will report on header data. However, Journal Lines will show more detailed information about each line of data that make up that header information.
Data sources that end in "for Financial Reporting" are used for subreports in composite reporting.
Journal Lines for Financial Reporting
Use this RDS primarily when you create subreports that focus on actuals data for composite reports. This data source provides:
- Greater reporting flexibility in using reporting time periods.
- Specifying amount types (such as beginning balance, activity, and ending balance).
- Reporting on elimination entries, currency translations adjustments, and retained earnings.
This data source can create derived Journal Lines for financial reporting calculations similar to amounts reported by the
Trial Balance
or Financial Statement
reports. The derived journal lines can include system-calculated amounts for currency translation gain or loss, Intercompany and Interworktag Eliminations and Eliminations Variance, and aggregated Current Year Retained Earnings. The derived journal lines are for reporting only and do not create actual journals.Plan Lines for Financial Reporting
Use this RDS primarily when you create subreports that focus on budget data for composite reports. This data source provides greater reporting flexibility in using reporting time periods and specifying amount types (such as beginning balance, activity, and ending balance).
Statistic Lines for Financial Reporting
Use this RDS primarily when you create subreports for statistic reporting in composite. This data source provides greater reporting flexibility in using reporting time periods and specifying whether to calculate missing balances for balance-based statistic definitions.
Copying a Standard Report
Workday offers a large selection of standard delivered reports in your tenant. If none of these reports meet your needs, rather than writing a report from scratch, you can copy the report and modify it. For example, you may want to copy a standard report if you wish to add fields or update the prompts in the report.
Note
: You can copy Report Writer reports and then edit the copied version. You cannot, however, copy or edit XpressO reports. You also cannot tie XpressO reports back to a reporting data source.You can run the
All Custom Reports
report to access the list of custom reports in your tenant, including the reports you copied. However, to view the custom reports in your tenant that are marked Temporary, you must select the Is Temporary checkbox.Reporting Periods
Reporting time periods define the years and periods that you can use to report on financial, award, and project transactions. You can create time periods relative to the report time or use specific years and periods. Use reporting time periods to build predefined profiles for financial and award statements.
Workday delivers various common reporting time periods. You can use any Workday-delivered time periods in a financial statement profile or define your own fiscal or award time periods.
Note
: To create new time periods, use the delivered time periods as examples. Run the View Reporting Time Period
task.Fiscal Schedules
You can review the available fiscal calendars for your organization using the
View Fiscal Schedule
task.Workday supports different fiscal calendars based on industry requirements. Fiscal calendars can be a calendar year or any dates that you select.
If you have security permission to run the
Create Fiscal Schedule
task, you can build and maintain fiscal schedules and fiscal years. Your business can use and share these for financial accounting and reporting purposes.Example
: Sectors such as retail, hospitality, publishing, and manufacturing frequently use a 4-4-5 accounting calendar structure. This fiscal calendar divides a year into four quarters of 13 weeks, each grouped into two 4-week months and one 5-week month. You can set up the grouping of 13 weeks as 5-4-4 weeks or 4-5-4 weeks.Delivered Reporting Time Periods
You can review a list of Workday-delivered reporting time periods using the
View Reporting Time Period (Workday Owned)
report. The resulting report displays a definition of the selected reporting time period.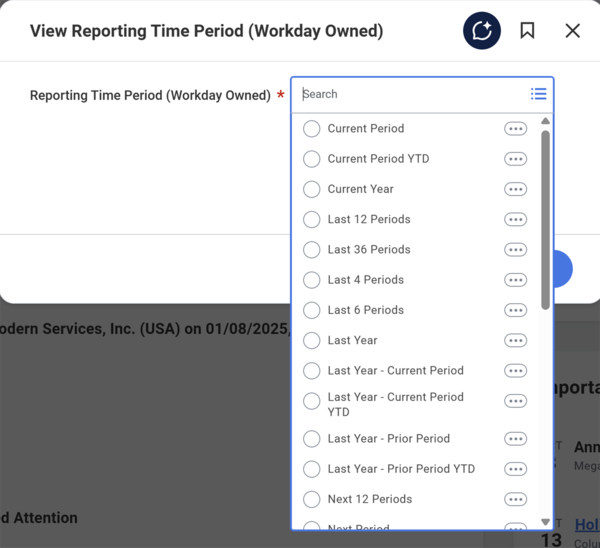
Custom Reporting Periods
Use the following steps to create a new reporting time period:
- Access theCreate Reporting Time Periodtask.
- Enter a name for the reporting period.
- Select a Schedule Type. The default selection is Fiscal, which allows you to view and set options specific to the fiscal period or summary schedule. Select a fiscal, award, or project schedule.
- Complete the task and select OK. As you complete the task, consider:
Field | Description |
|---|---|
Fiscal Schedule | Set this field to use a specific fiscal year or period. |
Summary Schedule | Select a summary schedule if you plan to use a summary period. The summary schedule can be specific or relative to the report run date. |
Inactive | To override the default tenant time period, select the Inactive checkbox. |
For the Year and Period sections, consider:
Field | Description |
|---|---|
Use Report Run | Base the reporting time on the period you select at the time of the report run. You can further adjust this time by using the Add or Subtract option.
For a reporting time period following a fiscal schedule, you can clear this checkbox to select a specific fiscal year, period, or summary schedule. |
Add or Subtract | Use this option to move the reporting year or period backward or forward relative to the report run period. If you specify a negative number, the reporting time period will move to the specified number of periods before the report run period. If you specify a positive number, the reporting time period will move to the specified number of periods after the report run period. You can only set this field when you select the Use Report Run checkbox. Example : To create a time period for the previous year of the report run period, under Year, enter -1. |
Use Specific |
If you select Use Report Run for year and Use Specific for period, the reporting time period will cover the specified period during the report run year. This option is only available for the fiscal schedule reporting time. |
For the Periods to Include section, consider:
Field | Description |
|---|---|
Periods to Include | Enter the number of fiscal, award, or summary periods up to and including the report run or specified period. Example : Enter 4 Periods to Include to return a full-year quarterly report when using a quarterly fiscal or award summary schedule. |
Year To Date or Award Year To Date | Select to include cumulative activities for all periods, from the beginning of the fiscal or award year, to the report run or specified period. Clear to include activities from only the specified period. |
Year From Date | For fiscal schedules, select to include cumulative activities from the period after the report run or the specified period to the end of the fiscal year. If you select a summary period, this option will report from the next summary period. If you do not select a summary period, this option will report from the next month. |
Plan to Date | Select to include plan activities from the inception of the fiscal financial plan to the report run or specified period. |
Award Life to Date or Project Life to Date | Select to include activities from inception of a project or award to the report run or specified period. |
Grant Life to Date | Select to include grant activities from the inception of a fiscal schedule grant to the report run or specified period. |
Summary Schedule to Date | Select to include all periods in the summary schedule up to and including the report run period, for all years. |
Include all Periods in Previous Summary Schedules | Select to include all periods in the previous summary schedule up to and including the report run period, irrespective of the year. |
Include Periods Based on Period Selection in Summary Schedules (To Date) | Select to include all periods in the summary schedule up to and including the report run period, for all summary periods in the report. |
Summary Schedule from Date | Select to include all periods in the summary schedule that occur after the report run period, for all years. |
Include all Periods in Future Summary Schedules | Select to include all periods in the summary schedule that occur after the report run period, irrespective of the year. |
Include Periods Based on Period Selection on Summary Schedules (From Date) | Select to include all periods in the summary schedule that occur after the report run period, for all summary periods in the report. |
Note
: You need to have the security permission for the Reports: Financial Accounting domain in the Financial Accounting functional area. Lookup Date Rollup Calculated Field
The Lookup Date Rollup calculated field aggregates, groups, or summarizes data for a time period, fiscal schedule, or weekly schedule. It looks up dates in Workday and displays the value in the format you specify.
Example
: You can use the Lookup Date Rollup calculated field to have Workday return:- 2025-Q1 as the fiscal year-quarter rollup format for the date 01/01/2015 in a fiscal schedule or period.
- The week-end date so you can use it as the repeating field in a repeating column group in a composite report.
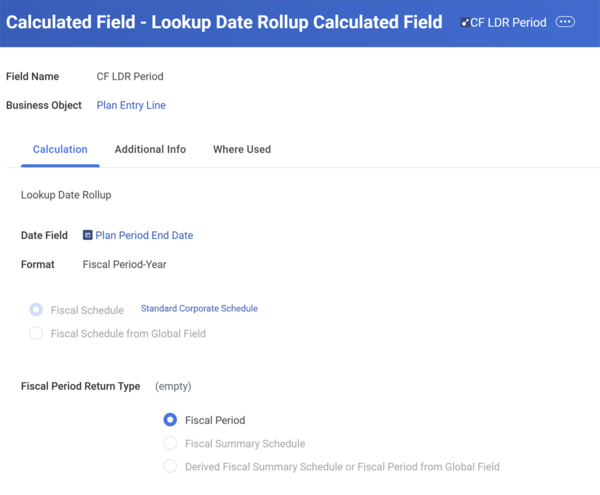
A Lookup Date Rollup calculated field is similar to a Format Date calculated field. The main difference is that a Format Date calculated field results in a Text type field while a Lookup Date Rollup calculated field results in a single instance. If you need to express a date as a period, a Lookup Date Rollup calculated field is the better choice because it enables you to select specific periods when filtering (as opposed to needing to type out the value). If you need to add a Repeating Column Group to a composite report, use a Lookup Date Rollup calculated field because a repeating column group requires a single instance field.
Note
: Workday does not support Lookup Date Rollup calculated fields on the discovery board sheet and visualization filters or the Report Writer filters.Chapter Summary
- You can run theWorkday Standard Reportstask to find Workday-delivered reports. With the report output, you can:
- Filter by Report Categories to view financial reports.
- Narrow results by downloading and filtering output columns.
- You can run theAll Workday Delivered and Custom Reportsreport to view all reports in the tenant.
- You can copy and modify standard reports as a starting point when creating custom reports.
- Reporting time periods define the years and periods that you can use to report on financial, award, and project transactions.