
Composite Report Formatting and Output
Overview
Now, you can construct a basic financial statement, add data complexity by adding multiple data sources and control fields, and fine-tune your data using filters and prompts. Next, let us learn how to add formatting to your report to further enhance the user experience.
Workday enables you to customize your reports by adding analytic indicators and charts. Additionally, you can customize report headers and footers as well as create complex column headers.
Objectives
By the end of this chapter, you will be able to:
- Identify the different types of analytic indicators and charts available when building a composite report.
- Add custom headers and footers to a Balance Sheet.
- Configure custom column headers to a composite report.
Analytic Indicators
You can apply analytic indicators to composite reports. Analytic indicators behave the same way for composite reports as they do for matrix reports, with a few exceptions.
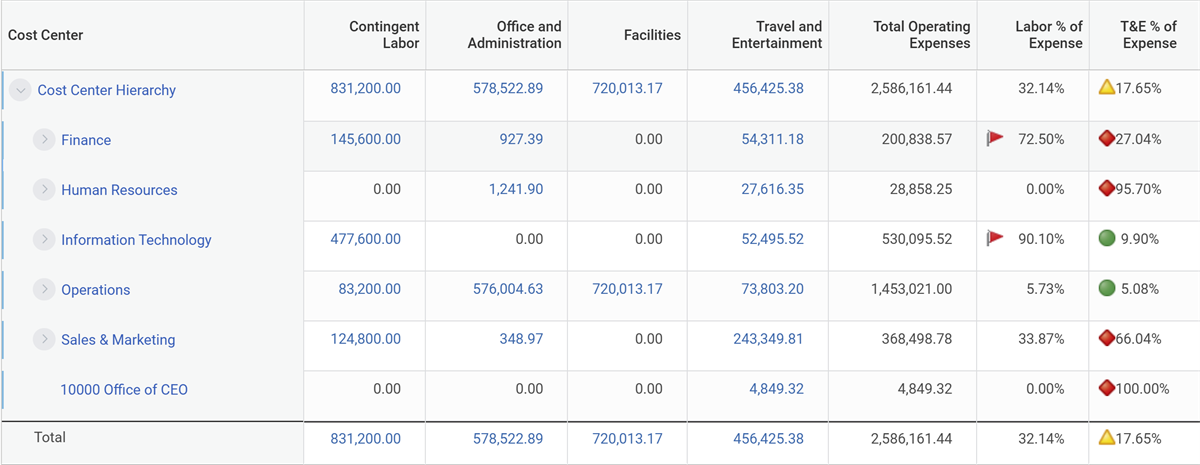
To create a new analytic indicator for a column, first edit the report. You can find the option to create a new indicator within the Options field.
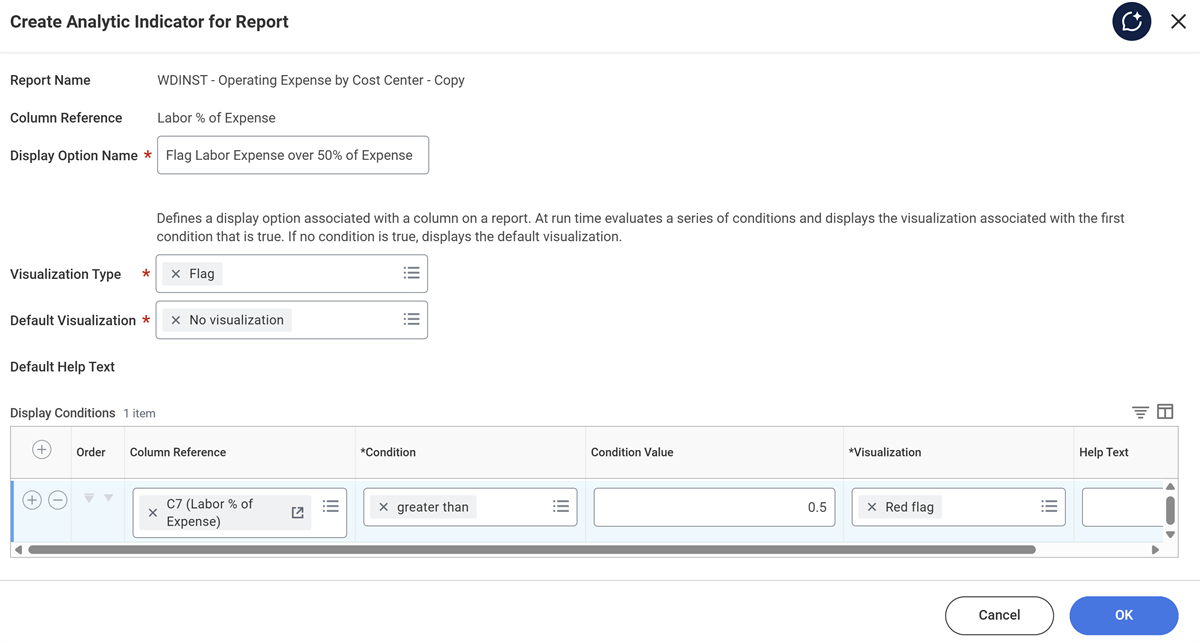
Within the Create Analytic Indicator for Report window, you can define:
- The name of the Analytic Indicator option. You can reuse column options in other columns.
- The type of option to use. You can find a list of options and a few examples in the next topic.
- The default visualization for your data.
- Any exceptions to the default, including how to visualize each exception.
Note
: You can opt to show the analytic indicator option only by defining both the indicator and selecting the Show Icon Only option in the Options field.With composite reporting, you cannot use system-wide analytic indicators: they can only be report-specific.
Visualization Definitions
Several visualization types are available:
Visualization Type | |
|---|---|
Flags allow the user to configure the meaning of each flag color in the custom report. | 
|
Trend arrows visually highlight data that exceeds or falls below specified limits. | 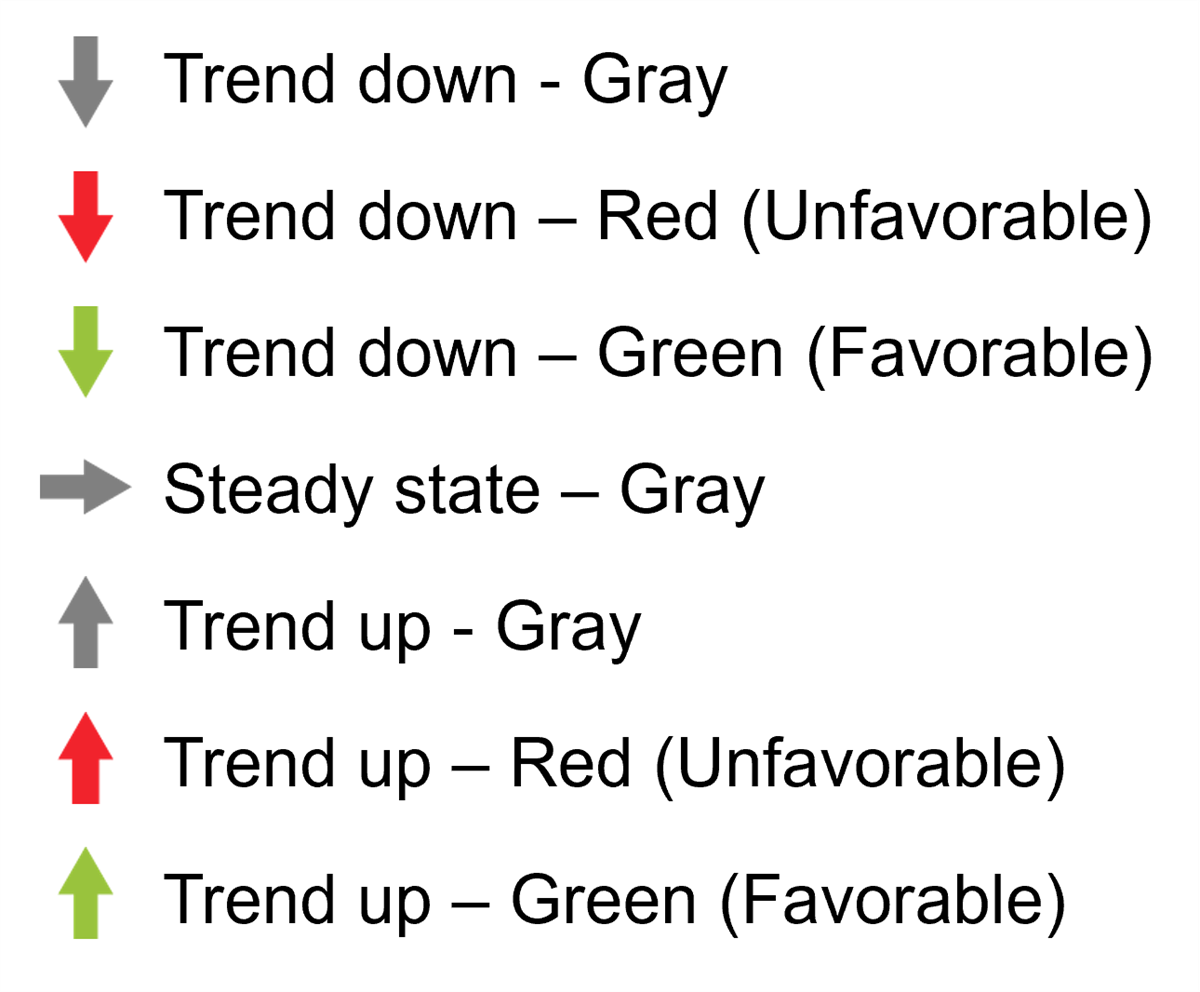
|
Progress Bar | 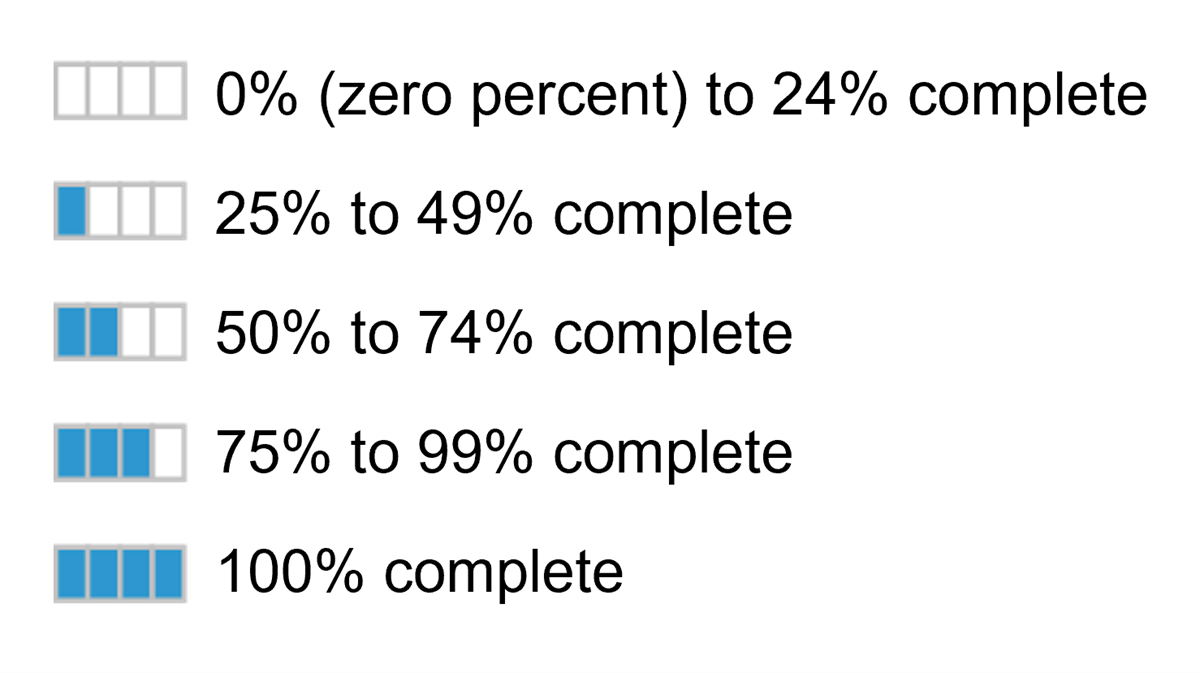
|
Checkmark or X represents true/false values. | 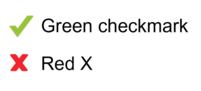
|
Status demonstrated as green, yellow, or red; or use a star-rating based on five stars. | 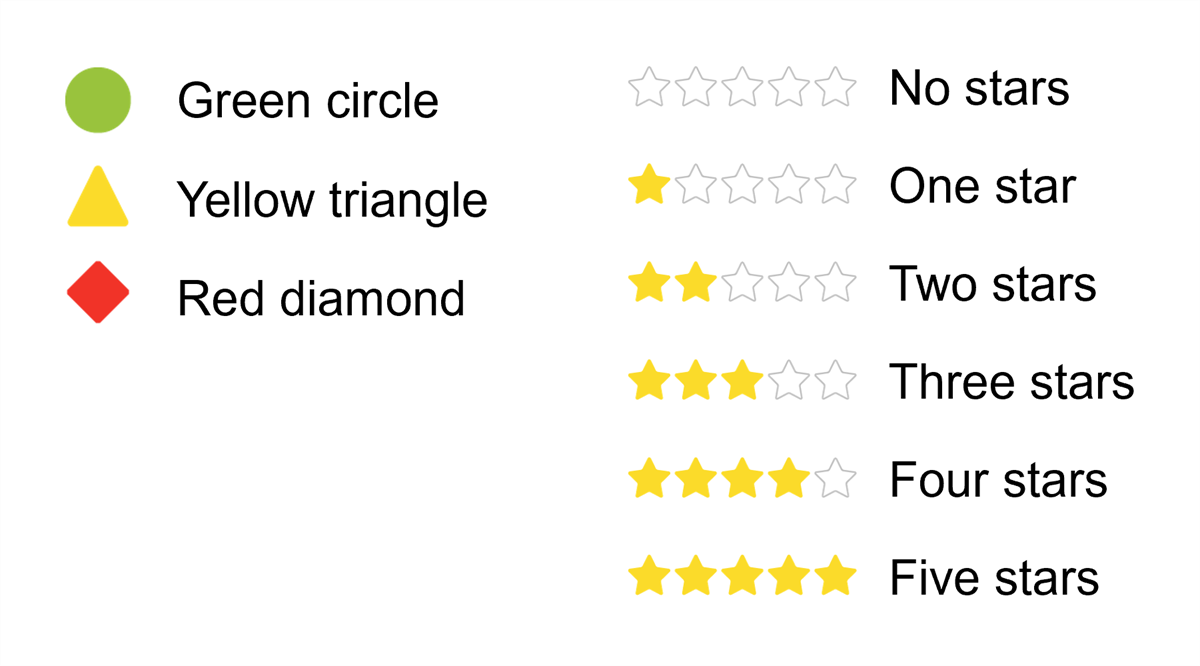
|
nBox | 
|
Composite Charts
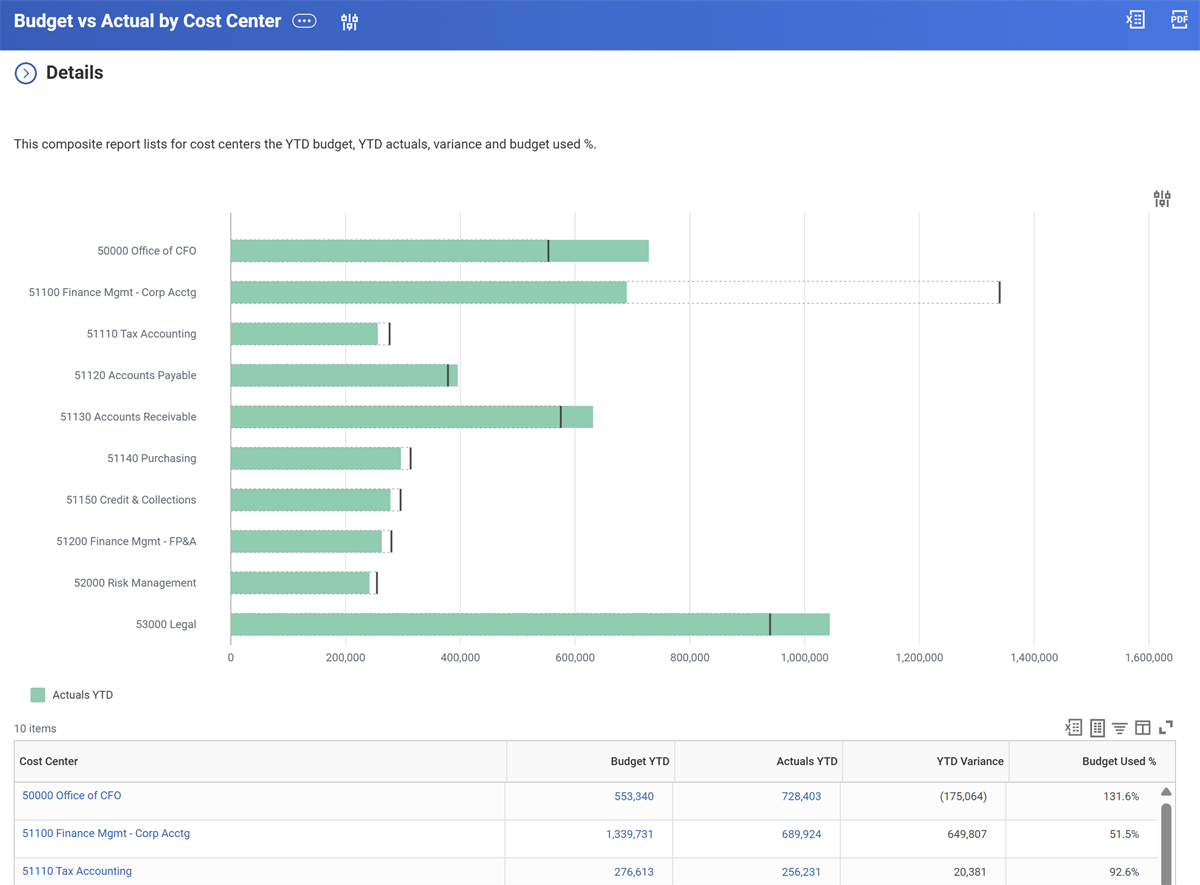
Output options for composite reports include the ability to display the output as a table, chart, chart and table, and layout. You can enable scorecard to use the layout output type.
Note
: We do not cover scorecard functionality in this class. For more training on scorecard, refer to Workday
Community documentation and the training catalog on Workday Community.You already know how to configure a composite report to the table output.
The steps to define output as a chart are:
- From the open composite report, select the Report Settings icon (gear icon).
- Navigate to the Output tab.
- Define the Output Type as Chart or Chart and Table.
- Define the Chart Options.
As you configure your chart, you will consider these options:
- Chart Type: Column, Bar, Line, etc.
- Top n Fields and Values and if you sum the remaining values.
- Target Line Options
- Axis Scale Options
- Advanced options for defining Horizontal and Vertical Axis and if you want to suppress the display of chart totals and the chart legend.
There are some limitations to this configuration. To render a composite report as a chart, the report definition must not contain:
- Column Outlining
- Conditionally hidden columns or rows
- Repeating column groups
Headers and Footers
Headers
There are a few options available to include header information in your report.
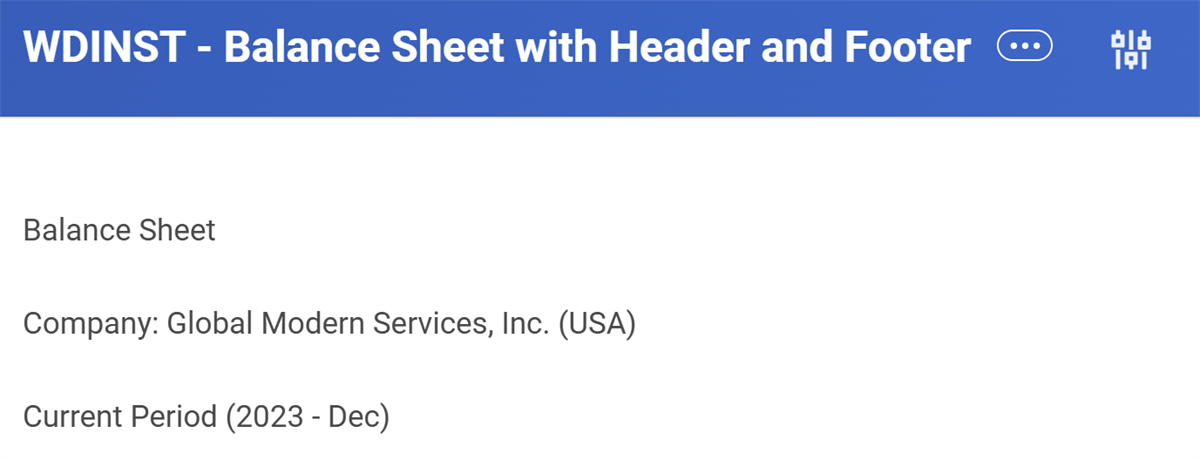
- Display the prompt selections at the top of your report. This requires no additional configuration if you set up the report to display prompts. This option lists the fields and values that you select before running the report.
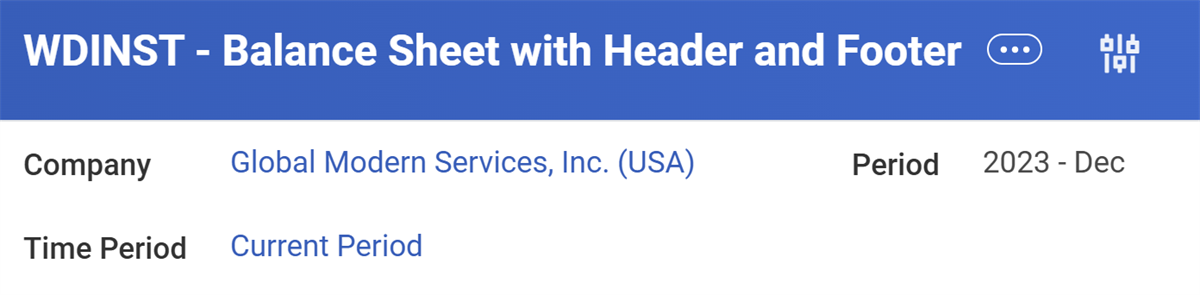
- Display custom header information at the top of your report. This allows you to customize the wording that displays in the header and uses variables to populate values into that header.
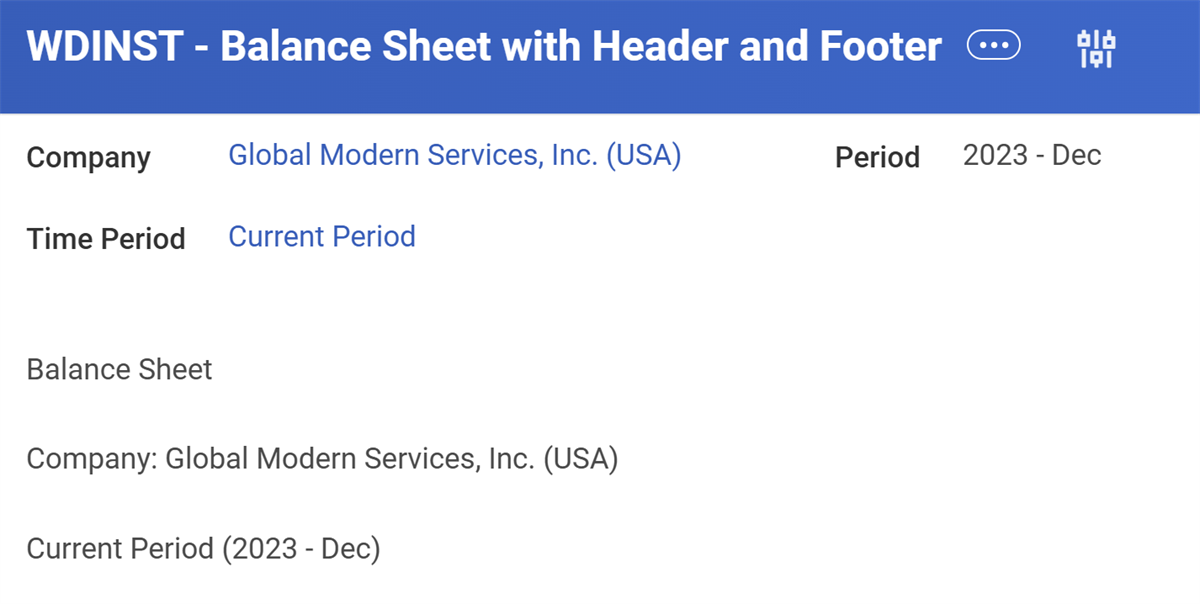
- Display both prompt selections and custom header information. This allows you to display both the report prompt information, as well as any custom header information.
Footers
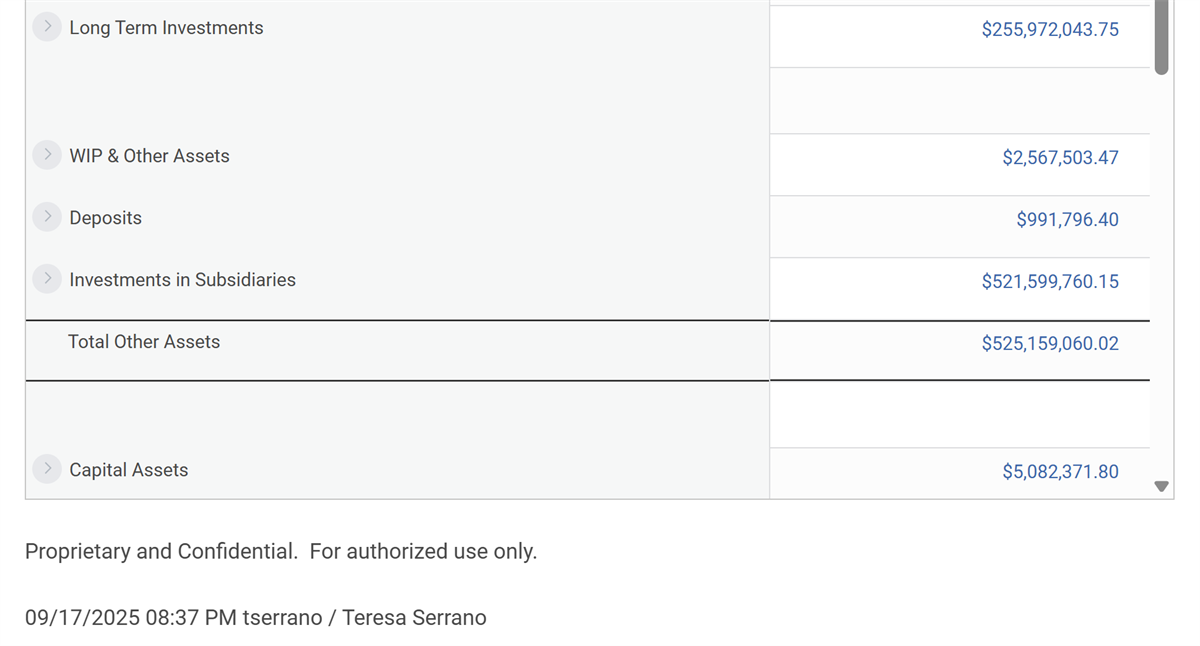
You can only configure footers through the Report Settings window. They are displayed at the bottom of your report.
Configuring Headers and Footers
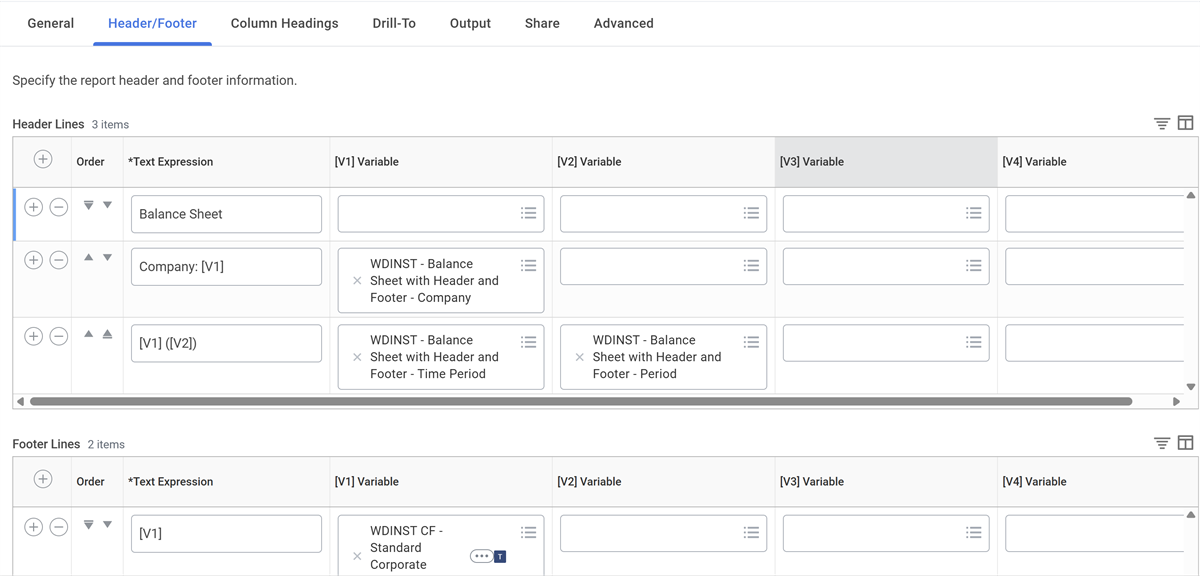
You can define headers and footers in a composite report as text, variables, or a combination of both. You can also specify the order in which you want the header and footer lines to appear.
Defining Text and Variables
Defining a text-only line in the header or footer section is easy. Enter the text into the Text Expression field as you want it to appear on the report.

Custom Variables
You can define up to four different variables in a single header row. You can add several different report variables:
- Report Time
- Report Date Time
- Report Name
Additionally, you can also use any of the promptable values within the Report Settings or create your own data column field variable. If you create a data column field variable, you can access global variables like Current User for inclusion in your headers and footers.
To define variables, add the variable prompt in the Text Expression box and identify the specific variable to use in the variable field. For example, for the report name to appear in the header, add [V1] into the Text Expression field, and the Report Name variable into the [V1] Variable field.

Note
: The variables in the Text Expression box are case-sensitive. Make sure to enter [V1] and not [v1].Combining Text and Variables
You can also display a combination of customized text and specific variables in a header or footer row. For example, to add the text "Company:" before the Company variable, your Text Expression would match the image below. The [V1] variable populates with your Company report prompt.

Column Headings
When you define configurable columns, the column name is what appears on the report. With column headings, you can customize columns with variables to give more meaning to the data, e.g., Revenue as of 2021 - Dec instead of just Revenue.
You can configure the column headings from the Column Headings tab seen in the image below.
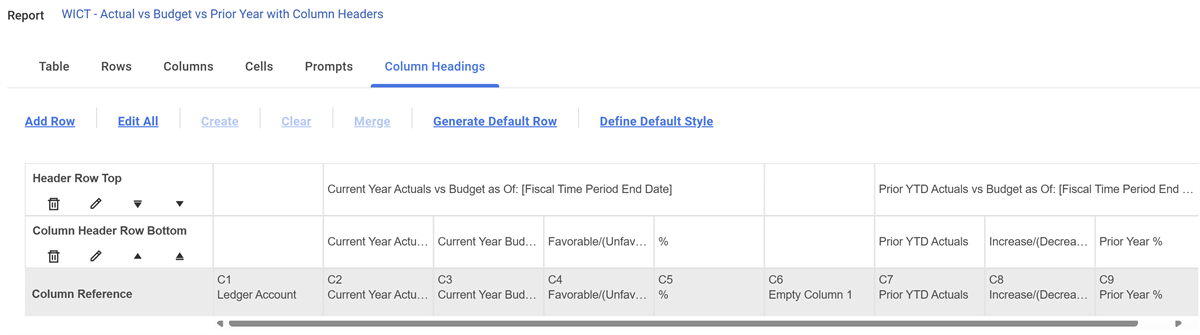
Select the
Generate Default Row
to generate a top row to edit column headings for every column.Use the
Add Row
button to add additional column headings. Selecting the Add Row button will generate another row above the top most row and all cells will be blank.Select a
Cell
and select Create
to open the Edit Header Cell window as seen in the image below.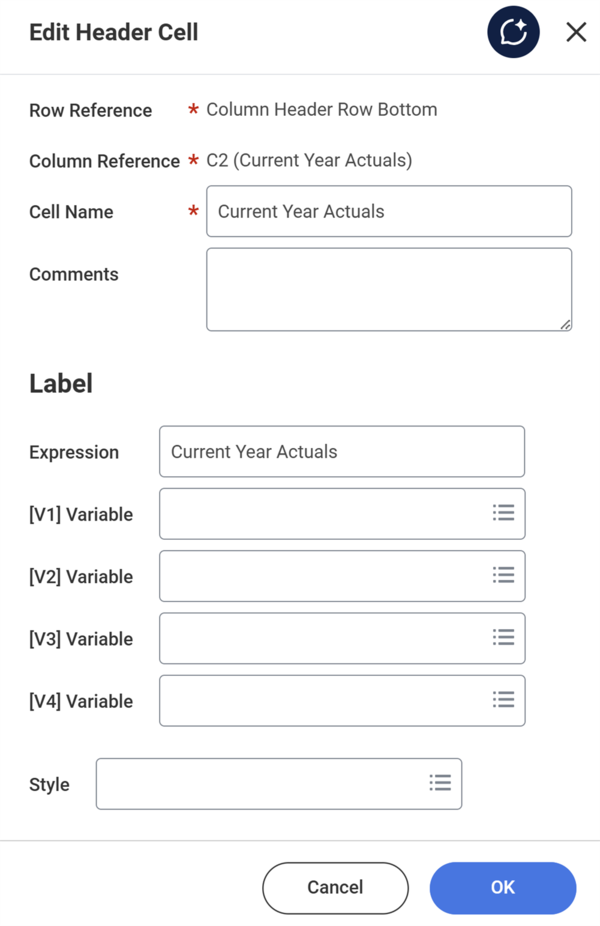
Select multiple cells by holding down the shift key, then selecting the
Merge
button. This will merge those column headings together and open the Edit Header Cell window for that group of columns.Select
Edit All
to open the Edit All Header Cells window as shown in the image below. Here you can edit the header cells in a table format.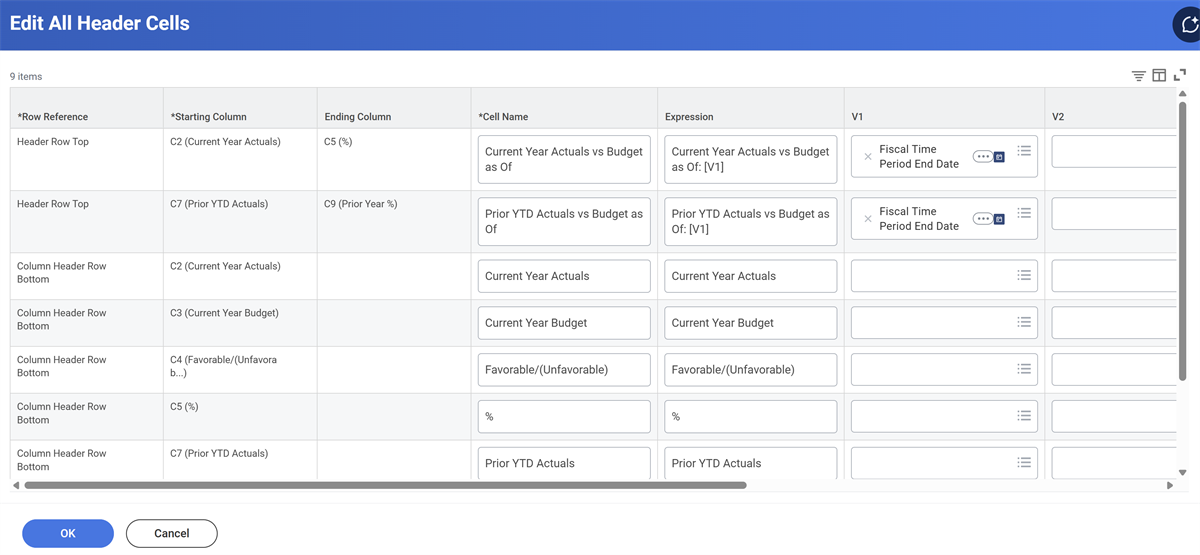
Select
Define Default Style
to apply styles to your column headers. Any styles you apply to the column headings apply to the column heading rows. You can also define a different style for the individual column heading cells. By default, when outlining, the column headings are not centered. To center the column headings over the column, apply the Workday-delivered Column Headings style.Report Sharing
You can share a composite report with other authorized users in the system. To share composite reports with others in your organization, you must share the composite report and all of its referenced subreports.
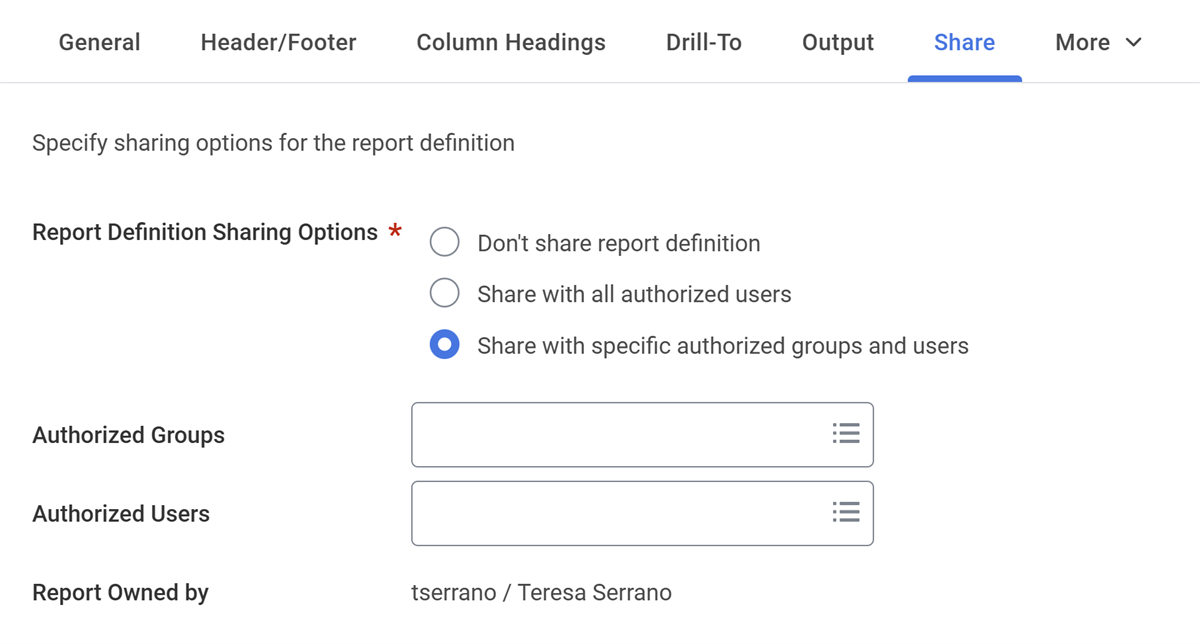
Note
: To share a report definition with a security group, that security group must have access to both the report data source and data source filter.Report access, however, does not necessarily mean you have access to the same instances of data. A user running a shared report will view the report results based on their own security access to the data source, data source filter, and report fields.
Chapter Summary
- Analytic Indicators help visually categorize and represent data.
- You can use charts to visually enhance your reports and enable them as worklets to add to dashboards or scorecards.
- To share composite reports with other authorized users, you must also share subreports.
- You can add headers and footers as text, variables, or a combination of both.
- You can configure column headings for formatting and nesting.