
Advanced Composite Features
Overview
There are additional advanced configuration options for composite reporting.
You can use conditional overrides when evaluating values in your columns, and format accordingly. You can outline on repeating columns or use an expansion hierarchy to a region dimension within the cost center structure.
For calculation columns, you can create a drillable override structure that allows you to drill down on details in the report from the calculation column.
A dynamic data row provides you the ability to create reports that adjust and expand based on the underlying data when you run the composite report. It uses the results of a specified advanced report definition as a subreport. The composite report preserves the sort order of the advanced report. You can also apply an aggregate calculation to the dynamic data row results. For example, you can look up specified account values for every account meeting the criteria you define and sum all account values returned by the dynamic data row.
Objectives
By the end of this chapter, you will be able to:
- Use conditional overrides for flexible formatting.
- Configure drill downs on calculation columns.
- Create an expansion hierarchy to display revenue categories within the Ledger Account Summary.
- Explain how to use dynamic data rows for various details, grouping requirements, analysis, and readability.
Conditional Overrides: Visibility, Styles, and Values
Conditional Formatting Override
Composite reports allow you to apply conditional overrides to visibility and styles. This flexibility allows you to apply a look and feel based on the outcome of the report at run time. Conditional overrides allow you to put focus on data outcomes to help the user do their analysis.
You can override style (e.g., number, font, borders) or visibility (e.g., hide or display a column row or cell) based on a condition being true or false. We do this using the option to Create Conditional Formatting Override. When we create the override, we create a True/False Condition rule to check the value of the data for which we want to perform the override. For example, if the row or column contains no data, we can choose to hide the row or column. This puts focus on areas where there is data.
We apply these concepts on both the column and cell levels in our activity. Consider how the steps slightly differ based on whether you are applying conditions on the column, row, or cell level.
Override | Process |
|---|---|
Column Level Override | Edit Column. Use Options field to use or create a new override. |
Row Level Override | Edit Row. Use Options field (under the Advanced heading) to use or create a new override. |
Cell Level Override | Select cell > Define > Conditional Format. |
Column Override
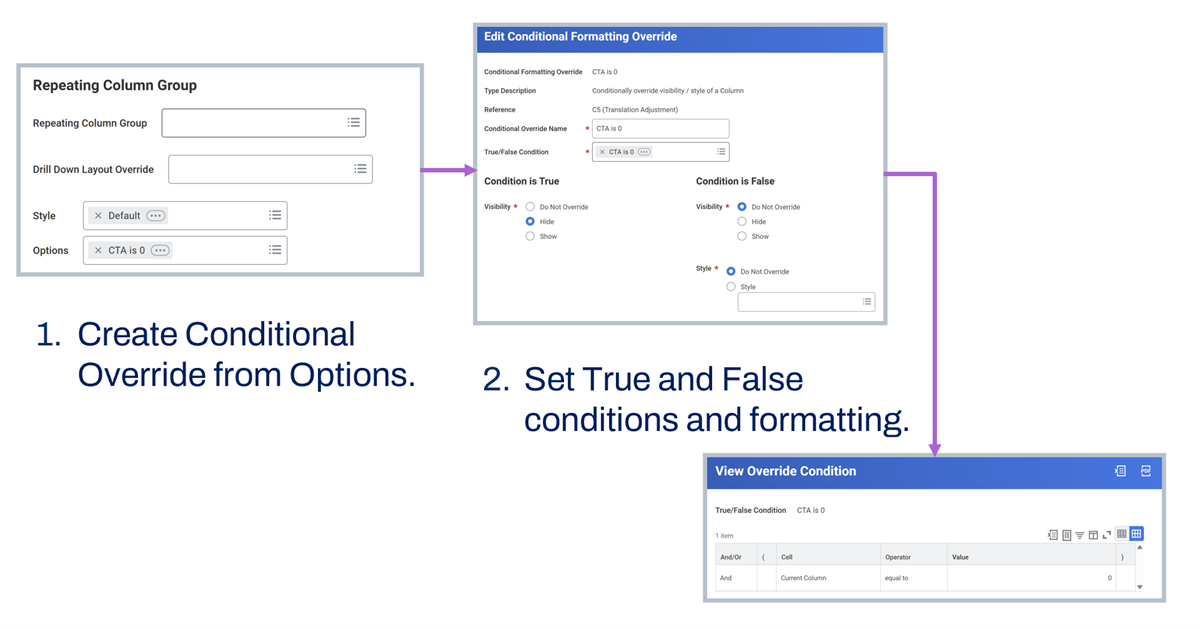
In our example, we consider how different report users may view columns of data that are empty. What if we want to conditionally hide these columns when the entire column of data contains values of 0? Based on the user running the report, and by applying a conditional override on the column level, we can hide those columns. When we create our Conditional Formatting Override, we create a reusable, contextual, True/False condition when a value = 0.
As shown in the screenshot below, the first step is to create a conditional override in the options field. The second is to set true and false conditions and formatting.
Cell Override
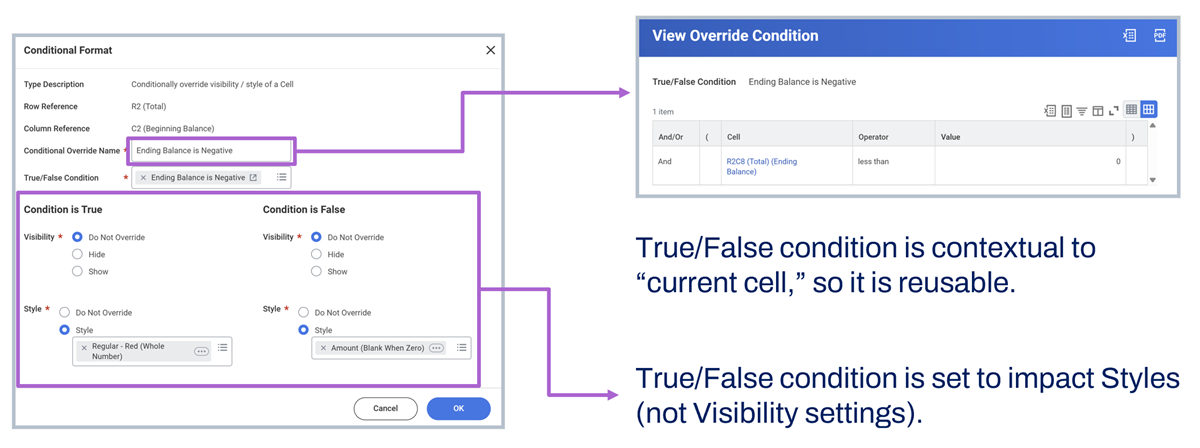
You can override the format at the cell level. We use this feature to apply conditional formats that highlight specific outcomes. For example, imagine terminations at GMS are an area of focus. We want any value greater than zero to be in red text, and any value of 0 to not appear at all. This provides better focus on the red areas. You can configure this as a Style override.
Note:
The Conditional Format has both Visibility and Style options for the True and False condition.Conditional Value Override
Conditional Value overrides only apply to cells. You can override the value of an empty cell at the intersection of a lookup data row and a data column. You can configure the cell to show 0 or the actual value, based on whether the condition is true or false. This can be useful to zero out data based on a condition. This is a cosmetic change and does not change the underlying data.
Note:
Columns with outlining do not support conditional overrides. If you are using outlined rows, the formatting style only applies against the top, or aggregated, row.Drill Down Layout Override
One powerful feature in composite reporting is the ability to drill into our various data columns to view underlying data coming from the subreports. You may notice, however, that our calculation columns do not link to the data where the calculation is coming from. You can deduce this from the data columns that form the calculation, but this may not always be the case. For example, if you hide data columns behind the calculations, or the calculation columns are not next to the data columns, it is difficult to find where the calculation comes from.
Note:
If the column includes cell overrides, you cannot create a drill-down layout override.Composite Calculation Drill Down Definition
The Composite Calculation Drill Down Definition allows you to identify a calculation column for drilling. You can also configure the underlying data column or columns that display when the user selects the new calculation cell link.
Note:
You need to select through one layer to get the underlying report. The first pop-up window shows the data columns configured in the Composite Calculation Drill Down Definition, and the second shows the underlying report.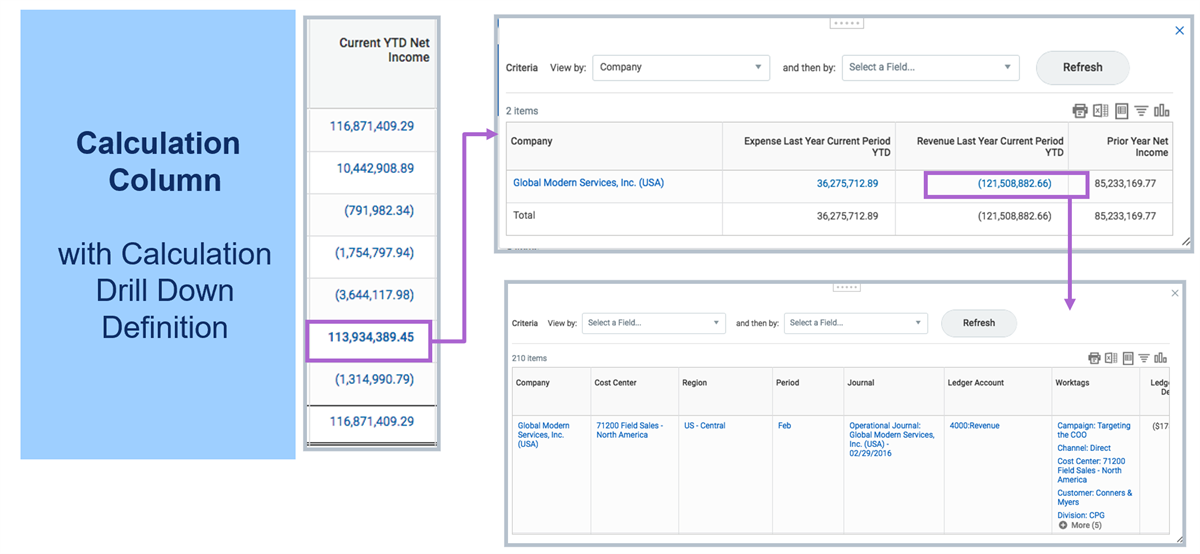
Expansion Hierarchies
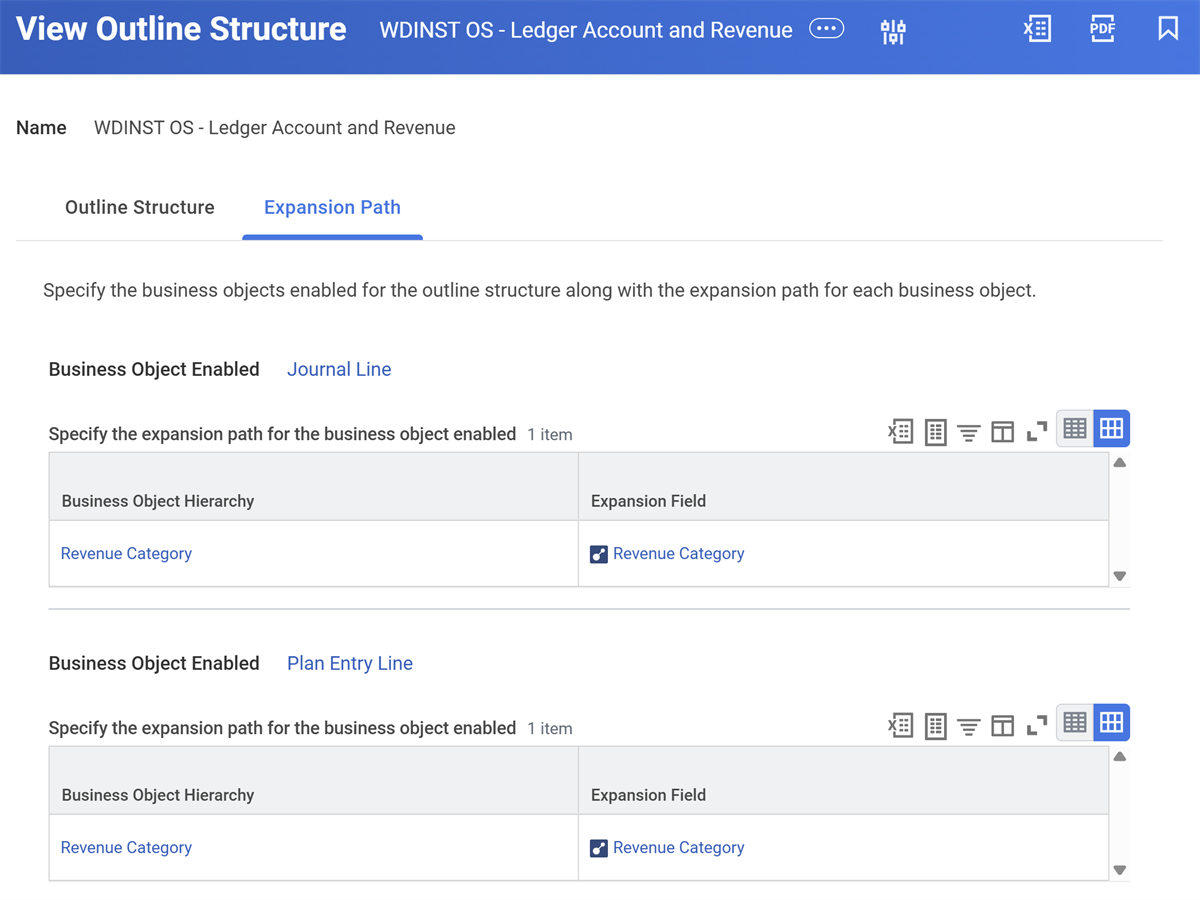
To create an expansion hierarchy, configure a new outline structure with an expansion path. This allows us to maintain the ledger account hierarchy in our report output and additionally display the revenue categories within each ledger account. We do this by using Revenue Category as our business object in the Expansion Hierarchies grid.
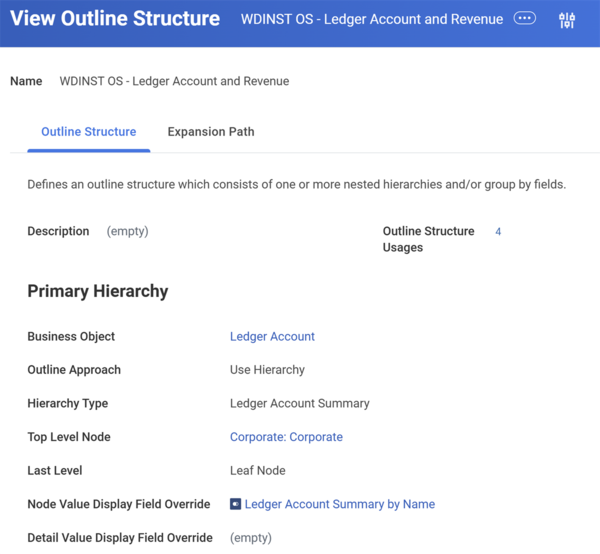
You also need to create two expansion paths, one on each of the business objects from our two subreports: Journal Line and Plan Entry Line.
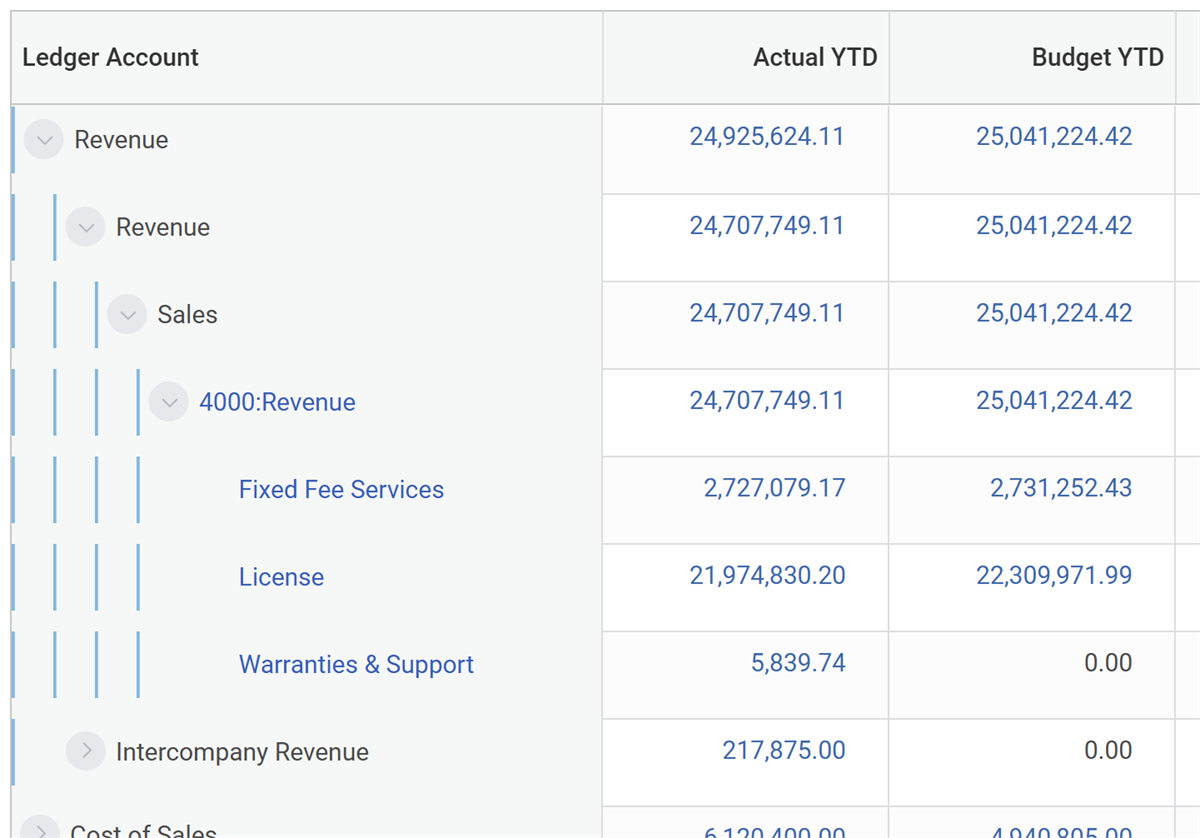
The final output shows the revenue category nested within each ledger account. You need to drill down each node until you reach the leaf node.
Note:
Expansion hierarchies do not export to Excel, unless you enable the advanced option to export to Excel (Report Settings > Advanced tab). With this option turned on, the report runs in the background to send the expansion to Excel. Expansions can only expand up to eight levels in the Excel outlining.Dynamic Data Rows
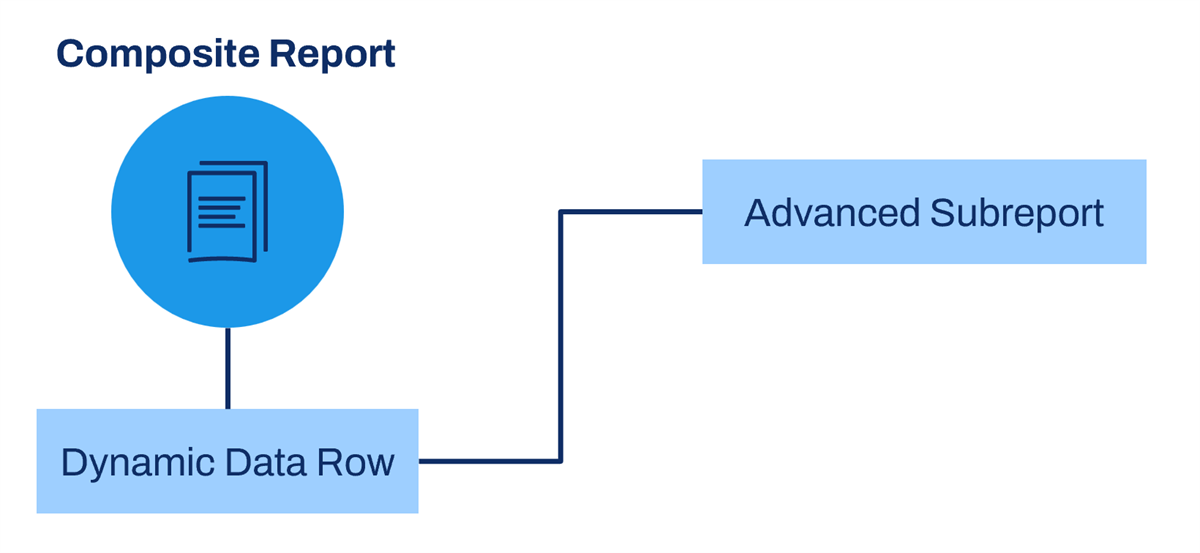
Dynamic Data Rows use advanced reports as subreports to populate the control field column. The advanced report sorts the data based on the business object instead of referring to the columns in the output. The report dynamically determines content when you run the composite report. The advanced report filters the data, and, if needed, you can further filter it in the row configuration. You can also apply an aggregate calculation to the dynamic data row results.
Example:
You can look up specified account values for every account that meets the criteria you define and sum all the account values returned by the dynamic data row. Any sorting defined in the advanced report carries over to the rows in the composite report. Additional Uses for Dynamic Data Rows
You can use dynamic data rows to:
- Create a summary without drill downs.
- Display specific levels of hierarchy.
- Create custom totals, hiding control field details.
Some report users may not want to display the entire outline structure or all the details. You can use dynamic data rows to present data more effectively. For instance, you can use dynamic data rows to display only summed rows for an entire hierarchy, or for particular groupings of cost centers defined in the report.
In our example, we notice how setting up a dynamic data row allows us new ways to present composite report data. We can set up our own rows that reference the advanced subreport to filter just the data we specify. In this case, Teresa only wants to display the sum totals of her own groupings of cost centers.
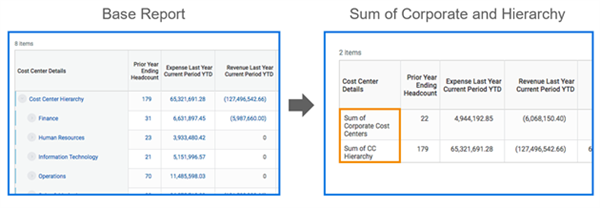
Dynamic Data Row Summary without Drill Downs
Dynamic Data Rows Subreport
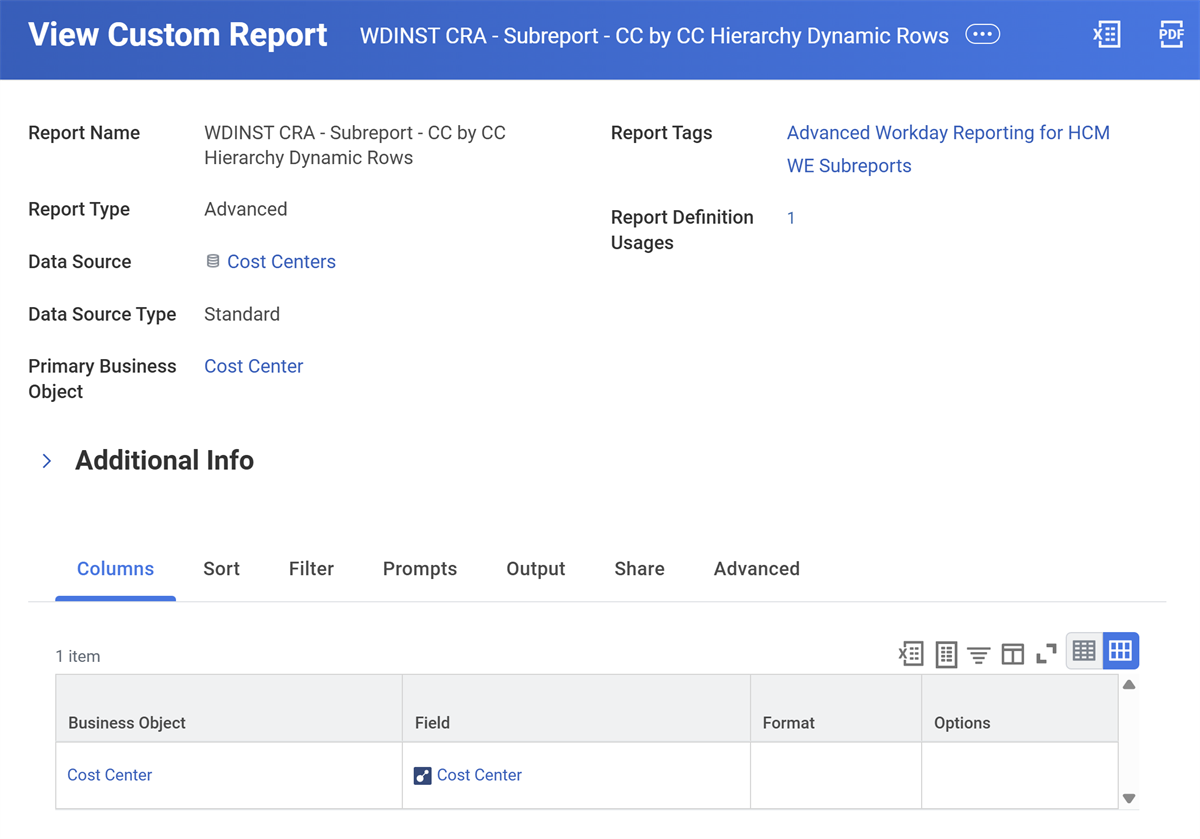
We set up our advanced subreport with the Cost Center data source. Consider that the object of Cost Center is the same as the control field of our composite report. We now configure the Cost Center fields in our report.
Note
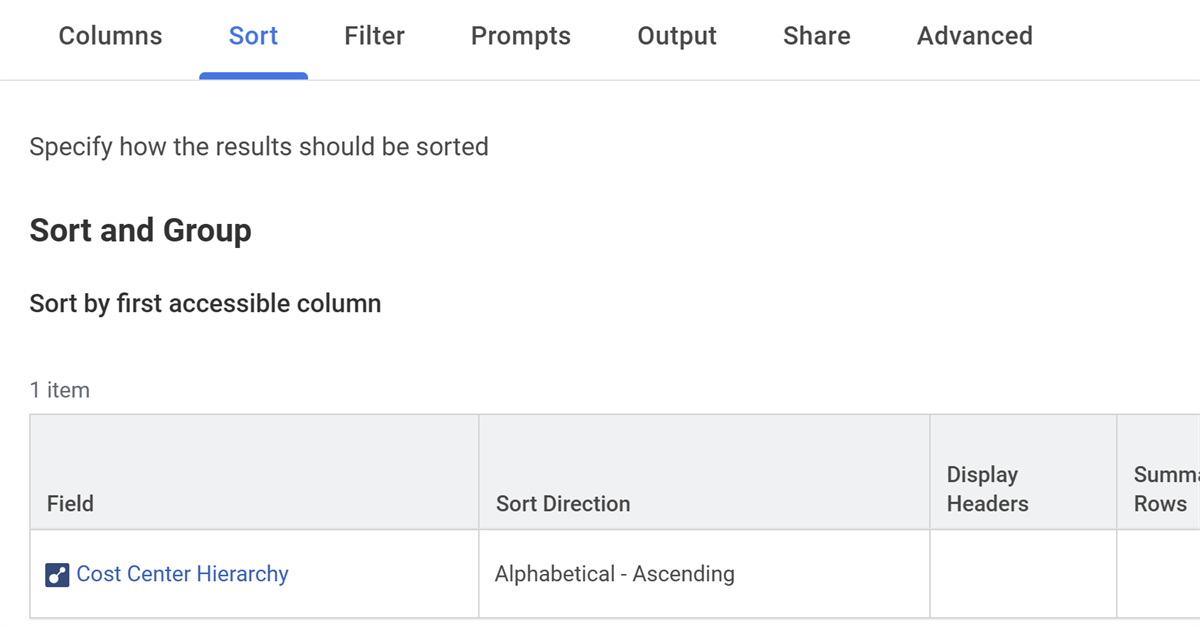
: The Primary Business Object can be any business object as long as one of the Columns includes a single instance type field with a Related Business Object that is the same as the composite report control field's Business Object.We choose to sort and group our data by the Cost Center Hierarchy.
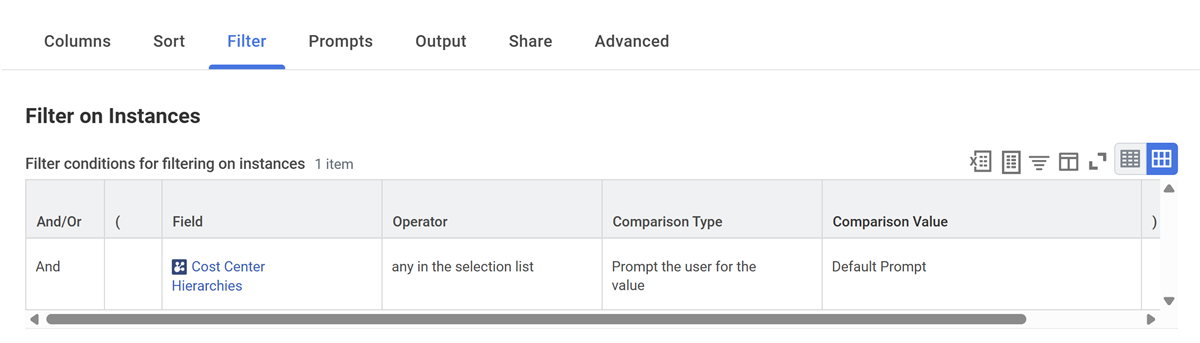
Finally, we configure the report to filter values based on the prompt value or values selected at runtime.
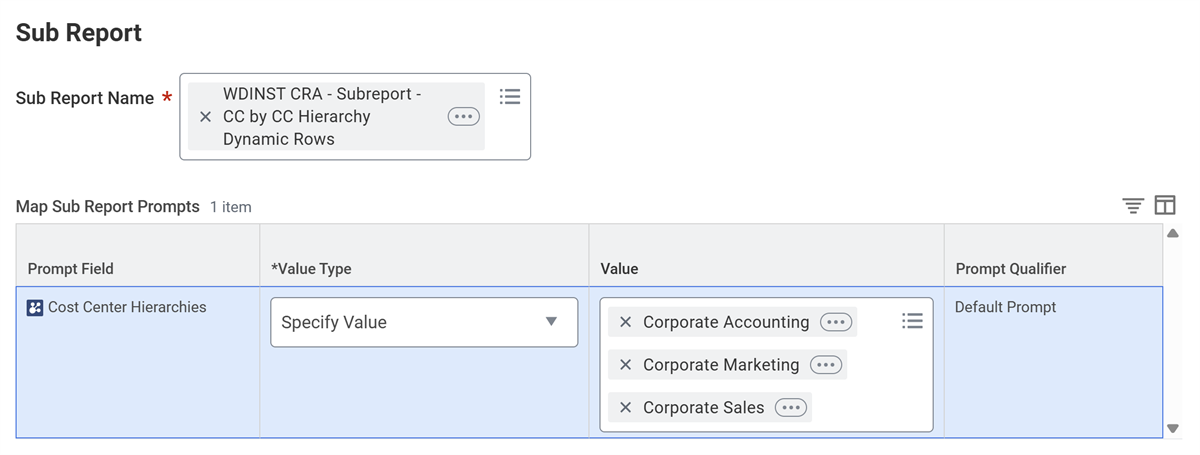
We achieve this by using our dynamic data row to reference the subreport prompt and then specify values that we want to group. We can create multiple row groupings in this way.
In this example, we selected all the corporate cost centers at GMS in our dynamic data row subreport prompts.
Configure Dynamic Data Row on Composite Report
Set up one or more dynamic data rows by selecting Define > Dynamic Data from the drill-down menu of an undefined row.
As you complete the task, consider:
Option | Description |
|---|---|
Sub Report Name | Select an advanced report to add to your composite report. |
Map Sub Report Prompts | Set up each prompt field if the:
|
Filter Data from Sub Report | Select to filter rows from the advanced subreport. Workday keeps the sort order for the advanced report when you run the composite report. |
Chapter Summary
- Use conditional overrides to set conditions to supersede formatting at a column, row, or cell level.
- The Composite Calculation Drill Down Definition function allows you to create a calculation column that you can drill into.
- Dynamic Data Rows use advanced reports as subreports to populate the control field column.
- You can use Dynamic Data Rows to:
- Create a summary without drill downs.
- Display specific levels of hierarchy.
- Create custom totals, hiding control field details.