
Display Data as Custom in Reports
As a matrix report developer, use the Display As Custom element to customize the data in a report.
Example:
- Display values as a percentage of the total for a roll-up account.
- Display values as a percentage of a different denominator.
- Reverse the sign for a variance amount such as from positive to negative.
The article walks you through many use cases for using the Display As Custom element.
Prerequisites
Prerequisites
- A new or saved matrix report. See Create Basic Matrix Reports.
Navigation
 From the Reports Overview page, open a report and select
 Edit
. Display Values as a Percentage of the Total
Watch the video:
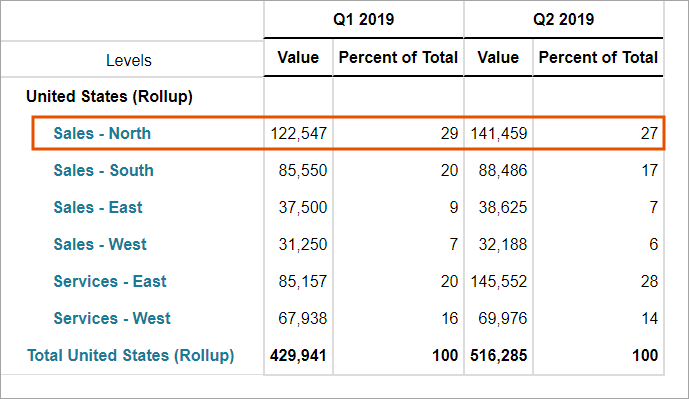
58sExample: Your Salaries by Level report currently displays Q1 And Q2 salaries for all US levels and the total for US. You want to understand which department is making up the most of the payroll in the US rollup.
Do the following:
- Drag theDisplay as Valueelement to the columns.
- Drag theDisplay as Customelement to the columns.
- Right-click theDisplay as Customelement and selectFormula Assistant.
- In theFormulafield, enter the formula:(ACCT.this/ACCT.this[level=United States(+)])*100. SelectOKto close the Formula Assistant.
- Right-click theDisplay as Customelement and selectProperties. Enter the label "Percent of Total. SelectApply.
- Save and run report. The report now displays a new Percent of Total column. In this column, you can see that Sales North is the highest percent of US from a payroll perspective. The salaries for all US levels continue to display under a new Value column.
Display Different Denominators for Different Rows
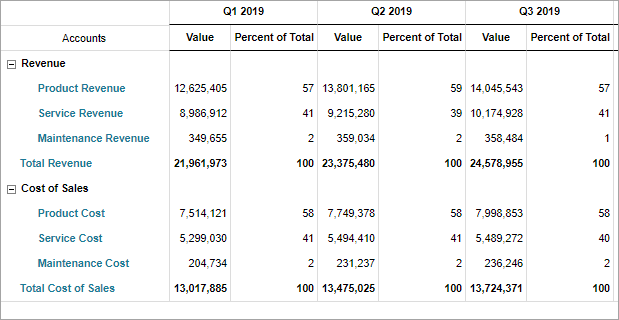
Example: Your report uses the Display As Percent element to show both revenue and cost line items as a percent of revenue. The report currently uses only one denominator (Revenue) for the whole report. You want to display the cost line items as a percent of cost and the revenue line items as a percent of revenue.
Do the following:
- Delete the Display As % of Account element. Example: Delete "As % of Revenue".
- Drag theDisplay As Customelement in the placement for the Display As % of Account element.
- Build an if statement using GL account codes. The account codes differentiate the accounts so the if statement can identify the different rows for their denominators:
- Navigate toModeling > Model Management > Accounts > General Ledger Accounts.
- Search forCustom Accounts. Under P&L Accounts, note that the account codes for all the revenue accounts have "Rev". None of the cost accounts have "Rev" in their codes.
- Navigate back toReports.
- Right-click theDisplay As Customelement and selectFormula Assistant.
- In theFormulafield, enter an if statement that checks if the account code for a row contains "rev". If yes, then it divides the account by the Revenue denominator and multiplies by 100. If not, then it divides the account by the Cost denominator and multiplies by 100.if(search(this.account.code,"rev")>0, (ACCT.this/ACCT.PL_Revenue)*100, (ACCT.this/ACCT.PL_COS)*100)
- SelectOKto close the formula assistant.
- Right-click theDisplay as Customelement and selectProperties. Enter the label "Percent of Total. SelectApply.
- Save and run the report. The report now displays the revenue line items as percentage of Revenue and the cost line items as a percentage of Cost of Sales.
Display a Variance Differently
Example: Your Per Employee Metrics report displays the Revenue and Cost per Employee and the variance over time. Currently the variance shows as positive (increased) for both the accounts. Although an increased variance for revenue is favorable, you want to see an increased variance for cost as unfavorable or negative.
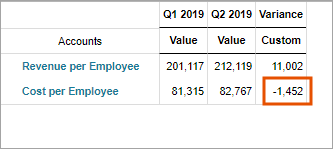
The Reverse Sign option available with the Difference element only applies to GL accounts. You cannot use this option with metric accounts such as cost of sales or gross margin percentage.
Do the following:
- Add a new column segment and drag over the Difference element (Variance) to the new segment.
- Drag theDisplay as Customelement to the new segment (below the Difference element) to display the variance differently.
- Drag theDisplay As Valueelement to the first segment to continue to display the quarterly amounts as values.
- Build an if statement using metric account attributes:
- Navigate toModeling > Model Management > Accounts > Account Attributes.
- Create a new ReverseSign account attribute with values Yes and No. Do not include any spaces in the account attribute name for use in a formula.
- Navigate toAccounts > Metric Accounts. Expand Employee Metrics and then Per Employee Metrics.
- Select theRevenue per Employeeaccount and assign the ReverseSign attribute value No.
- Select theCost per Employeeaccount and assign the ReverseSign attribute value Yes.
- Back in Reports, right-click the Display As Custom element and selectFormula Assistant.
- In theFormulafield, enter an if statement that checks if the account has the ReverseSign attribute value set to Yes. If yes, then it takes the variance and multiplies by-1. Else, it just gives the variance for the account:if(this.account.ReverseSign.name="yes", (ACCT.this*-1), ACCT.this)
- Close the Formula Assistant and run the report.
Display Trailing Three Months
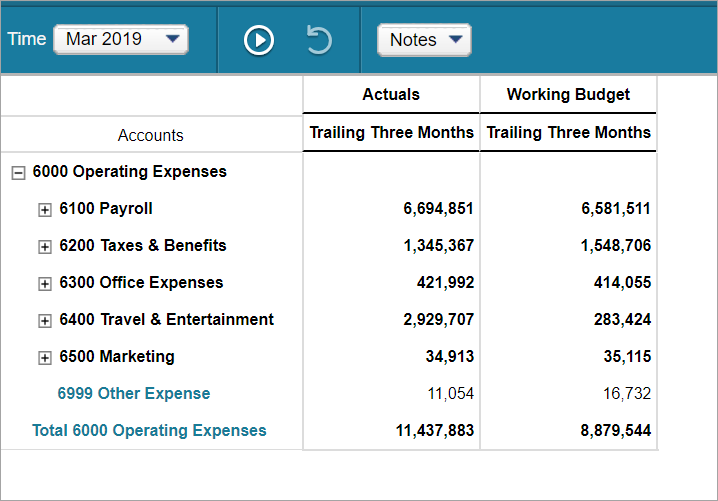
Example: Your Expense Report currently displays actuals and budget amounts for a specific month, say March. You want to look at the values for the last three months (Jan - Mar) aggregated in a single column.
Do the following:
- Drag theDisplay As Customelement to the columns below the versions (Actuals and Working Budget).
- Right-click theDisplay As Customelement and selectFormula Assistant.
- In theFormulafield, enter the formula:ACCT.this[time=this-2:this].
- SelectOKto close the formula assistant.
- Right-click theDisplay as Customelement and selectProperties. Enter the label "Trailing Three Months. SelectApply.
- Save and run report. You can now see the rollup for Jan to Mar in the versions columns. Since time is parameterized in this report, you can select a different month from the Time drop-down. Example: Select April to see the rollup for Feb - April in the columns.
Display Different Time Periods for Different Versions
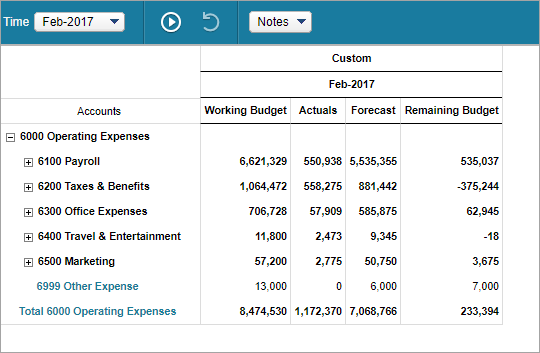
Example: You want to create a matrix report that displays the following data for operating expenses:
- Working Budget for the whole year
- Actuals for year to date (beginning of the year to now)
- Forecast for the rest of the year (all months after this month till the end of the year)
- Remaining Budget (variance of the three versions)
Do the following:
Create the Report
- Drag Operating Expenses to the rows.
- Drag a time element to the columns such as Feb-2017). Parameterize the time element.
- Drag the versions Working Budget, Actuals, and Forecast to the columns below the time element.
- Drag a custom calculation element to the columns after the versions.
- Right-click the custom calculation element and selectFormula Assistant.
- In the Formula field, enter the formula:RPT.Working_Budget-RPT.Actuals-RPT.Forecast.
- Right-click the custom calculation element and selectProperties. Change the label to "Remaining Budget".
- Save and run the report.
Change the Report
- Drag theDisplay as Customelement to the columns above the versions and time.
- Right-click theDisplay As Customelement and selectFormula Assistant.
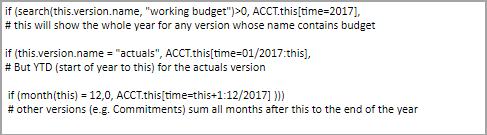
- In theFormulafield, enter the following if statements. Use the pound symbol (#) to add text that describes each statement.
- SelectOKto close the Formula Assistant.
- Save and run report.