
Matrix Reports
Overview
This chapter covers matrix reporting functionality and configuration options. It explains how to modify row and column formatting to meet requirements through the use of facet filters, nested levels, and field value groups. It also addresses drill down functionality and overrides.
Objectives
By the end of this chapter, you will be able to:
- Summarize data in a matrix report.
- Add a percentage of total calculation to a matrix report.
- Drill into summarizations to view by different fields and drill to details.
- Narrow down report results by configuring facet filters.
Matrix Report Functionality
Matrix reports are the foundation for custom analytics and interactive reporting in Workday. Matrix reports provide grouping, aggregation, and interactive drilling across different dimensions, allowing users to gain insight into data and take action on results.
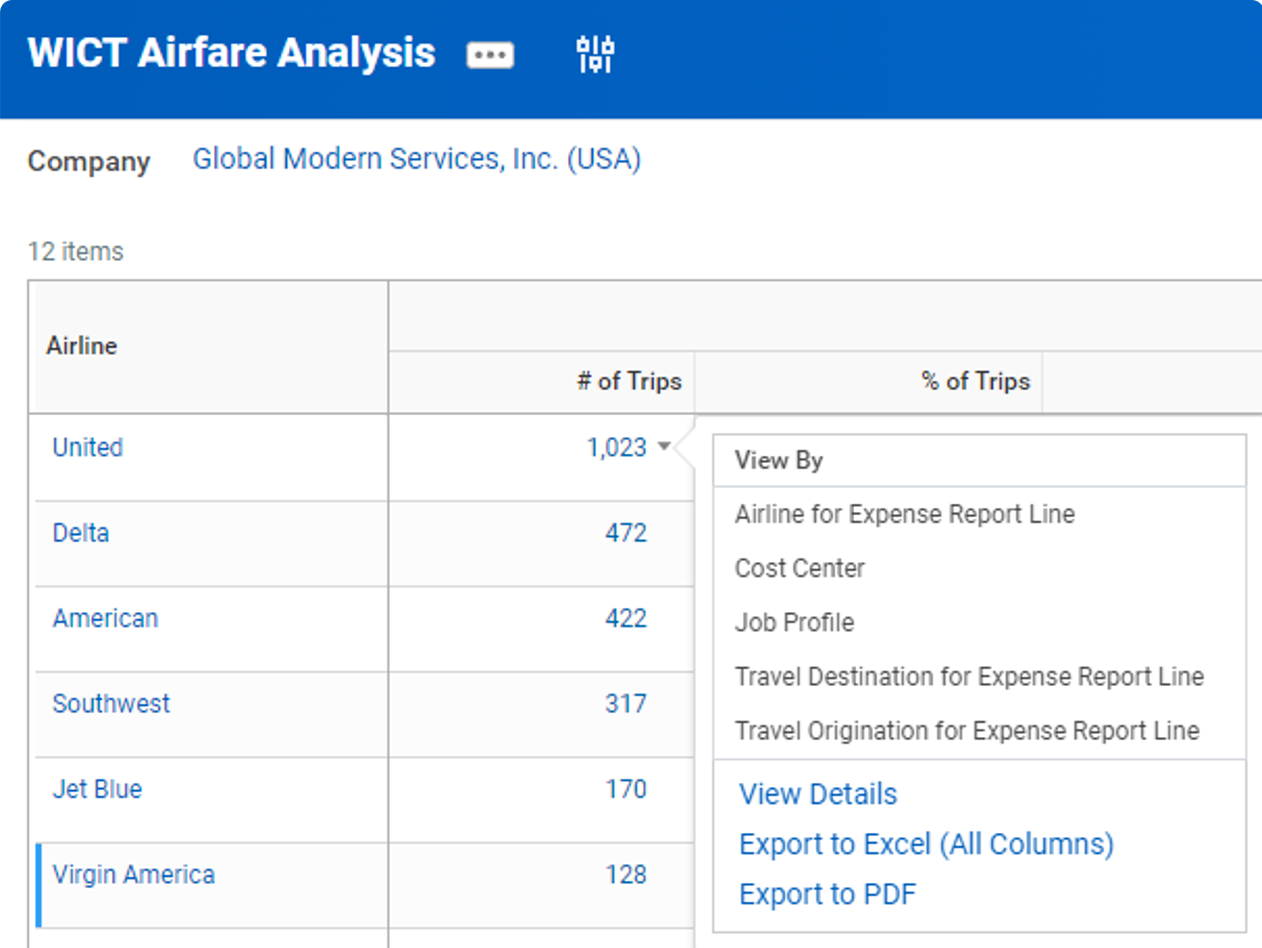
Matrix reports group data by row, and, optionally, by column. When you run the report, Workday builds the report matrix both horizontally and vertically, based on the report criteria. After building the matrix report, you can view the summarization data by different fields. You can drill into each cell value, group the results by another field (View By), or view the details (View Details) that comprise the value in the matrix cell.
Matrix reports are ideally suited for:
- Aggregating and summarizing numeric data
- Modifying rows and columns at run time for a different view
- Drilling into summaries and details
- Taking action on insights
The main construct of a matrix report involves:
- Grouping: Group instances of the primary business object by defining the row and column groupings.
- Summarizing: Define aggregations for each grouping.
- Drilling: Drill into the summarizations for further analysis. Report users can view the data by other fields and access detail data behind the summarizations.
Configuring the Matrix Report
When configuring a matrix report definition, first define the summary matrix for the report under the Matrix tab. Define row and column groupings and configure how you want to summarize the primary business object for your report.
Groupings
Row and column groupings are the starting summary matrix for the report. Specify at least one row grouping and one summarization.
A grouping may be a single instance, text, Boolean, date, or numeric field. You may use nested levels by grouping more than one dimension. Column groupings are optional.
For each grouping, specify a sort option. By default, totals determine sorting (in descending order based on the first value in the summarization grid). Alternatively, you can sort alphabetically, based on a logical sort, or based on a defined field value group.
Summarization Types
Matrix reports allow you to configure summarizations for your report's numeric or currency data. The Summarization Type enables you to specify the aggregation method applied to the field. The results of the aggregation method are displayed in the matrix cells of the report output. The default summarization type is Count. Summarization options include:
Term | Definition |
|---|---|
Average
| Averages the values of a field for defined grouping. |
Calculation | Create your own arithmetic calculations on the other summarizations generated in the report. For example, using a calculation, you can subtract the Minimum summarization value generated from the Maximum summarization value generated. Matrix report summary calculations are unique to the report. You can maintain and edit these calculations like report-specific calculated fields. |
Count | Counts the number of values (instances) for a defined grouping. |
Count Distinct Instances | Counts the distinct number of instances based on a specific field. |
Maximum | Displays the maximum value of a field for defined grouping. |
Minimum | Displays the minimum value of a field for defined grouping. |
Percentile | Displays the percentile. Selecting the 50th percentile displays the median. |
Sum | Adds the values of a field for defined grouping. |
If using an indexed data source, when choosing fields to summarize, use the
View Indexed Fields for Data Source
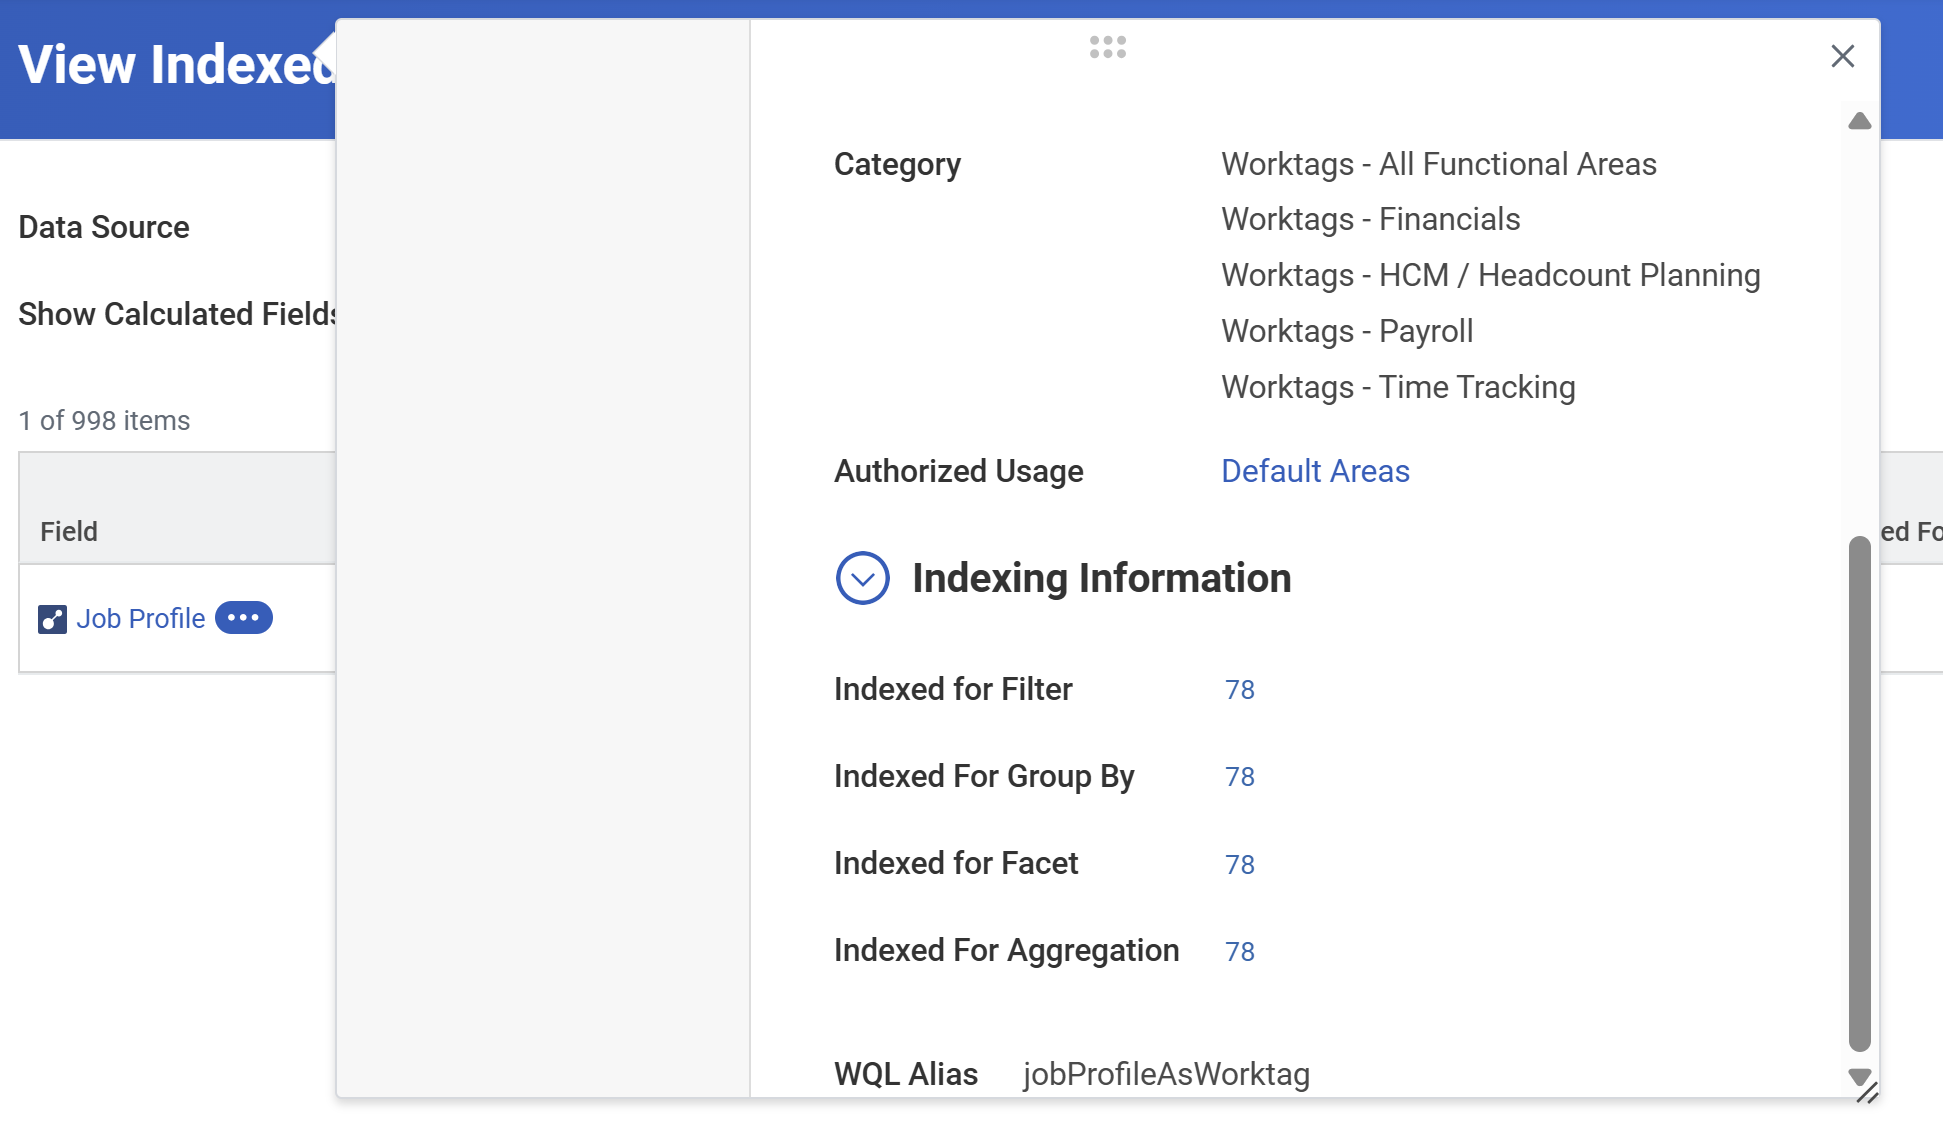
report or preview the field. Then, expand the Indexing Information section to determine if the system indexes a given field for Aggregation. If not, you will notice a performance alert (not error) in the report. Performance improves when indexed fields are at the top of the group by list.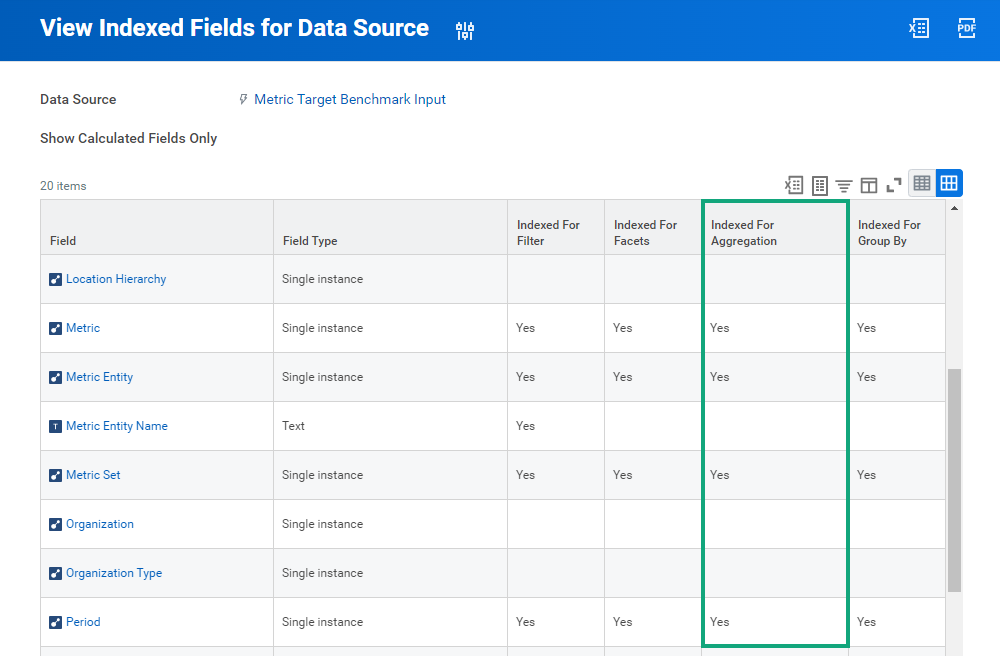
A runtime error appears when attempting to run a shared matrix report and the user does not have the following "view" security permissions:
- Row grouping
- Column grouping
- Summarization field
Calculation Summarization Type
Using the Calculation summarization type enables you to perform calculations on summarized numbers and corresponding totals. You can compute and display ratios, percentages, and averages as they relate to summarized values.
When you select the Calculation summarization type, choose an existing summary calculation for the report or create a new summary calculation for the report.
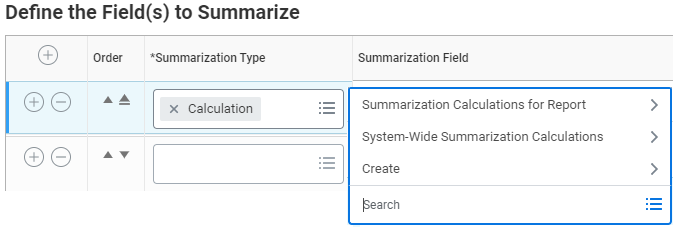
You can also create Summary calculations for matrix and trending reports at the global level using the
Create System-Wide Summarization Calculation
task .
Filter on Aggregations
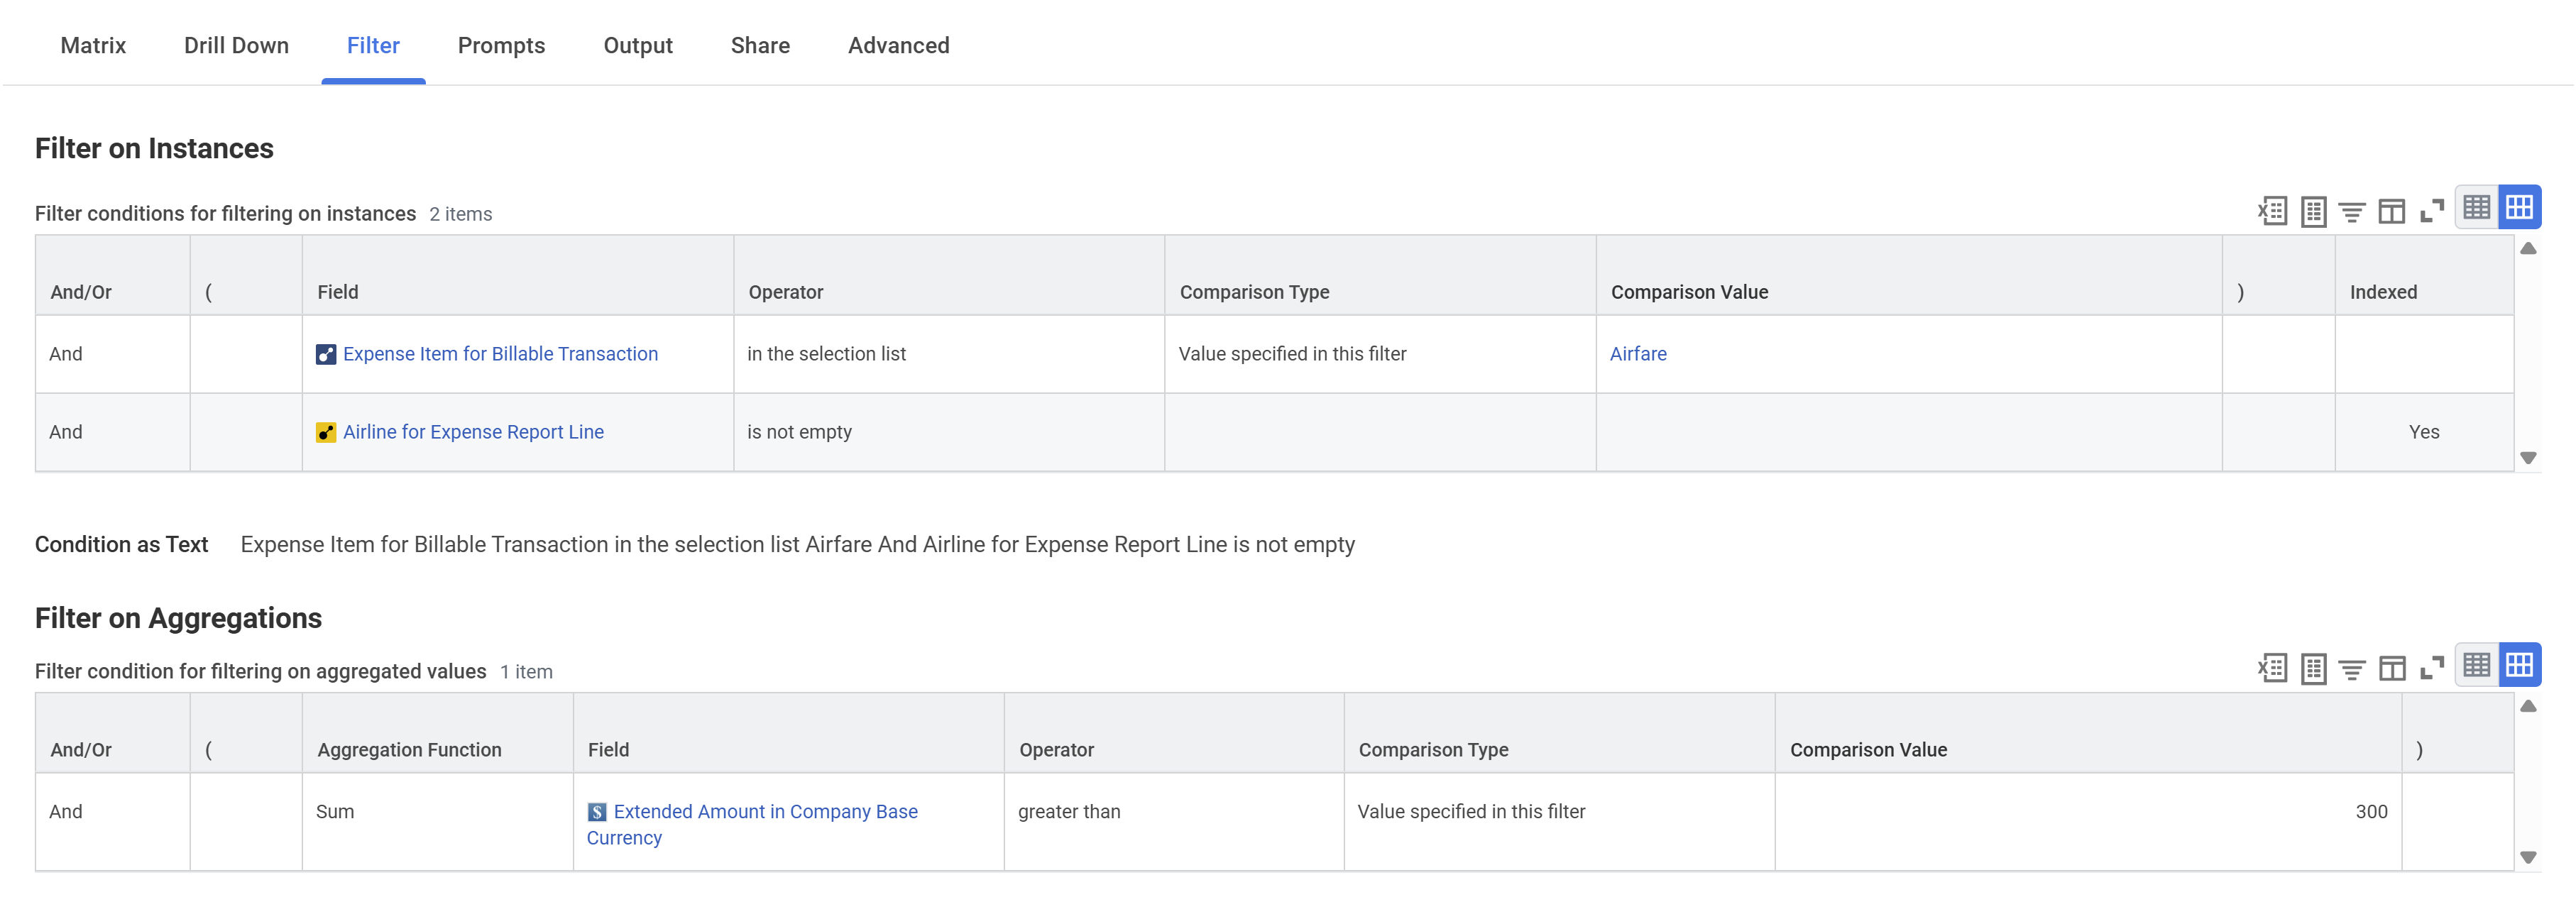
On matrix reports, you have the option to specify a filter condition that filters on aggregated values. Select the aggregation function, field, and operator. Available aggregation functions include count, sum, minimum, maximum, and average. This option is also available for advanced and trending reports. However, you cannot filter on aggregations if you use percentile summarizations, facet options or have a column grouping.
Output Formatting Options
The output of a matrix report is configurable. You can modify the formatting of rows and columns, as well as what to include when drilling into the details of the report output.
Modify Rows and Column:
- Sort options
- Maximum number of rows/columns
- Percent of totals
- Field value groups
- Nested levels
Modify Drill Down Options:
- Detail data
- Drillable fields
- Disable drilling
- Override detail data
Matrix Report Limits
There are limits to what the system can display in the matrix report output.
Item | Maximum |
|---|---|
Group by Rows | 12,000 |
Group by Columns | 250 |
Summarizations | 15 |
Detail Data Fields | 25 |
Maximum Number of Rows/Columns
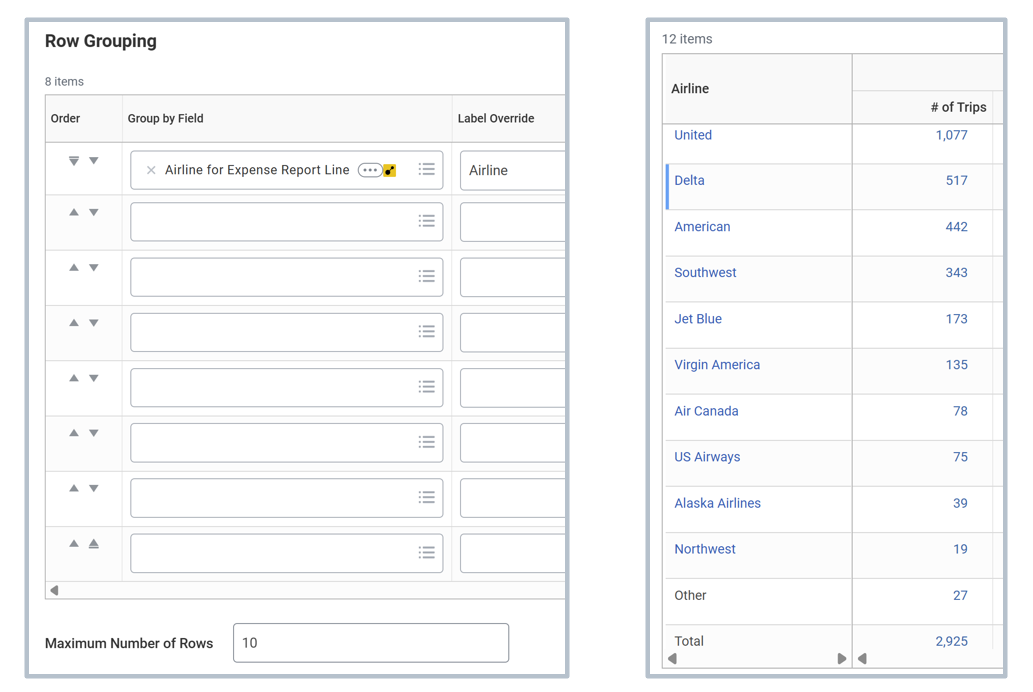
You can control the maximum number of grouping values to display in the report output. The default number is 250 for row groupings and 20 for column groupings. When setting a maximum, the values that display depend on the configuration of the sort order.
If the number of values for that Group By field exceeds the maximum display, the report output captures exceeding values as "Other." If it appears that data is missing from report output, ensure that you have not exceeded the maximum number of rows and columns.
Percent of Totals
You can configure a matrix report to compute and display a percentage of a column, a row, or an overall total. The system applies a percent of total calculation as an option to a given summarization. Include a percentage of total calculation by adding a row to the Define the Field(s) to Summarize section and specifying a percent of total in the Options column.

There are three options available, depending on your matrix report groupings:
- Percent of Column Total
- Percent of Row Total (only available when the system configures column groupings.)
- Percent of Overall Total
You can only select one Percent of Total option for a given summarization line. You can then select from available percentage formats under the Format options.
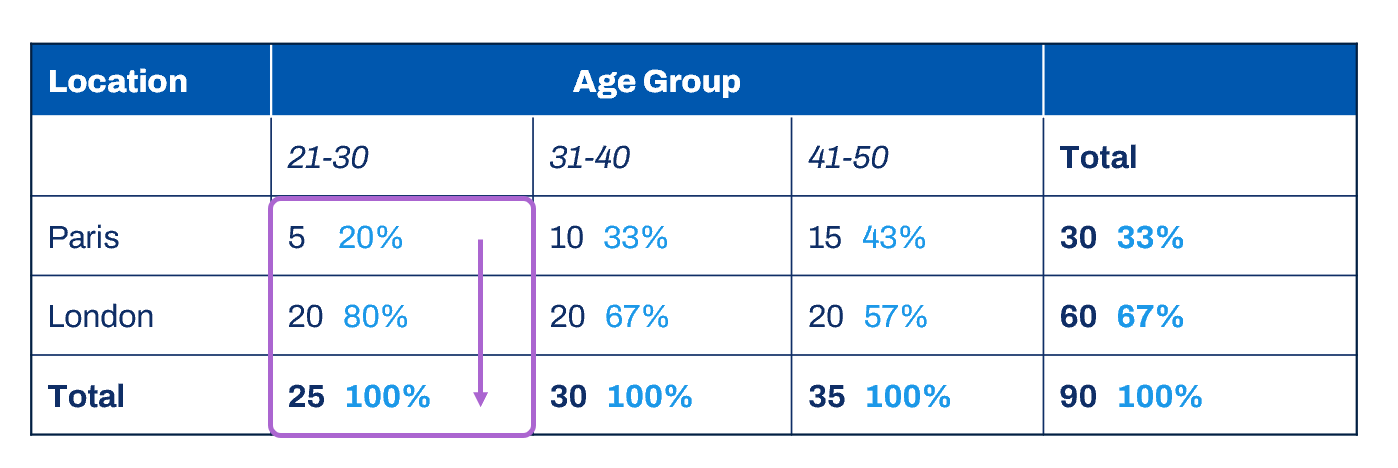
Percent of Column Total
The column total shows 100%. Values in that column will show as a percent of the column total:
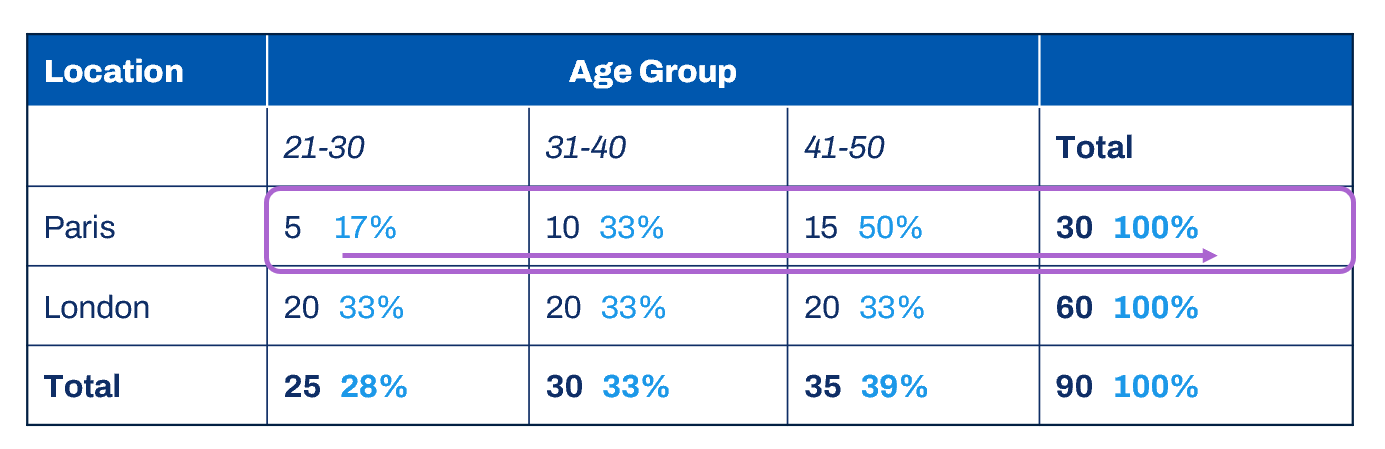
Percent of Row Total
The row total shows 100%. Values in that row will show as a percent of the row total:
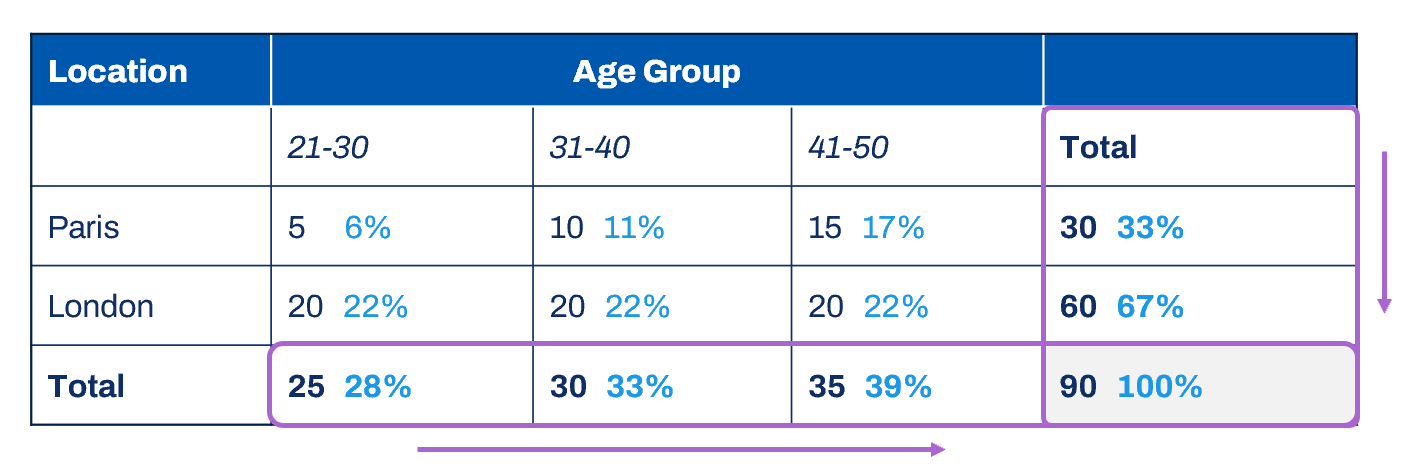
Percent of Overall Total
The grand total in the lower right represents 100%. The output shows all percentages in relation to the grand total amount:
Drill Down
The Drill Down tab allows you to configure additional information about the summary data that displays when you drill into values of the report output.
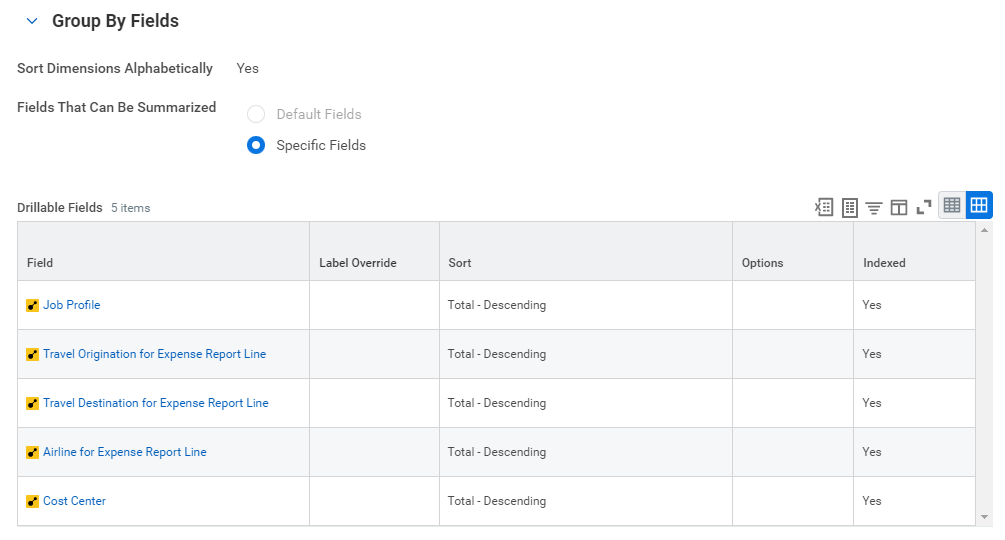
Drillable Fields
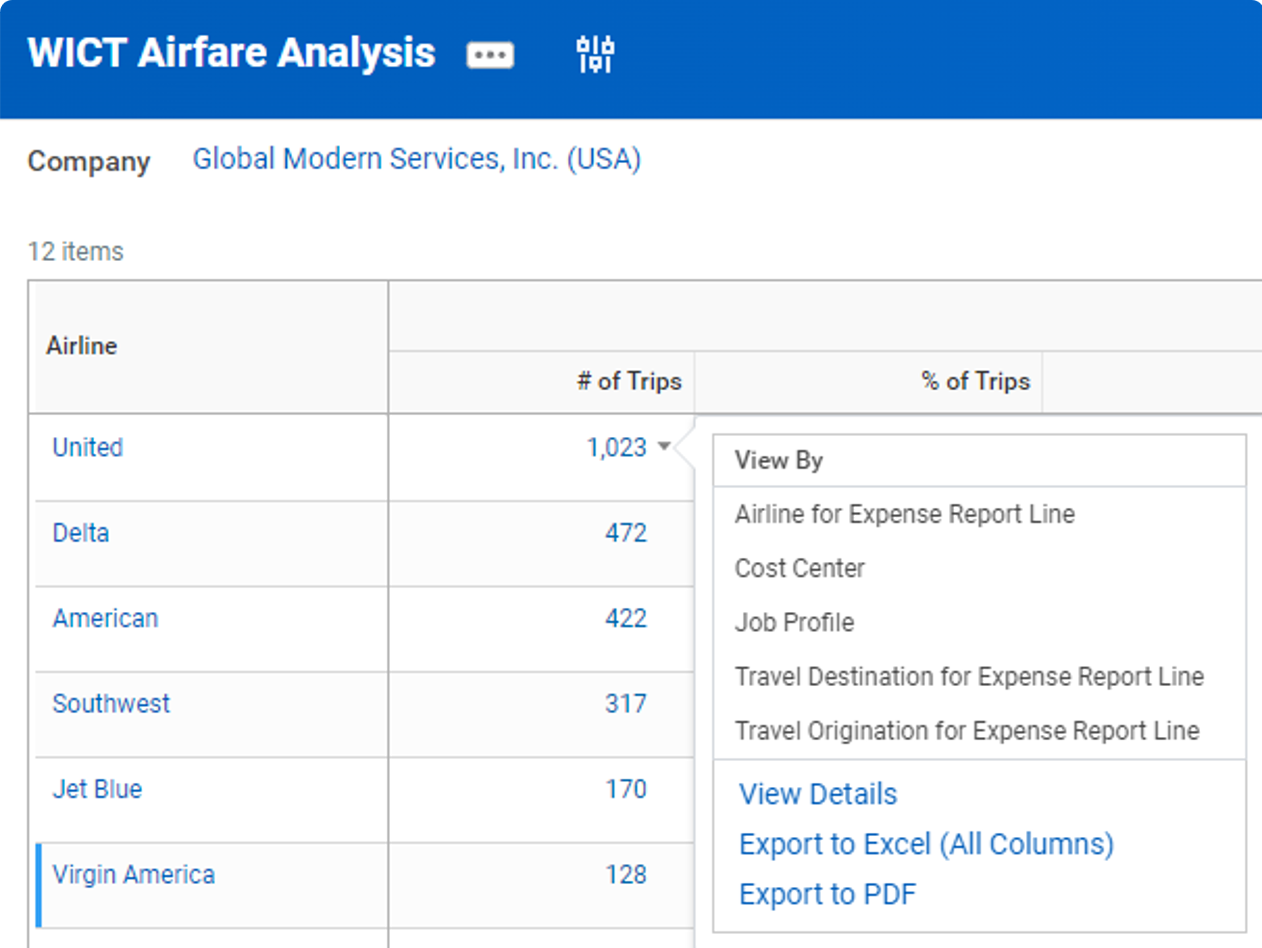
You can define fields by which the user can further group the data. These fields display when the user selects the View By option on a summarization. Users can drill on up to two dimensions when viewing the report output. Default fields display automatically if you do not define those fields. Workday determines the default fields for each business object used in a matrix report.
Selecting specific fields rather than the default allows you to configure a controlled subset. It is a good practice to configure specific drillable fields because the default fields may change from one Workday release to the next.
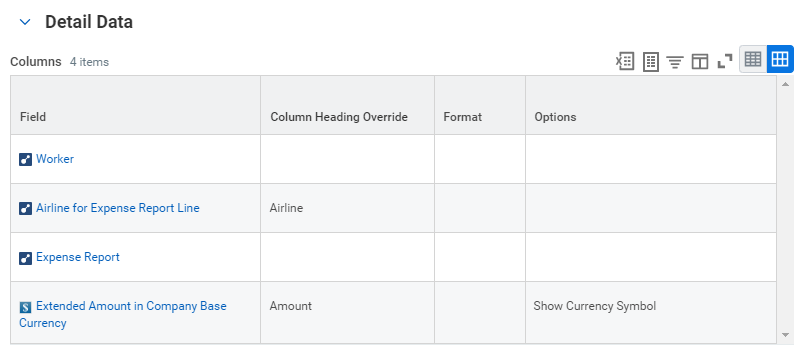
Detail Data
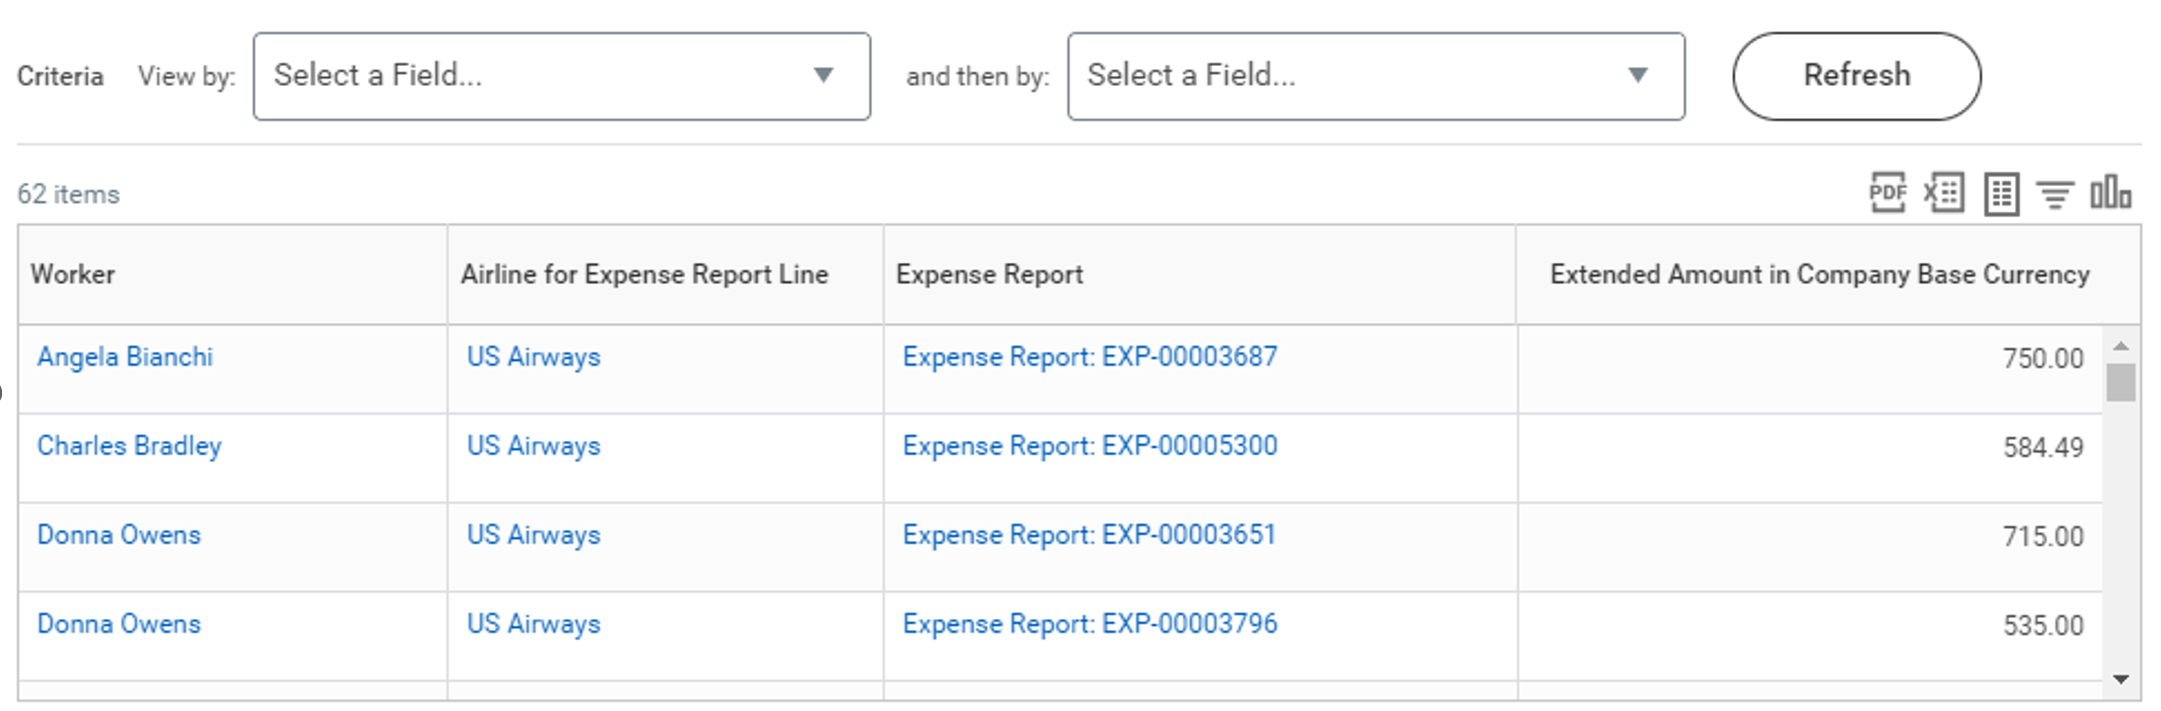
Configure which fields display when the user selects the View Details option or select a summarization value directly.
Disable Drilling and Override Detail Data
While you can define drill down information using Drillable Fields and Detail Data, you also have the option to override the drill-down configurations.
Disable Drilling
There are two options for disabling drilling in matrix reports:
Option | Outcome |
|---|---|
Disable all drilling for the report | Users will not be able to drill into any details of the report output. Apply this setting if you want users to access summary information only. |
Disable drill to details for the report | Users will be able to "View By" the allowed drillable fields, but not drill into the detail data. |
Override Detail Data
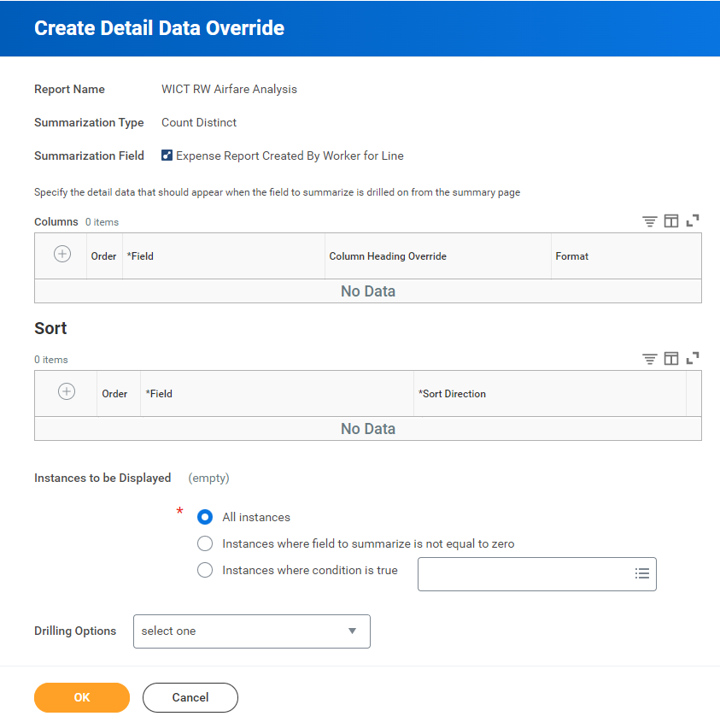
By default, any Detail Data fields configured on the Drill Down tab are visible to the report user when drilling into a summarization value. However, you can create Detail Data Overrides to display different data for a given summarization.
Additionally, you can specify conditions for instances you want displayed, allowing you to show detail data for only certain instances or for all instances. Summary Calculations do not allow detail data override fields to display. In the Drilling Options, you may turn off summary calculation drilling and details by selecting the option to disable all drilling to this field.
Use the following steps to define detail data overrides:
- From the report definition's Matrix tab, navigate to the Define the Field(s) to Summarize section.
- Select the prompt in the Options column of the summarization for which you want to define specific detail data.
- Select Create > Create Detail Data Override.
- Define the detail data columns and select OK to save.
- When a user drills into the details of that summarization from the report output, they will notice the fields defined in the override, not the ones on the Drill Down tab.
Drill To Report Links
You can use drill-to report links to run other reports directly from the results of a matrix report.
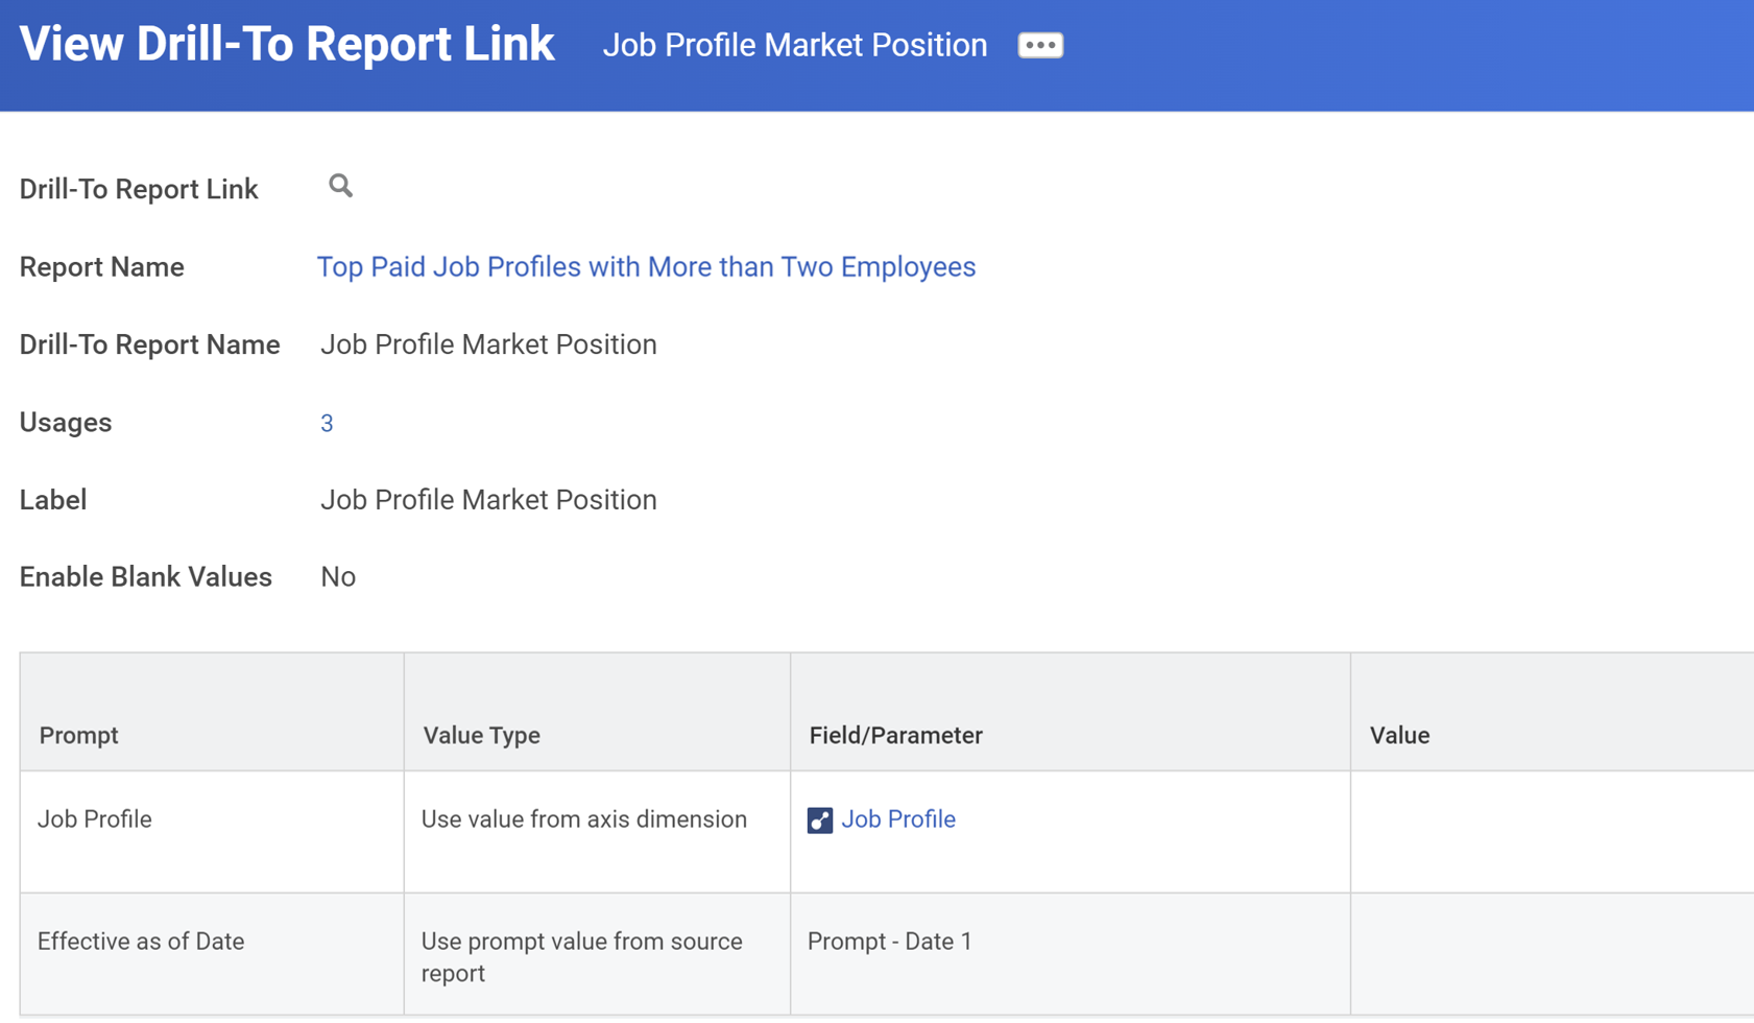
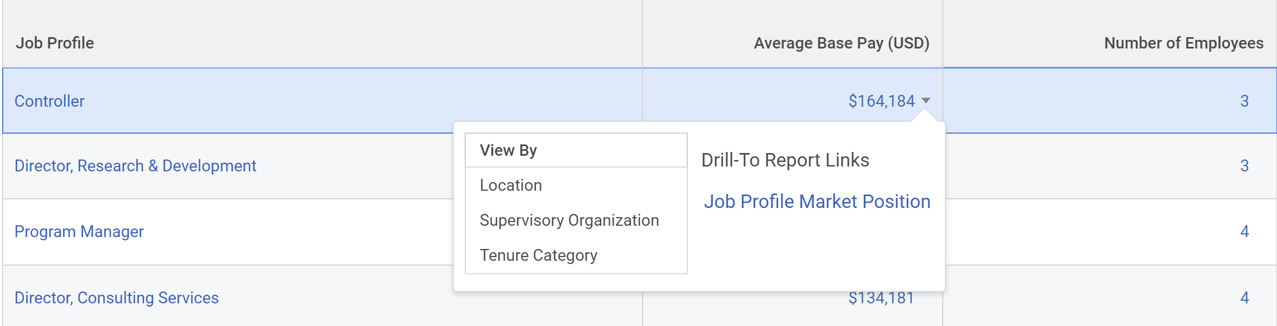
You can create a drill-to report link from the Options prompt on the Define the Field(s) to Summarize grid by selecting
Create
> Create Drill-To Report Link
. You can create up to five drill-to report links for each summarization and link to any type of report. As you complete the task, consider:Option | Description |
|---|---|
Drill-To Report Name | Select the report that you want to drill to. The grid displays all prompts from the drill-to report that don't have Do Not Prompt at Runtime selected. |
Label | Specify a name to use for the drill-to report instead of the populated name. |
Enable Blank Values | Select the checkbox to enable Workday to pass these values from the source report to the target report:
When you clear the checkbox, Workday omits the field from the target report results. To enable Workday to display a field with a blank value on the target report results, configure the blank field on these Value Type prompts:
Workday supports blank values only on instances and when the operator is In the selected list . |
Value Type | Workday populates some prompts with No default value if the composite report does not have populated prompt values already.Select:
|
Field/Parameter | When you select:
For multi-instance fields, Workday only passes a single value to the target report. Example: If the Country field on the source report has values of USA and France, Workday only passes one value onto the target report. |
Value | The option is available when you select Specify default value from the Value Type prompt. Select a populated value for the prompt field. |
Facet Filters
You can configure Facet Filters on matrix reports as well as other report types to further narrow down the report results. You can use this type of filter with indexed data sources, allowing for high performing filtering on high volumes of data.
Indexed data sources are a type of data source optimized for performance, aggregation, and faceted filtering on large volumes of data. Workday recommends that you use these data sources whenever possible to get the best performing reports. To explore a full list of indexed data sources, run the delivered report Data Sources. This report will show all delivered data sources and includes a column indicating the data source type (Standard vs. Indexed). Indexed data sources often include data sources filters for different criteria. Some common indexed data sources include:
- Workers for HCM Reporting
- Trended WorkersResource: Trended Workers is a special data source that requires setup and allows for up to 3 years of historical reporting on staffing activity and headcount in HCM. Visit the Workday Community Administrator Guide for detailed instructions on how to set up your tenant for Trended Worker reporting. Search Steps: Set Up Tenants for Trended Worker Reporting.
- Journal Lines for Financial Reporting
- Academic Period Records
- Academic Records
- Course Sections
- Financial Aid Packages
- Student Cohorts
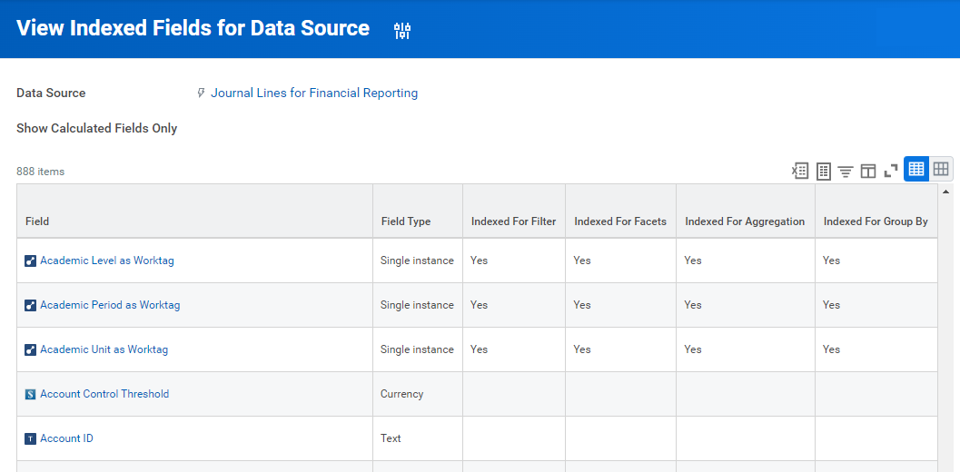
Within an indexed data source, the system indexes different fields for different purposes, such as for filtering or for facets. Only fields enabled for facets are available to add as Facet Filters on the Advanced tab of the report definition. Use the
View Indexed Fields for Data Source
report to determine which fields are Workday indexes for which uses.If using an indexed data source in a custom report, you can also notice the report field indexing information when previewing the report field.
Field Values Group
By default, a given grouping's summarization results only display in the output if data exists for those groupings. Configure field values groups to control which groupings display. This setting allows for consistent formatting that gives the report output a more balanced appearance.
Field values groups allow you to:
- Display values for a grouping even if no data exists.
- Display only the grouping values you specify.
- Display groupings in the order you define.
Example
: A row for grouping "20 and under" and "21-30" will not display if:- A matrix report groups by Age Group.
- There are no results for Age Group "20 and under" or "21-30" across all column groupings.
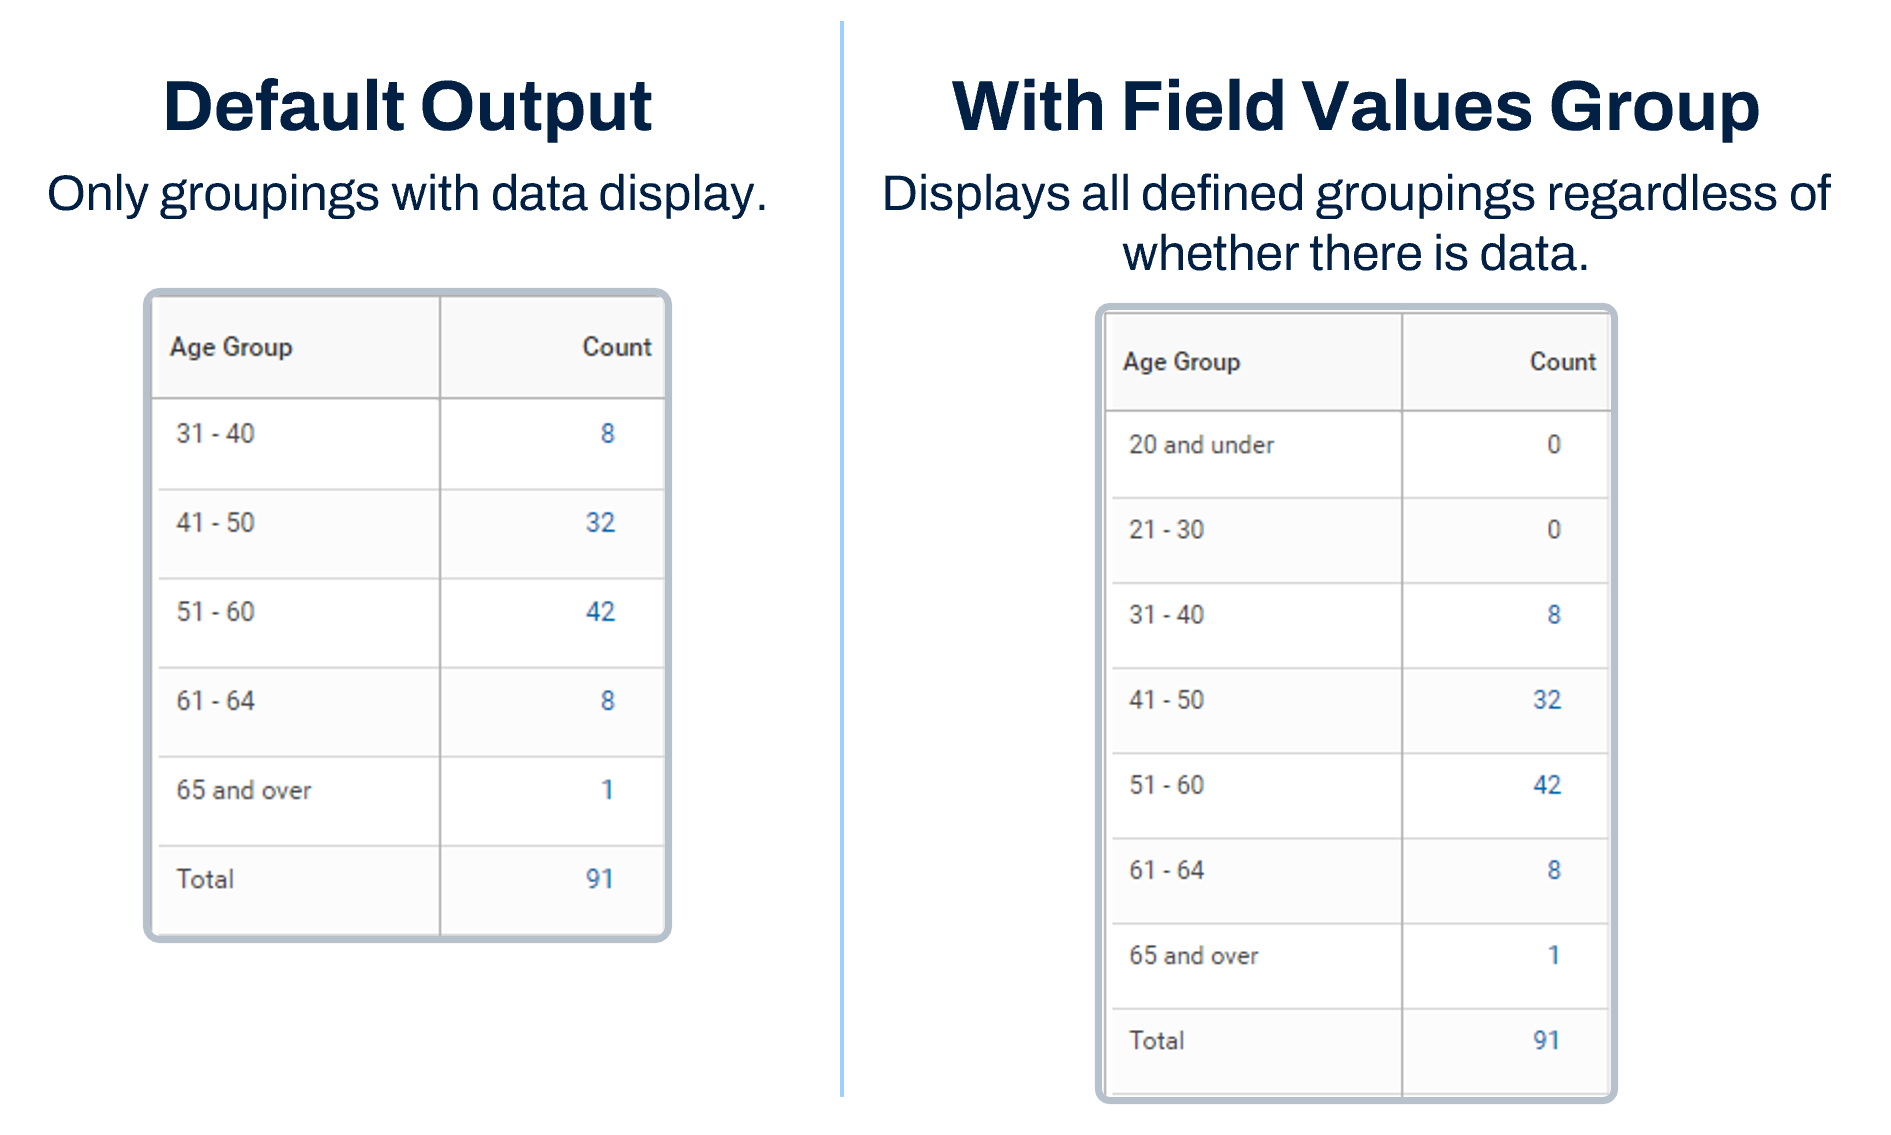
Field values groups are only possible for single instance type fields. Once created, use them across matrix reports where you use that business object.
Steps to Configure Field Values Groups
The steps to configure field values groups are as follows:
- In either the Row Grouping or Column Grouping of a matrix report definition, select theGroup by Fieldfor which you want to configure a field values group.
- In either the Sort Rows or Sort Columns field, selectSequence Defined In Field Values Group.
- In the Options field, either select anexisting field values groupor create a new one by selectingCreate>Create Field Values Group. If creating a new field values group, specify the values for the select business object in the order you want the values to appear in the matrix report. Only the field values specified display in the matrix report. Also, the field values display all defined groupings regardless if there is data.
- Enter a name for the field values group.
- On the Field Values tab, in the Field Values and Order to be Displayed section, selecteach Instance (value)you want to display on the report, and adjust the order of the instances as required.
Chapter Summary
Key Takeaways:
- Matrix reports allow for grouping, aggregation, and interactive drilling across different dimensions.
- There are many options for modifying the format of rows and columns to include maximums, field values groups, percent of totals, nested levels, and facet filters.
- You can configure drill down details to allow further insight into the data.