
Reporting with HCM Data
Overview
In this chapter, we will use HCM scenarios to review a few key concepts relating to custom reports that you will apply throughout this class. We will also learn some new concepts relating to reporting on HCM data, including extending data sources, working with change detection, and reporting on payroll data.
Objectives
By the end of this chapter, you will be able to:
- Recall and apply essential concepts pertaining to Workday reporting.
- Identify the common Workday HCM data sources.
- Extend an indexed data source to improve report performance.
- Use calculated fields to show the previous value of a business process event.
- Create a calculated field that determines the value of a field as of a specified date using the Lookup Value as of Date function.
- Use Workday-delivered payroll reports and dashboards.
HCM Data
During this class, we will work a range of use cases that use HCM data. Many times, this will involve data relating to the Worker business object, but can also involve non-worker data such as staffing events, job profiles, etc.
You can use the
Workday Standard Reports
report as a resource when creating Workday HCM custom reports. This report displays a list of all Workday-delivered reports. It includes the description, domain security (if you have permission to the domain), and scheduling access.For more information:
- From the domain's Related Actions, select Domain > View Security Policy.
- In a Report Writer report, from the Report column's Related Actions, select Standard Report > Run.
To retrieve the desired results, run the
Workday Standard Reports
report and filter by one or multiple categories. Categories include:- Hire
- Job Change
- Jobs & Positions
- Positions and Headcount
- Staffing History
- Staffing Reports
- Worker Data
- Worker Data History
- Workforce Planning
You can also use the
All Workday-Delivered and Custom Reports
report to view all custom, and standard Report Writer and XpressO reports in a business view.Top Worker & Position Reports
These Workday-delivered reports can help the following roles get more information on workers and positions: HR Administrator, HR Analyst, HR Auditor, HR Executive, and HR Partner.
Reminder
: You cannot copy or modify Xpresso reports.Delivered Report | Description | Report Type | Securing Domain |
|---|---|---|---|
Directory by Location - Indexed | View a list of workers by Location. | Report Writer | Worker Data: Worker Summary Reports |
Directory by Job Profile - Indexed | View a list of workers by Job Profile. | Report Writer | Job Directory |
Directory by Job Family Group - Indexed | View a list of workers by Job Family Group. | Report Writer | Job Directory |
Open Positions by Organization, Worker Type, and Date Range | View open positions by Organization, Worker Type, and Date Range. | Report Writer | Reports: Open Positions |
Active Employees - Indexed | View a list of all active employees in all organizations. | Report Writer | Worker Data: Active Employees |
Find Workers | Indexed report with facet filters to view and search for groups of workers. | Report Writer | Search: Find Worker |
Worker Details | This standard search report returns all workers. You can filter workers by location, supervisory org, and job profile. | Report Writer | Worker Data: Active and Terminated Workers |
Headcount by Worker Type | This report is used to deliver Workday usage metrics for user accounts. | Report Writer | Worker Data: Worker Summary Reports |
Trended Turnover Summary | Displays turnover information for selected organizations and is based on the Trended Workers data source. The period for turnover analysis is a three-year window from current date. The turnover analysis is always based on Primary Position information. | Report Writer | Trended Worker Data |
FTE Report | View a count of FTE (full-time equivalent) workers by organization. Enables you to drill down on the numbers to create summarizations by category. Shows how many allocated FTE positions or jobs are filled by workers in an organization. | Xpresso | Worker Data: Headcount Reports |
New Hire Staffing and Compensation | View job and compensation information for new hires in one or more organizations. | Xpresso | Worker Data: Staffing Reports with Compensation Data |
View Employee History | View job profile changes, performance reviews, and compensation history for a single worker. | Xpresso | Worker Data: Historical Staffing Information |
Reporting Terminology
To use Report Writer, you must understand the terminology involved, especially when it comes to business objects and data sources.
Workday stores your data in business objects, similar to database tables or worksheets in Excel. Just as a database table or worksheet has columns and rows, a Workday business object has fields and instances.
The report data source provides a view into the primary business object (PBO). This object gives you access to class report fields (CRFs) as well as links to related business objects (RBOs).
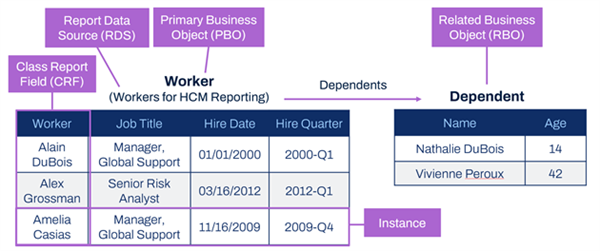
Term | Definition |
|---|---|
Primary Business Object | The main business object for the report. It holds the data that displays in your report. The primary business object determines what fields are initially available to include in the report. |
Related Business Object | Objects that have an association with the primary business object. These can have a 1:1 or 1:M relationship with the primary business object. A field on the primary business object links the two business objects together. |
Report Data Source | Workday delivers data sources for some business objects. You can think of the data source as the 'view' or 'starting filter' for reporting on the given primary business object. |
Class Report Fields | When working with Workday custom reports, you can select available fields (depending on your security). These fields can be Workday-delivered fields, calculated fields, or custom fields. |
Instances | Instances of a business object in Workday are like rows in a table or spreadsheet. Each instance represents a unique occurrence of that type of object, such as a given organization or worker. |
Report Data Sources
Workday defines and delivers the data sources in the system. Workday delivers zero, one, or multiple data sources for each business object. The report data source is the view or selection of instances of a given primary business object; this is essentially the starting data for your report.
With the exception of composite reports, you must select a single report data source when creating a report. This determines the primary business object for the report. The report displays one row for each instance of the primary business object.
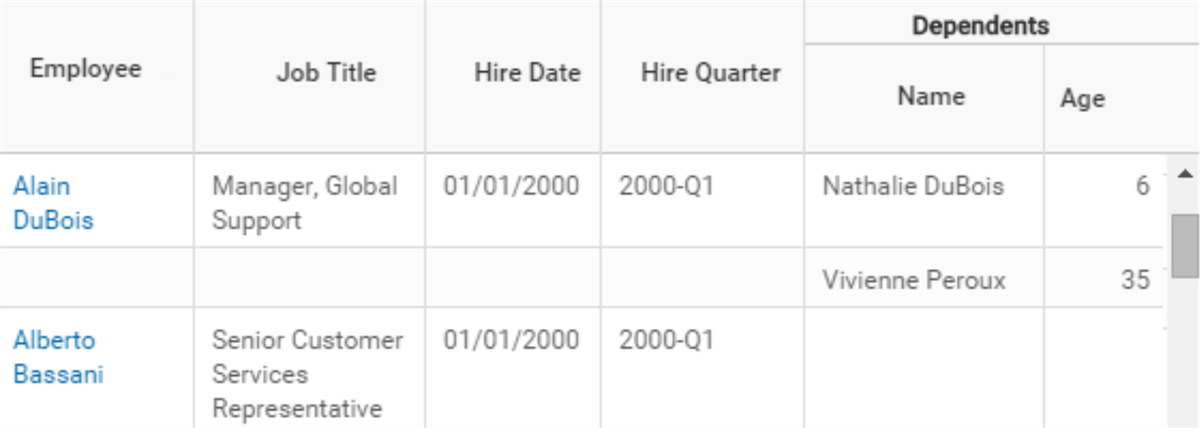
For example, let's say you create a report with All Active Employees as the report data source. The primary business object for the report then is Employee. The report shows one row for each instance of Employee. Notice that Alain DuBois only appears once in the table. His dependents display as "sub-rows" and appear as a group under the Dependents heading.
If you create a report with All Dependents as the report data source, then the primary business object is Dependent. The report shows one row for each instance of Dependent. Notice that Alain DuBois appears twice in the table (once for each dependent).
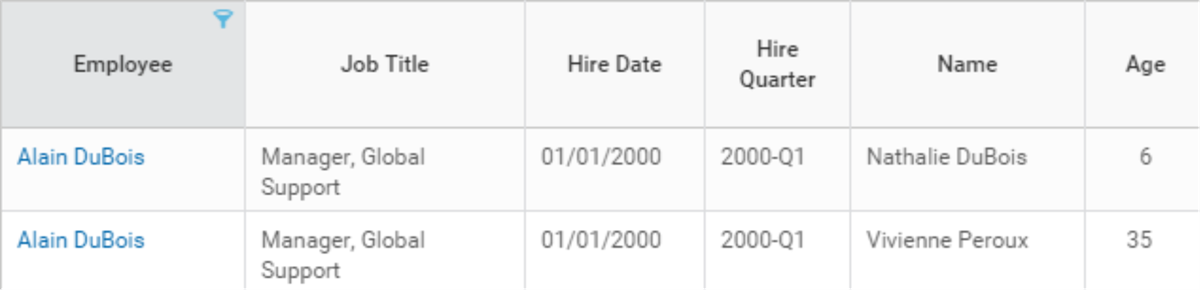
Both data sources let you access the same information, but the information displays differently. You need to understand how users want to view, sort, and filter the data in order to pick the best report data source for the report.
Each data source has an association with a primary business object, and has its own security. The defined access for a data source controls whether a user can create or run a custom report that uses that data source. Each data source has a list of permitted security groups. You must have access to a permitted security group to create a report using the data source or run the report. In addition, you can only share a report with users who have access to the report's data source.
There are four types of data sources:
- Standard
- Indexed
- Business View
- Prism
Standard Data Sources
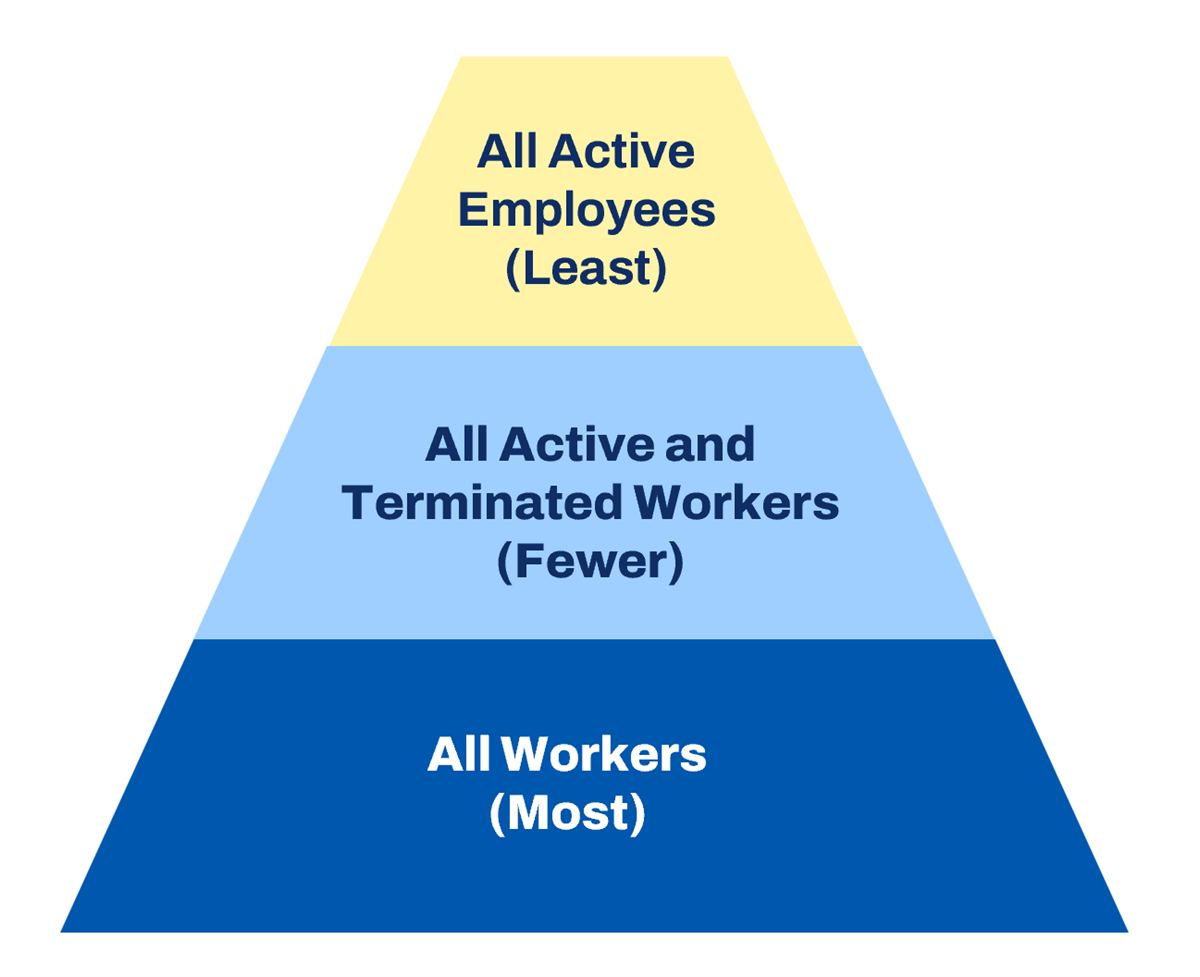
Most data sources in Workday are standard data sources. A given Workday business object can have several standard data sources associated with it, each representing a different filter or selection into instances of that object. Think of the data source as a starting filter. Choose the data source that returns the smallest dataset that still includes all needed data. This is more efficient than using a data source that returns a larger dataset and applying filters to only display a subset of the data.
A data source can contain all instances of the primary business object (e.g., All Workers), or it can have built-in, Workday-defined filtering logic (e.g., All Active and Terminated Workers). If the data source has built-in filtering, the filter comparison value is either built into the data source (e.g., All Active Employees) or displays as a user prompt. In the prompt, the user enters the comparison value when running the report (e.g., Employees by Organization).
The following example shows different standard data sources for the Worker and Employee business objects. The All Workers data source returns all active, terminated, and future workers. The All Active and Terminated Workers data source returns active and terminated workers, but not future workers. The All Active Employees data source returns active employees, but not contingent, terminated, or future workers. For optimal performance, choose the data source that returns the smallest dataset that contains all needed data. If you only want to report on active employees, then choose the All Active Employees data source for a more efficient report.
Standard Data Source Performance Considerations
When selecting a data source for your report, be aware of your report's performance. There are a wide variety of standard data sources that range from very broad to very specific. However, all standard data sources cause your report to run slower than an indexed data source does. Therefore, try to select an indexed data source if it includes all the fields you need. This is especially true when reporting on large volumes of data, such as all workers in your organization.
Indexed Data Sources
Indexed data sources are a special type of data source optimized for performance, aggregation, and faceted filtering on large volumes of data. Try to use these whenever possible to get the best performing reports.
When you create a custom report using an indexed data source, a prompt enables you to select from a list of predefined filters (if available for that indexed data source). Data source filters are secured so users can only use filters they have access to.
To gain the performance benefits of indexed data sources, use indexed delivered fields. Nonindexed fields are usable but will not realize indexing benefits. Additionally, fields may be indexed for different purposes. The biggest impact to performance is using a field for grouping, aggregation, or filtering that is not indexed for those purposes. Nonindexed fields in detailed reports do not have as great an impact to the overall performance.
The following is a sample list of indexed data sources available in Workday:
|
|
Just like with standard data sources, a given Workday business object can have multiple indexed data sources associated with it. Each indexed data source provides a different filter into instances of that object. For example, the Journal Line business object has two indexed data sources: Journal Lines and Journal Lines for Financial Reporting. The Journal Lines data source returns more instances than the Journal Lines for Financial Reporting data source. For optimal performance, you should choose the data source that returns the smallest dataset that contains all needed data.
Business View Data Sources
A business view data source is a Workday-delivered data source that blends and curates data from multiple underlying Workday-delivered data sources, known as component data sources. This simplifies reporting by presenting a focused and user-friendly perspective on your data.
Key characteristics of a business view data source include:
- Data Blending: It can either join or union data from its various component data sources.
- Curation: It curates the final list of available fields from the component data sources, which can reduce complexity and potential confusion for report writers.
- Filtering: It can filter the instances (records) of data that are returned.
- Unique Primary Business Object: Although it pulls from multiple sources, the business view data source has its own primary business object, which typically shares the same name as the data source itself.
You can customize these data sources to fit your organization's specific needs using the
Configure Delivered Business Views
task. This task allows you to add, change, hide, or delete fields and update field descriptions.Supported Functionality
You can use business view data sources to create the following types of custom reports, though some limitations apply:
- Advanced: Most features are supported, with the exception of Facets, Enable as Web Service, Enable for Prism, and Enable for Worksheets.
- Matrix: Most features are supported, but Facets, Lookup Prior Value calculations, and Enable for Worksheets are not. Drill Down and Drill By features require configuration.
- Simple: All features are supported.
Business view data sources cannot be used for:
- Scorecard reports
- Drill-to reports
- Workday Query Language (WQL) queries
- Dashboards
- Discovery boards
Prism Data Sources
A Prism data source is a type of data source that gets its data from a Prism Analytics table or dataset. It is typically used to blend Workday and non-Workday data for analysis.
Key characteristics of a Prism data source include:
- User-Created: Prism data sources are created by users within your organization, not delivered by Workday.
- Standalone Primary Business Object: They have their own primary business object that is not linked to other business objects in Workday.
- Can Be Inactivated or Deleted: You can make a Prism data source inactive, which empties it and makes it unavailable for reporting, or you can delete it entirely if it's not in use.
- Security: Access to Prism data sources is controlled by security groups.
- Limited Functionality: They support a more limited set of report types, field types, and calculated fields compared to standard Workday data sources.
Additional Training
:
You can find more information in the Prism Analytics for Administrators
course.Workday HCM Data Sources
There are many data sources in Workday that contain HCM data. When choosing a data source, consider the following questions:
Question | Considerations |
|---|---|
What fields do you need? | List all the fields you want the report to display. If you do not know the business object that contains these fields, use the Report Fields report to look up the fields. |
What business object should you report on? | Select the business object that contains the majority of the fields you want as the primary business object for the report. Then, you can use the Business Object Details report to find a data source. You can also run the Data Sources report and filter by category to help you find a data source. |
Do you want to prompt for effective date or entry date? | While this may seem like a decision you need to make later on, you want to consider this when selecting a data source. Not all data sources allow you to prompt for effective or entry date. |
Do you want to report on trends? | Not all HCM data sources will allow you to report on data trends (changes over time). Similarly, you also may not be able to report on monthly, quarterly, or yearly changes. |
Who needs access to this report? | Ensure that the target audience of the report has access to the data source and fields you use. |
Where will the report run? | Reports that run as worklets on a dashboard time out after 30 seconds, so it is important to consider performance when you select a data source. For scheduled reports or reports you run in the background, report performance is not as important. |
Workers for HCM Reporting Data Source
The Workers for HCM Reporting data source consolidates multiple data sources into this single data source. This data source allows multiple data source filter options. The data source filters have optional built-in prompts to save time while building custom reports. This indexed data source optimizes report performance by reducing the time needed to run a report. It is also extendable. Report writers can add calculated fields or nonindexed fields to the data source and have those fields indexed.
When you create a custom report using an indexed data source that requires a data source filter, Workday automatically populates the data source filter prompt. This feature is useful if report writers wish to add their reports to dashboards. If you use indexed data sources on dashboards, it reduces the chances of reports timing out. Additionally, report writers can use indexed fields in filters, prompting, column or row groupings, facet filters, and aggregation.
This data source accesses the Worker as its primary business object and returns one row per worker. It includes all active and terminated workers and has more than 10 data source filters (e.g., all active workers, all employees, all terminated workers, and workers by role).
More than 50 domain security policies secure this data source. Examples include:
- Person Data: Name
- Worker Data: Headcount Reports
- Worker Data: Historical Staffing Information
- Worker Data: Active and Terminated Workers
- Worker Data: Current Staffing Information
Workday might secure a data source and its filters by different domains. For example, a user could have access to the Workers for HCM Reporting data source, but cannot access the Workers by Role data source filter.
Limitations of the Workers for HCM Reporting Data Source
The Workers for HCM Reporting Data Source comes with certain limitations, including:
- You cannot prompt for effective date or entry date.
- You cannot report on trends.
- You cannot report on monthly, quarterly, or yearly changes.
- You cannot filter on an indexed object as a related business object.
- Filtering on a calculated field will affect performance.
Trended Workers Data Source
The Trended Workers data source accesses the worker as its primary object and returns multiple records for a worker. It includes all workers. It has built-in prompts for time series start and end dates. Use this data source when creating trending reports on worker. You can build many Workday HCM dashboards with this data source.
The following domain security policies secure this data source:
- Trended Worker Data
- Person Data: Ethnicity
- Person Data: Gender
Note
: You will need additional tenant configuration to use the Trended Workers data source.Other HCM Data Sources
This table lists other popular indexed data sources for HCM reporting:
Data Source | Description | Primary Business Object |
|---|---|---|
Positions for HCM Reporting | Accesses the position as its primary business object and returns two rows per filled position and one row per unfilled position. Only includes filled and unfilled positions. Does not include closed positions. For filled positions, one row references the position and one row references the position restrictions. For unfilled positions, the row references the position restrictions. | Position and Job - All Staffing Models |
Job Applications | Accesses the job application as its primary business object and returns one row per job application. Includes all job applications and referrals tied to a job application. This data source displays information on applications and candidates and applies contextual security. | Job Application |
Recruiting Statuses | Accesses recruiting status as its primary business object and returns one row per status. Includes all candidate stages and for all candidate job applications. This data source does not refresh in real time; expect data latency. | Recruiting Status |
Time Off - All Statuses for Active and Terminated Employees (Indexed) | Accesses the time off entry as its primary object. The time off entry object returns one row per time off line item an employee has requested and corrected. Includes all time offs (approved, not submitted, sent back, cancel, submitted, and denied) for each employee in all organizations that the user manages or supports. Includes time offs for active and terminated employees. Prompts the user at run-time for Organization, Include Subordinate, and Date Range start date and end date to automatically filter the report results. | Time Off Entry |
All Time Blocks and Time Off Entries | Accesses time block (coordinated) as its primary object. Displays time and time off entries by worker. | Time Block (Coordinated) |
Payroll Result Lines | Accesses the payroll result line as its primary object and returns one row per payroll result line. Does not contain built-in prompts, but you can add prompts by changing the default settings. This data source shows all payroll result line data. | Payroll Result Line |
Payroll Results | Accesses payroll result as its primary object and returns one row per payroll result. Does not contain built-in prompts. This data source accesses payroll result data. | Payroll Result |
Learning Content | Returns all searchable content, which includes courses, offerings, and lessons. | Learning Content |
Learning Enrollments | Accesses time learning enrollment as its primary object. A data source for learning enrollments | Learning Enrollment |
Data Sources Report
You can explore all data sources by running the
Data Sources
report. Filter by Data Source Type contains Indexed to find all indexed data sources.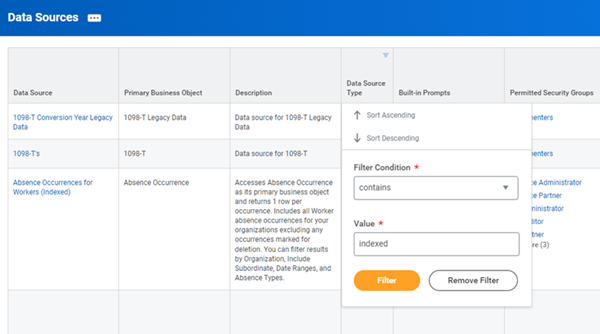
On the Data Sources report, filter the Data Source Type column by contains indexed.
Tip
: After you decide on a data source, use the View Indexed Fields for Data Source
report to find indexed fields to use on your report.Extended Indexed Data Sources
You can extend some indexed data sources to include additional nonindexed or calculated fields. These newly added fields will then become indexed as well. The ability to extend indexed data sources and add new fields for indexing provides you with some key benefits:
- Add nonindexed fields to a report without negatively impacting performance.
- Create calculated fields for a report without negatively impacting performance.
- No need to rebuild your reports; After extending a data source, easily edit any reports using that data source to add the newly indexed fields.
To extend a data source, use the
Maintain Custom Data Source
task. From here, you can select Create Data Source Extension
to select a data source to add additional fields to. Not all data sources are available for extension. Here are a few currently available:- Employee Reviews - Indexed
- Find Candidates
- Indexed Positions and Jobs - All Staffing Models
- Job Applications
- Position for HCM Reporting
- Recruiting Statuses
- Workers for HCM Reporting
After adding your fields, return to the
Maintain Custom Data Source
report and select Submit for Approval
. This initiates the Custom Data Source Extension Approval Event business process, which you can configure to include any necessary reviews and approvals to suit your business needs.Note
:
Extended indexed data sources have a limitation of 20 fields per eligible data source.Field Suitability
Not all fields are suitable for indexing. Use the
Field Suitability for Business Object
report to check if a nonindexed field is suitable for including in an extended data source. This report will display all of the fields on a specified business object, indicating if the field is suitable for indexing or not. If not, the report also displays alternate fields that return the same or similar data that are suitable for indexing. This is a useful report to reference before trying to add fields to an extended data source.Review: Filtering, Prompting, and Sharing
Filtering
The Filter tab allows you to filter the primary business object. A filter consists of one or more filter conditions. Define each condition in a row of the filter grid. You can filter on any field from the primary business object or Global business object (global fields). Filter fields do not need to display on the report output.
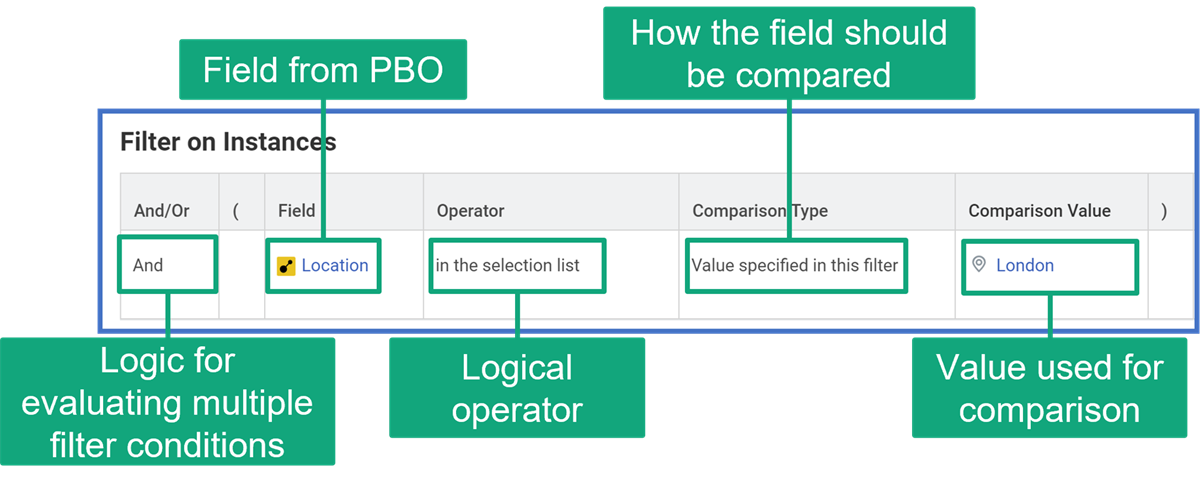
Components of the Filter on Instances grid
These are the options available when defining a filter:
Option | Description |
|---|---|
And/Or | Enables you to specify how multiple filter conditions should evaluate. Selecting And indicates that each business object instance must satisfy all conditions in your filter criteria to display in the report. Select Or to indicate that each business object instance must satisfy at least one of the conditions to display in the report. |
Parentheses | Some report types, like Advanced, allow you to use any combination of And and Or conditions within a filter. You can use parentheses to group conditions together and control the condition evaluation sequence. |
Field | Specifies the field to evaluate. |
Operator | Specifies the logical operator in the filter condition. The available choices depend on the field type. |
Comparison Type | Specifies how the system should compare the field. The options are:
|
Comparison Value | Specifies the value to compare to the Field value, or the user-selected prompt value. The ability to enable this field and available choices depends on the Field type, the Operator, and the Comparison Type. |
Prompting
You can use prompts in your filters and subfilters instead of hardcoding filter values. Prompts provide more flexibility because users can specify the criteria for the report each time it runs.
Configuring Prompts
You can configure the prompt settings on the Prompts tab.
The Instructions field lets you specify information to display on the user prompt.
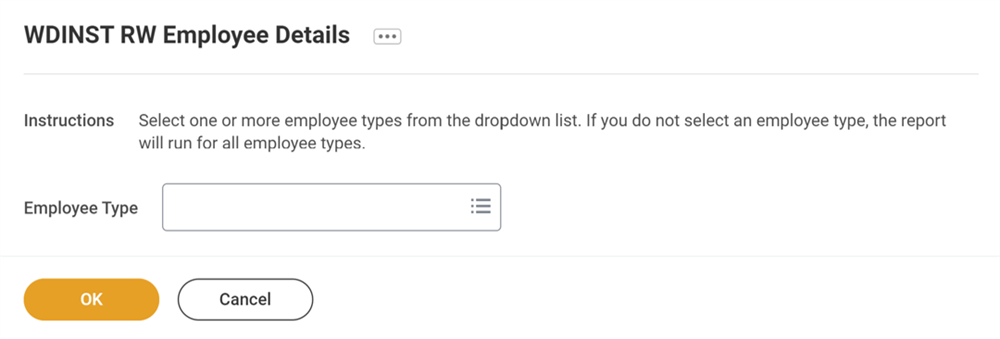
Some fields in Workday come with built-in prompts that automatically appear on your report if you add the field to your report definition. The Populate Undefined Prompt Defaults checkbox on the Prompt tab lets you quickly populate any prompt defaults. Select this checkbox to automatically add any undefined prompts to the Prompt Defaults grid.
The Display Prompt Values in Subtitle checkbox lets you show or hide the prompt values at the top of the report output. In the Prompt Defaults grid, you can use the Do Not Include in Subtitle setting to exclude specific prompt values from displaying in the subtitle.
You can specify options and default values for your prompt fields in the Prompt Defaults grid.
These are the options available when defining prompt defaults:
Option | Description |
|---|---|
Field | Specifies the field for which you want to enter prompt data. |
Prompt Qualifier | If you define a data range or a dataset prompt for this field, you must choose the Prompt Qualifier to identify which prompt you want to override. |
Label for Prompt | Overrides the label for this prompt when you run the report. |
Default Type | Determines the default values to use when the report runs. The options are:
|
Default Value | This specifies one or more default values or the field to use to determine the default prompt. This function goes with the Specify default value and Determine default value at runtime options. |
Required | Requires the user to enter a prompt field value. The field cannot be blank when the report runs. |
Do Not Prompt at Runtime | Suppresses the display of the prompt for this field. The system uses any default values automatically, skipping any interaction for the prompt for this field. |
Do Not Include in Subtitle | Suppresses the display of the prompt values from the final report output. Any values the user selects from prompts appear below the report title (above the detail data) by default when the report runs. |
Do Not Auto Fill for Related Tasks | Clears an incorrect prompt auto fill when running reports. Does not need to be selected unless a prompt is incorrectly auto filled. |
Control Prompt Values | Allows users to configure pop-ups to apply filtering criteria to prompt results and specify parent fields to create mapping between prompts. This feature enables control over the range of values a prompt allows at runtime, such as limiting prompts or filtering for date ranges. |
Resource
:
For more information on configuring the Control Prompt Values option please sign into Community and search for Report Prompt Control
. Select the release note.Using Prompts in Filters and Subfilters
You can use the Filter and Subfilter tabs to control which fields should prompt the user for a value at runtime. When defining a filter or subfilter condition, there are two comparison types that you can use to prompt the user for a value.
Comparison Type | Description |
|---|---|
Prompt the user for a value | Workday uses the entered prompt value to filter the report. If this prompt value is blank, the report filters by a blank value. |
Prompt the user for a value and ignore the filter condition if the value is blank | With this option, if the prompt value is blank, the report ignores the filter condition. |
Sharing
Custom reports are not shared by default. A custom report is visible only to its owner (and to users who have access to manage all custom reports). The Share tab lets you share a custom report with authorized users. You can share a custom report with all users who have access to the report data source and data source filter. You can also share a report with specific groups and users who have access to the report data source and data source filter. The domain securing the custom report's data source determines which security groups you can share the custom report with.
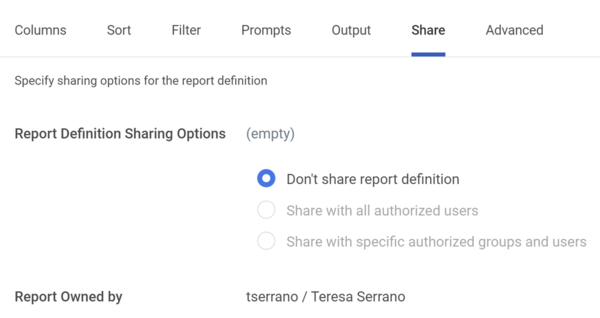
Sharing options
Security Note
: You can control if report writers can use the different sharing options. Report writers must have access to these security domains to use the sharing options:- Domain: Report Definition Sharing - All Authorized Users
- Domain: Report Definition Sharing - Specific Groups
- Domain: Report Definition Sharing - Specific Users
When you share a report, users can run the report, but they cannot edit it. Only the report owner (and those who can manage all custom reports) can edit custom reports. However, a shared user can view the report definition and copy the report definition if the shared user is also a report writer.
Note
: You can use the Start Proxy task to easily test the report as a shared user. This lets you verify that a user can view the appropriate data in the report.Data Source and Data Source Filter Security
Security domains contain both report data sources and data source filters. You need to identify which domains contains a data source and data source filter in order to determine if a user has access to report data. Using that information, you can grant the user security access to the necessary domain to display the report data. You can use the
View Security for Securable Item
report to view the security configurations for any object in the Workday system. This includes data sources and data source filters.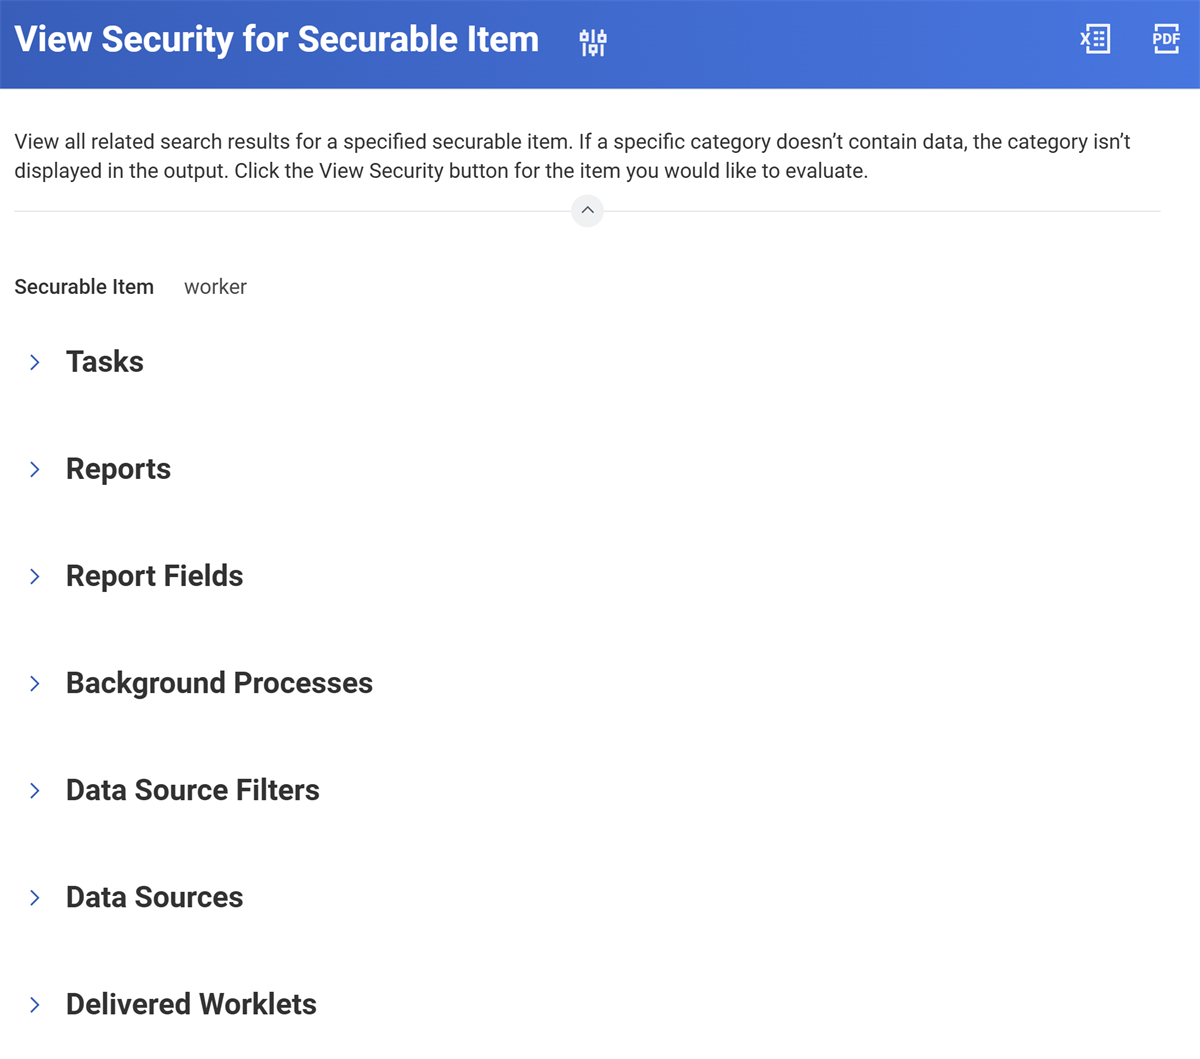
Remember, to share a report with a user, they must have security access to both the report data source and the data source filter used in the report. The "Share with specific authorized groups and users" option prompts you to select which authorized security groups or users you wish to share the report with. Only security groups and users authorized to access both the report's data source and data source filter are selectable from these prompts.
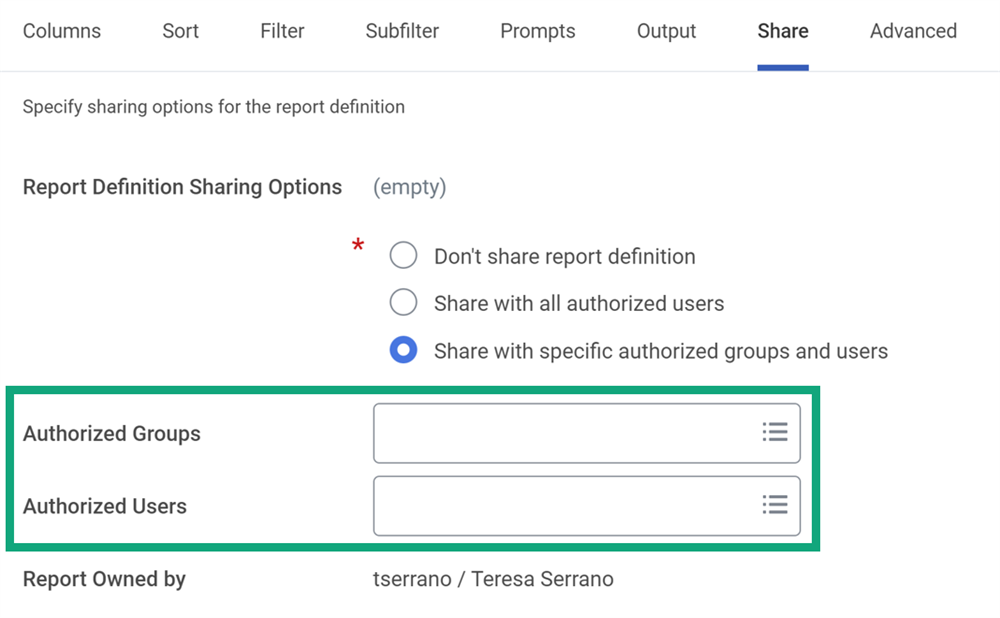
Note
: You may receive an error when sharing a report with an allowed security group if you later change the data source filter for the report. This happens when the security groups you have selected do not have access to the newly selected data source filter.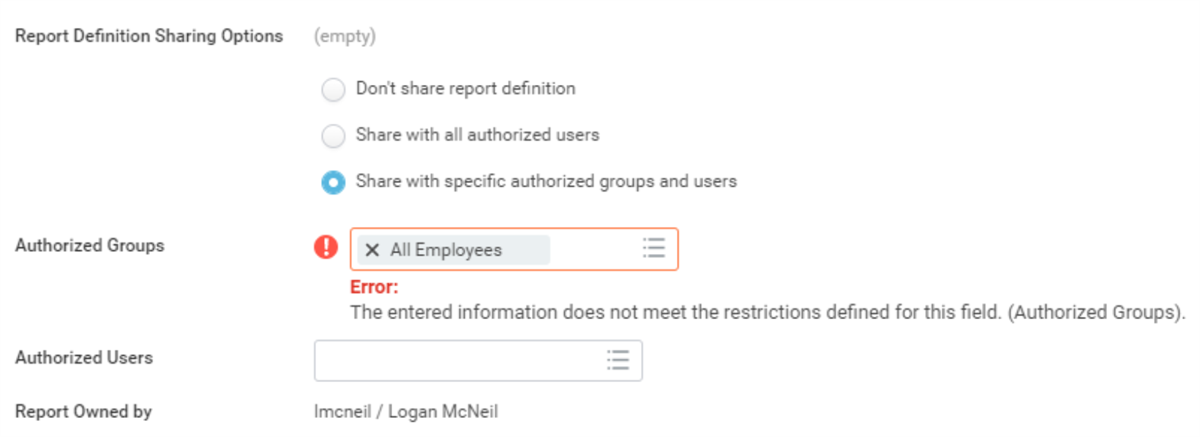
Matrix Reports
The Matrix report type provides the foundation for custom analytics and interactive reporting in Workday. It allows for grouping, aggregation, and interactive drilling across different dimensions. Doing so enables the user to build their own analysis matrix cubes to gain new insights into the data and take action on the results.
Matrix reports are ideally suited for:
- Aggregating or summarizing numeric data.
- Modifying rows and columns at runtime for a different view.
- Drilling into summaries and details.
- Taking actions on insights.
The main construct of a matrix report involves:
- Grouping instances of the primary business object to define the initial summary matrix in row and column groupings.
- Summarizing aggregations for each grouping.
- Drilling into the summarizations for further analysis. Report users can view the data by other fields and access detail data behind the summarizations.
Groupings
Row and column groupings are the starting summary matrix for the report. Specify at least one row grouping and one summarization.
A grouping may be a single instance, text, Boolean, date, or numeric field. You may use nested levels by grouping more than one dimension. Column groupings are optional.
For each grouping, specify a sort option. By default, totals determine sorting (in descending order based on the first value in the summarization grid). Alternatively, you can sort alphabetically, based on a logical sort, or based on a defined field value group.
Summarization Types
Matrix reports allow you to configure summarizations for your report's numeric or currency data. The Summarization Type enables you to specify the aggregation method applied to the field. The results of the aggregation method are displayed in the matrix cells of the report output. The default summarization type is Count. Summarization options include:
Term | Definition |
|---|---|
Average
| Averages the values of a field for defined grouping. |
Calculation | Create your own arithmetic calculations on the other summarizations generated in the report. For example, using a calculation, you can subtract the Minimum summarization value generated from the Maximum summarization value generated. Matrix report summary calculations are unique to the report. You can maintain and edit these calculations like report-specific calculated fields. |
Count | Counts the number of values (instances) for a defined grouping. |
Count Distinct Instances | Counts the distinct number of instances based on a specific field. |
Maximum | Displays the maximum value of a field for defined grouping. |
Minimum | Displays the minimum value of a field for defined grouping. |
Percentile | Displays the percentile. Selecting the 50th percentile displays the median. |
Sum | Adds the values of a field for defined grouping. |
If using an indexed data source, when choosing fields to summarize, use the
View Indexed Fields for Data Source
report or preview the field. Then, expand the Indexing Information section to determine if the system indexes a given field for Aggregation. If not, you will notice a performance alert (not error) in the report. Performance improves when indexed fields are at the top of the group by list.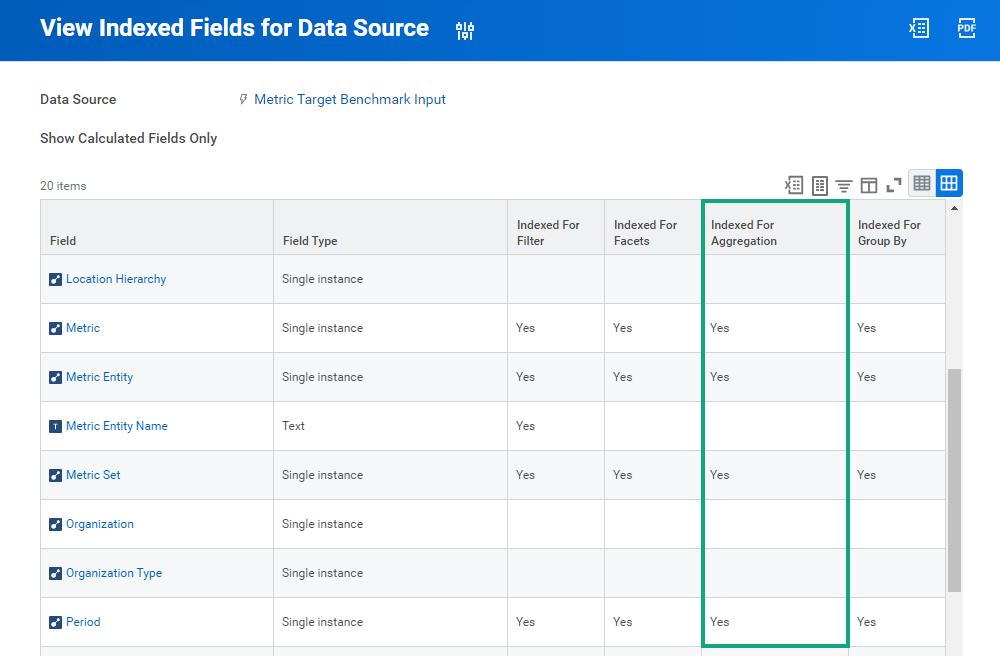
A runtime error appears when attempting to run a shared matrix report and the user does not have the following "view" security permissions:
- Row grouping
- Column grouping
- Summarization field
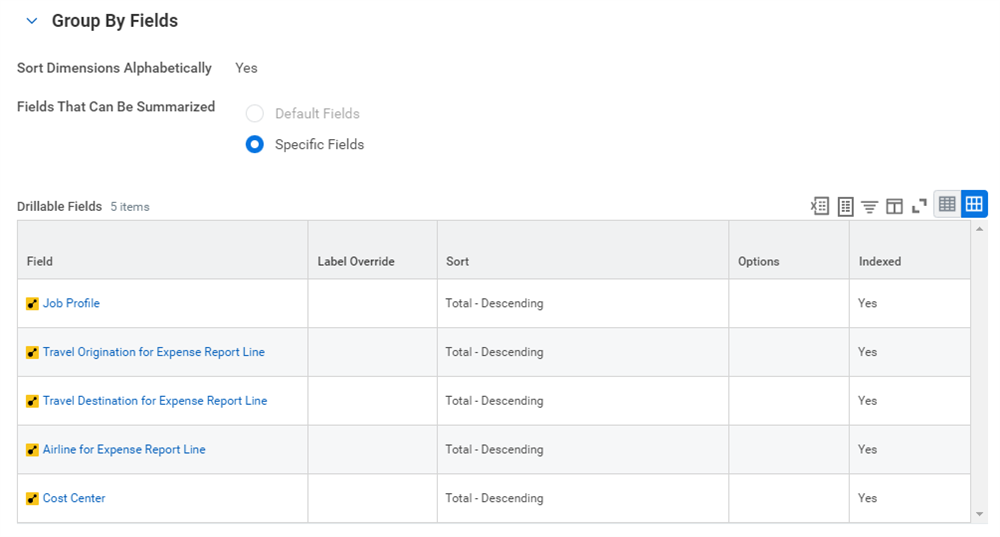
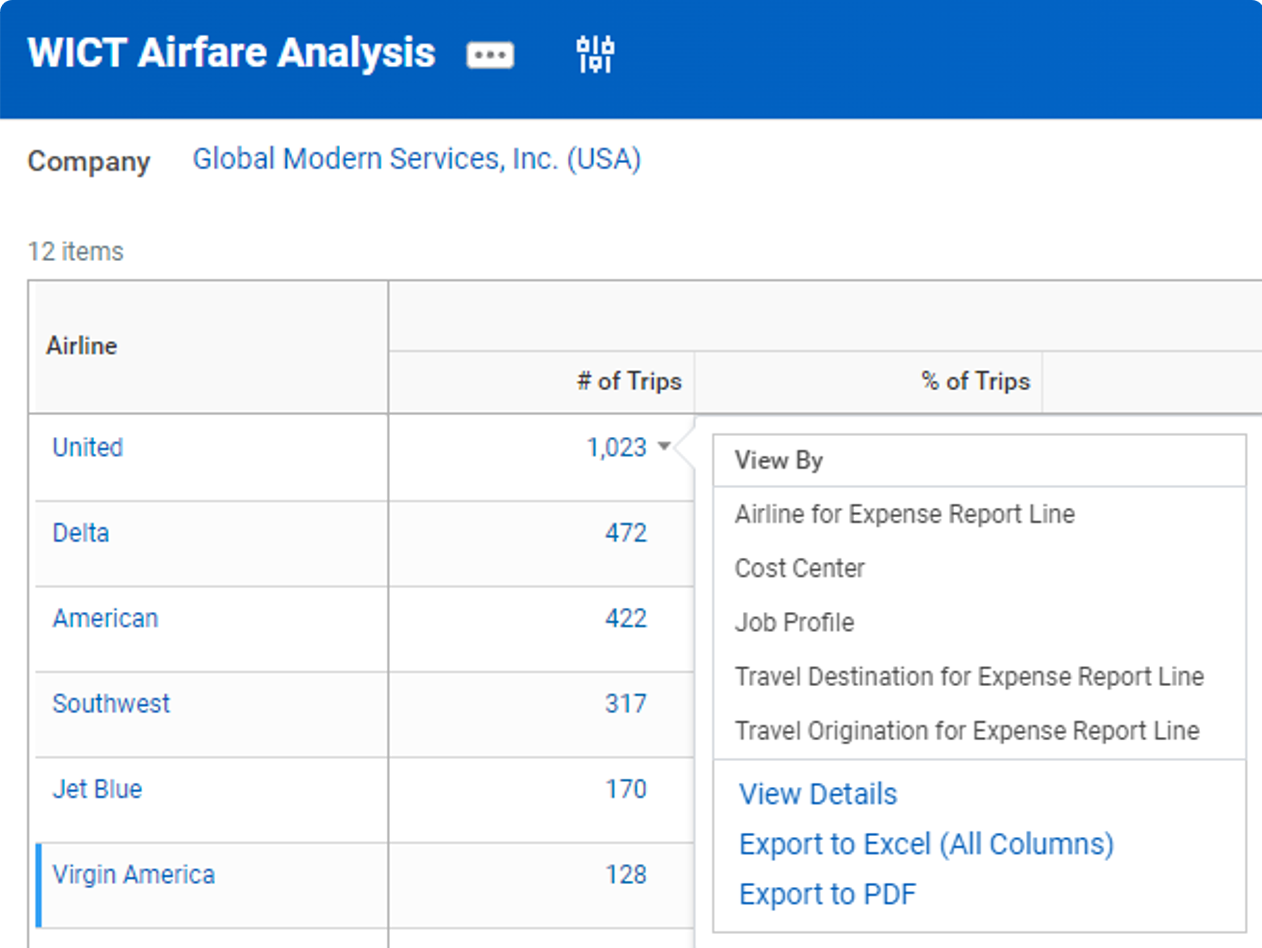
Drillable Fields
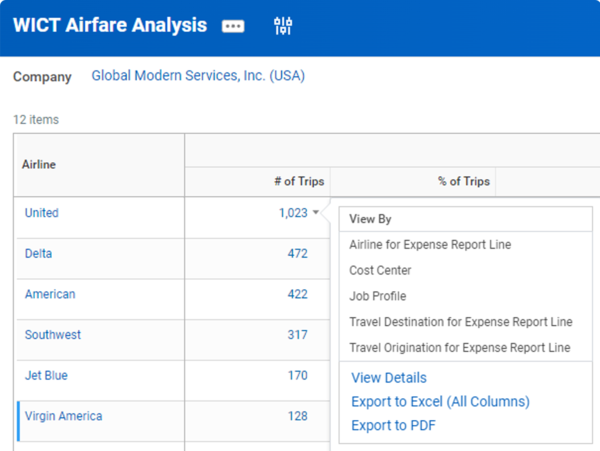
You can define fields by which the user can further group the data. These fields display when the user selects the View By option on a summarization. Users can drill on up to two dimensions when viewing the report output. Default fields display automatically if you do not define those fields. Workday determines the default fields for each business object used in a matrix report.
Selecting specific fields rather than the default allows you to configure a controlled subset. It is a good practice to configure specific drillable fields because the default fields may change from one Workday release to the next.
Detail Data
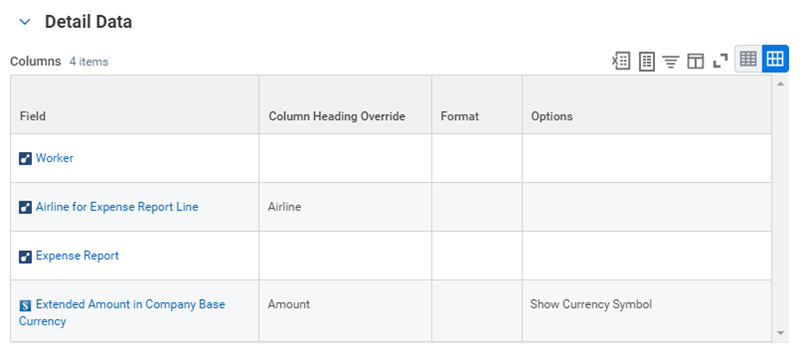
Configure which fields display when the user selects the View Details option or select a summarization value directly.
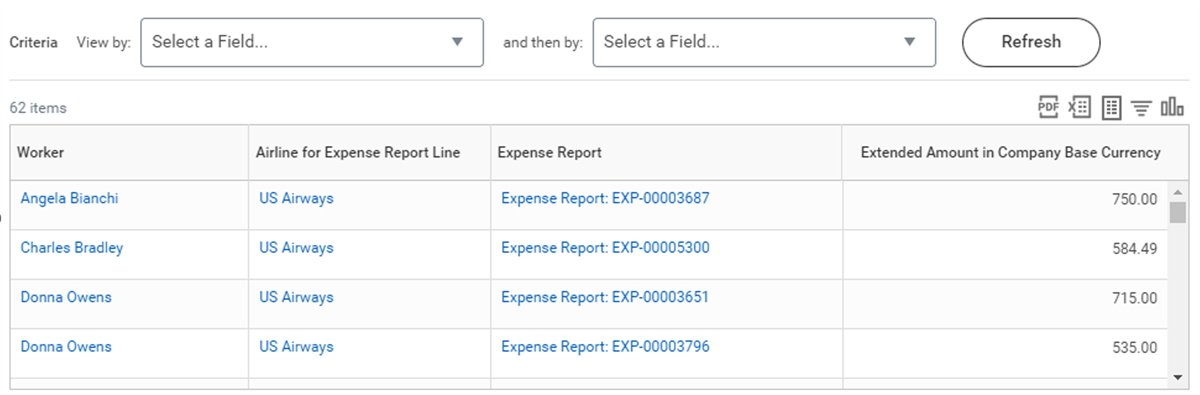
Reporting on Business Process Events
Completed Staffing Events for HCM Reporting Data Source
The Completed Staffing Events for HCM Reporting data source accesses the staffing event as its primary object and returns one row per staffing event. It includes all staffing events for all organizations that the user manages or supports. It does not contain any built-in prompts.
The following domain security policies secure this data source:
- Worker Data: Headcount Reports
- Audit: Compensation Overall
- Worker Data: Historical Staffing Information
- Regulatory Reporting - USA
- Regulatory Reporting - Global
- Worker Data: HR Partner Hub
Reporting on Business Process Events
You can future- or past-date system changes because Workday updates data using effective-dated business process transactions or events. The data sources that report on these system events use the Action Event business object. You can also use specific event objects and data sources for specific types of events.
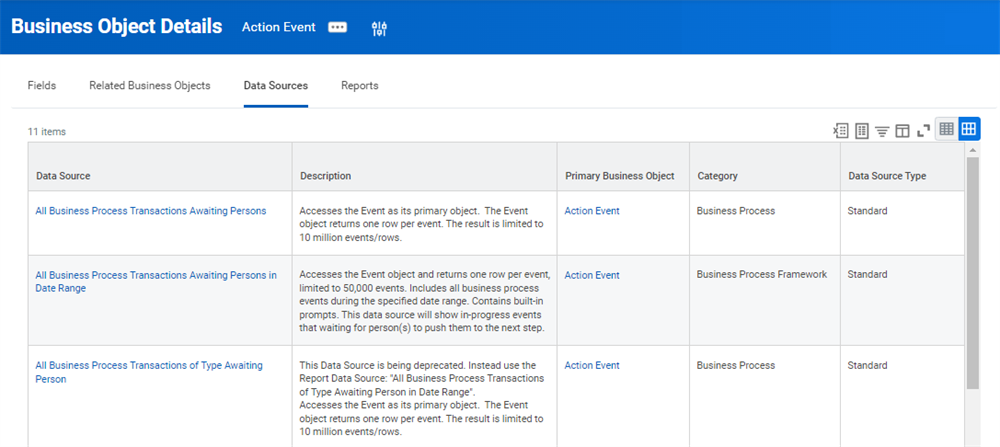
Business Object Details report for the Action Event object and its data sources
Run the
Business Object Details
report for event objects of interest. From here, you can determine available fields, object relationships, and existing reports using the business object. For example, when writing a report on events, you can use the Event business object as the PBO of your report to capture event information. You can also write a report using another business object, such as Worker, as your PBO. Then, include the Event business object as an RBO on your report to include event data.You can create a calculated field or report on a business process event that returns a blank value. For example, you can report on the Supervisory Organization, Cost Center, or Manager for a terminated or future-dated worker. That worker might not have a Cost Center or Manager assigned as of the reporting date. In such a situation, you can create a calculated field that returns the most relevant values. For example, you can create a calculated field that returns a worker's supervisory organization as of today. You can stipulate that if the value is blank, the calculation returns the Supervisory Organization as of their termination date.
Reporting on Events: PBO vs. RBO
When defining a report on events, use the Event business object as the primary business object or as a related business object to capture event information. For example, you can directly report on the Employee Compensation Event business object as the primary business object. Or, as demonstrated below, report on the Worker business object as the primary business object to get the worker's compensation history as a related business object.
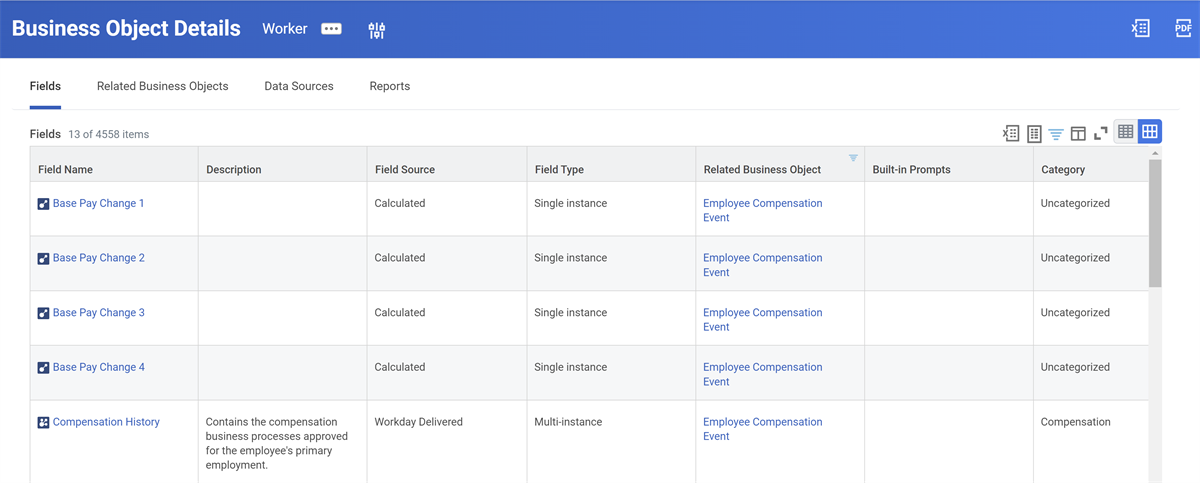
Screenshot of the Worker business object containing fields from the Employee Compensation Event RBO
Each worker on the Worker business object can link to events on various business objects related to Worker such as:
- Compensation events
- Benefit changes
- Personal information changes
Current and Proposed Values
Event objects consist of current and proposed values or attributes, such as the Supervisory Organization and Job Profile on the Worker object. These values provide information about:
- What happens in an event.
- Field values coming into the event.
- Field values after the event is complete.
In the image below, notice that these values exist as separate fields. Fields with the "Current" label represent the value coming into the event - just before the event changes. Fields with the "Proposed" label represent values for the changes in the event.
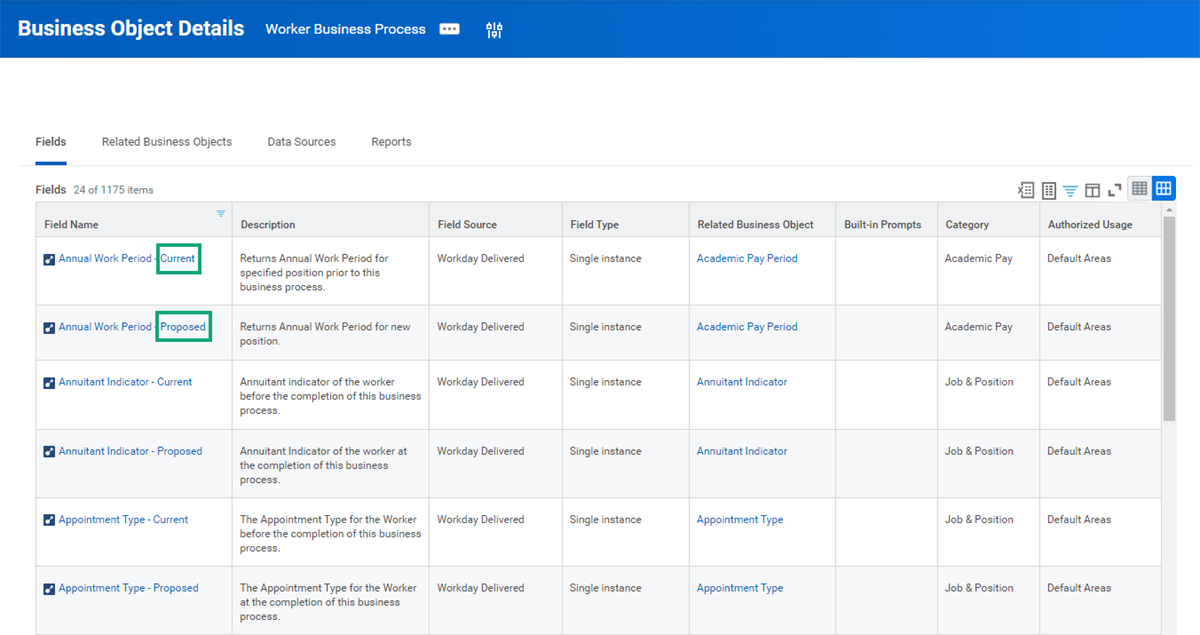
Screenshot of the Worker Business Process business object containing fields for current and proposed values.
Reporting on Change Detection
Lookup Value as of Date
The Lookup Value as of Date function determines the value of a field as of a specific effective or entry date. You can retrieve a field's effective value as of a specific date for business object fields that support effective-dating. Also, you can retrieve a field's latest value entered on or before a specific date. Or, you can do both. For business object fields that do not support effective-dating, you can retrieve a field's latest value entered on or before a specific date.
For example, assume the data entry date for an employee's proposed salary change is on March 15. That salary change may take effect retroactively on March 1, or on March 15. Or, the change could take effect in the future - on April 1. In any case, you can use the Lookup Value as of Date function to return the correct value.
In the field configuration, define the Effective Date to return the value of the field as of that specified date. You can also set an Entry Date to return the latest value of the field entered on or before that specific date. Field configuration determines if you can use the Lookup Value as of Date function to find the value. Doing so as of the effective date (March 16), the value entered before March 15, or both.
In the example below, we use Lookup Value As Of Date to get the position count effective on the last day of the last calendar quarter. Each time the report runs, it provides the updated position count we need for our analysis.
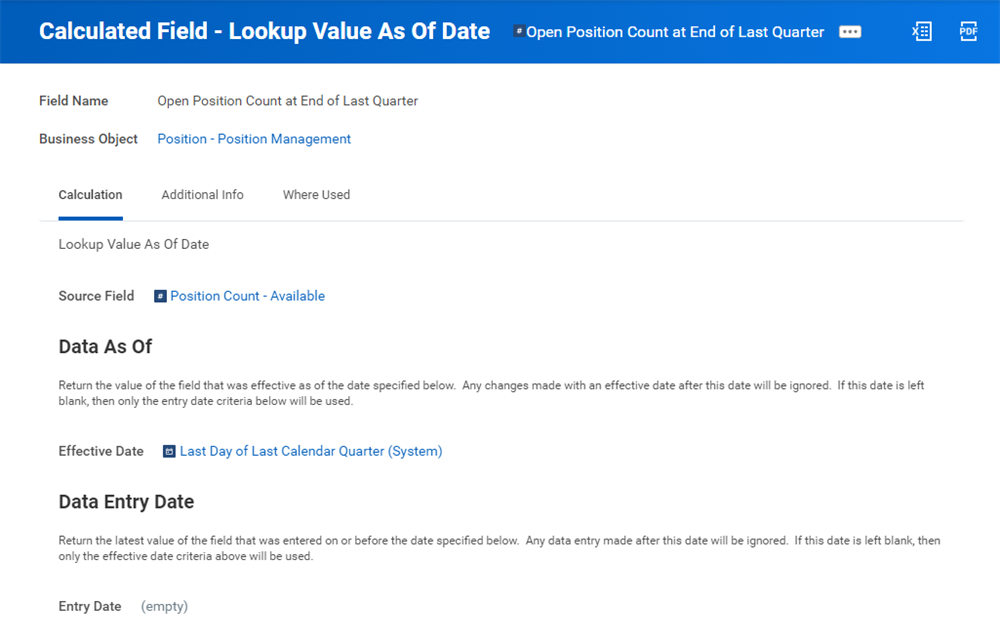
Example of a Lookup Value as of Date field
If you supply both an effective and entry date, Workday only explores transactions with an entry date on or before the calculated field's entry date. The system uses the transaction with the latest effective date that is on or before the calculated field's effective date.
Example of determining the value of a field as of: | Condition |
|---|---|
Specified Effective Date |
|
Entry Date |
|
Entry and Effective Dates Combined |
|
The Lookup Value as of Date function is useful when the value needed is in a separate field for reference in a column of its own. This function is also useful when the field is on a report, or included elsewhere such as in another calculation.
Change Detection
The Lookup Value as of Date function is useful for change detection because you can:
- Access the value of a field as of two points in time.
- Compare field values to determine if change occurs (if not equal).
- Today versus yesterday
- This moment versus a millisecond ago
- The effective date of the event versus the day before the effective date of event
- A prompted date versus another prompt date
The Increment or Decrement Date function helps you derive the dates and times you need to measure the day before an event or a millisecond ago.
For example, to determine added or removed role assignments in the past year, you would:
- Create an Extract Multi-Instance (Intersection) field to determine which role assignments are the same at the two specified dates - 1 year ago versus today.
- Create an Extract Multi-Instance (Except) field to determine which role assignments exist now that did not 1 year ago - added role assignments.
- Create an Extract Multi-Instance (Except) field to determine which role assignments existed 1 year ago that do not exist currently - removed role assignments.
You can use calculated fields when the before and after values are not available to the event. They are also useful if you want to access changes in values for fields changed outside of business process events, or as of different points in time. Many event objects capture the current and proposed values as part of business process events. Doing so helps you determine if the value changed. You can use these delivered fields in reporting to detect change between the current and proposed fields.
Lookup Hierarchy
The Lookup Hierarchy calculated field reports on hierarchical data in Workday (including custom hierarchies and financial data). Lookup Hierarchy determines a hierarchy node:
- Based on a level number.
- Associated with a level name.
- Related to a field in a hierarchy.
For example, if you provide a cost center name, it returns the associated cost center hierarchy node. Lookup Hierarchy dynamically retrieves data by node from any Workday object that has an associated hierarchical structure. Lookup Hierarchy supports both delivered and custom hierarchies.
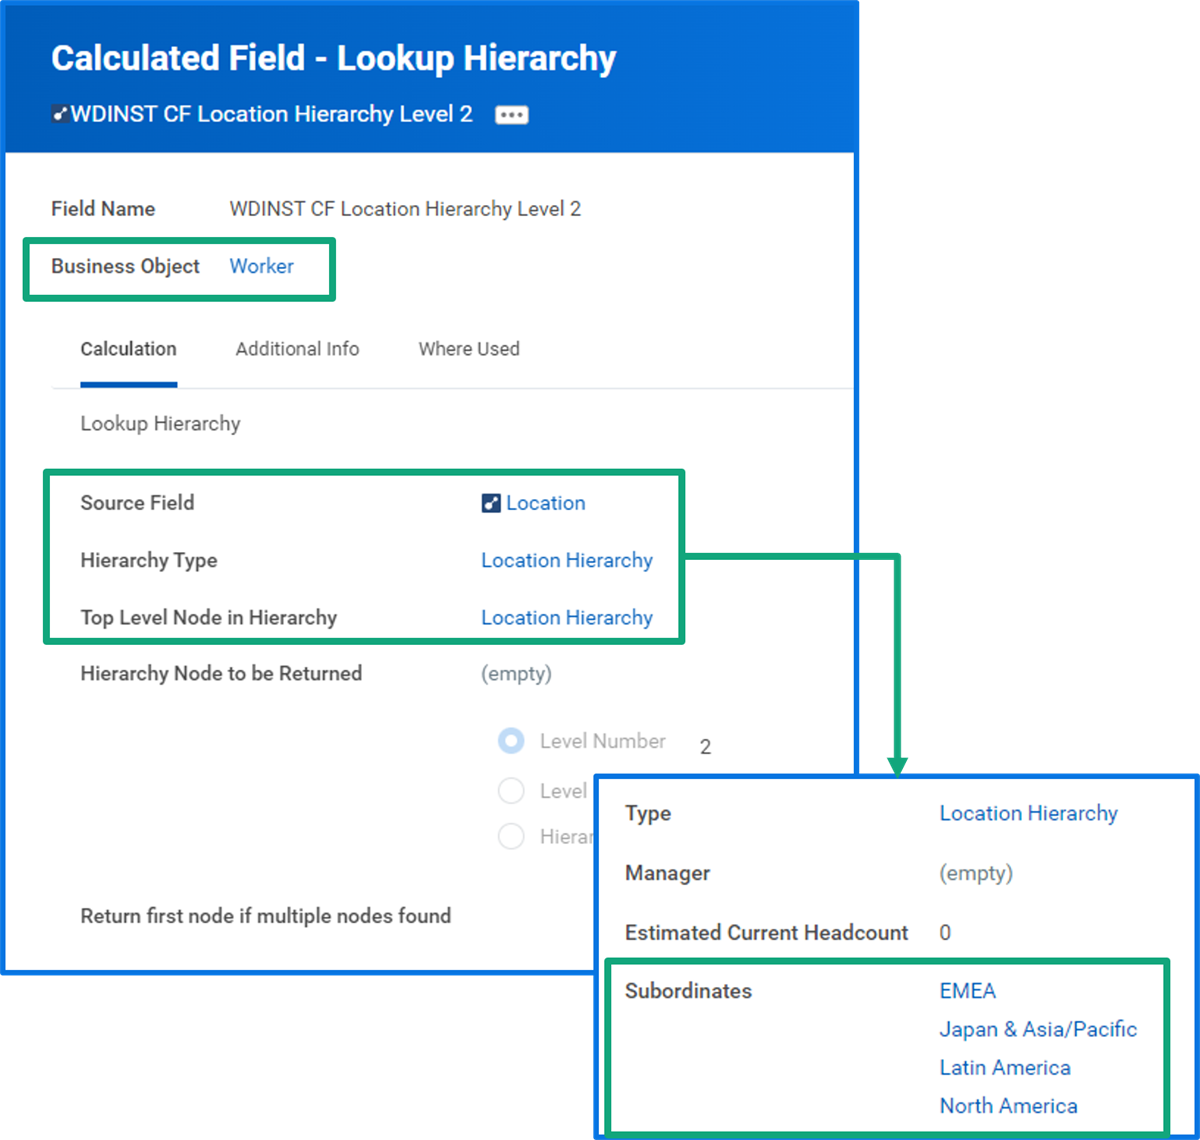
Lookup Hierarchy calculated field definition that relies on Location Hierarchy as the Hierarchy Type.
Lookup Hierarchy Rollup
Matrix reports use the Lookup Hierarchy Rollup function. This function supports any Workday-delivered or custom structure. It displays matrix report data, stepping through levels of a hierarchy as users drill down. Use defined hierarchies to roll up and drill through summarizations. This feature respects the configured security access control that you have to an organization. When you drill down into the Lookup Hierarchy Rollup field, you start at the highest level that you have security access to in the hierarchy. A blank value returns for data that you do not have security access to.
Process
There are three steps to using a Lookup Hierarchy Rollup field in a matrix report:
- Create Lookup Hierarchy Rollup calculated field and hierarchy type.
- Include Lookup Hierarchy Rollup field as a drillable field in a matrix report.
- Drill through summarization in the report.
Payroll Business Objects and Data Sources
Common business objects that you can use for custom payroll reports include:
- Payroll Result
- Payroll Result Line
- Pay Groups
- Period Schedule
- Pay Components
- Worktags
Payroll also functions with a unique set of data sources. For example, the Journal Line business object has two indexed data sources:
- Journal Lines
- Journal Lines for Financial Reporting
The Journal Lines data source returns more instances than the Journal Lines for Financial Reporting data source. For optimal performance, select the data source that returns the smallest dataset containing all needed data.
Examples of common payroll indexed data sources include:
- Payroll Result Lines
- Payroll Results
- Payroll Inputs
- Payroll Payments
- Payroll Retro Result Lines
Tip: A common, high-performing business object and data source combination for payroll is Payroll Result Lines as the data source with a filter on the Worker Data business object.
Delivered Reports for Payroll
The
Workday Standard Reports
offers the following payroll-related standard report categories:- Calendar: Includes reports for Fair Labor Standards Act (FLSA) work periods, holiday and work schedules, and United Kingdom statutory work schedule calendars.
- Background Process: Critical (Audits): Includes reports to view scheduled EIBs and scheduled reports that will have an exception.
- Organizations: Includes reports that display org charts, companies, cost centers, and regions.
- Payroll Interface: Includes reports related to interface of deductions, earnings, costing, external payroll results, and payment elections.
- Payroll Processing/Results: Includes reports that you may be most familiar with as you audit your payroll.
- Payroll Worker Data: Includes worker data reports.
- Settlements: Includes reports related to the settlement process, including payments, positive pay files, advices, checks, and direct deposit.
- Set Up Payroll: Includes reports listing all payroll data configured in your tenant.
The table below lists some popular standard payroll reports that you can copy and modify:
Report Name | Description |
|---|---|
Pay Balance Summary | Displays pay balances over one or more pay periods for a pay run group or pay group. |
Pay Calculation Off-Cycle Inputs for Group of Worker | Displays off-cycle inputs for workers for pay run groups or pay groups. |
Pay Calculation Results - Deduction Register | Displays period results for selected deduction. |
Pay Calculation Results - Earning Register | Displays period results for selected earning or pay component-related calculations (PCRCs). |
Pay Calculation Results for Group of Workers | Displays pay calculation results for workers for pay run groups or pay groups. |
Pay Calculation Results for Worker | Displays pay calculation results for a single worker. |
Pay Calculation Results - Outstanding Arrears Balance As of Pay Period | Displays outstanding arrears balance for a pay period for pay run groups or pay groups. |
Pay Calculation Results Summary | Displays summarized pay calculation results for pay periods for pay run groups or pay groups. |
Payroll Not Completed 'X' Days Before Payment Date | Displays pay groups for which payroll is still open a given number of days before payment date. |
Payroll Totals by Category | Displays a list of pay components separated by category. |
Payroll Totals by Pay Group and Category | Displays current period values, grouped by pay groups as rows and pay component categories as columns. Drillable to more detailed level. |
YTD Payroll Totals by Pay Group and Category | Displays YTD values, grouped by pay groups as rows and pay component categories as columns. Drillable to more detailed level. |
YTD Payroll Totals (Employer Paid) for Workers
| Displays YTD values, grouped by workers as rows and employer pay component categories as columns. Drillable to more detailed level. |
YTD Payroll Totals for Workers
| Displays YTD values, grouped by workers as rows and employer pay component categories as columns. Drillable to more detailed level. |
Payroll Dashboards
You can create custom dashboards and configure the following Workday-delivered payroll dashboards:
- Pay Cycle Command Center
- Payroll Compliance Updates
- Payroll Year End
Pay Cycle Command Center
The
Pay Cycle Command Center
dashboard helps you prepare for payroll, access processing tasks, and increase visibility of processing results. Within each phase of your payroll cycle, you can use this dashboard to track statuses, view trends, and reconcile results. Use the Pay Cycle Command Center
dashboard to replace your manual checklists.You can configure the dashboard prompts, worklets, and menu items using the
Maintain Dashboards
report.Security Note
: The dashboard displays for users with Management Dashboard: Pay Cycle Command Center domain access in the Core Payroll Functional area.Payroll Compliance Updates
The
Payroll Compliance Updates
dashboard displays tax compliance updates and upcoming compliance changes. It helps you identify the most impactful updates.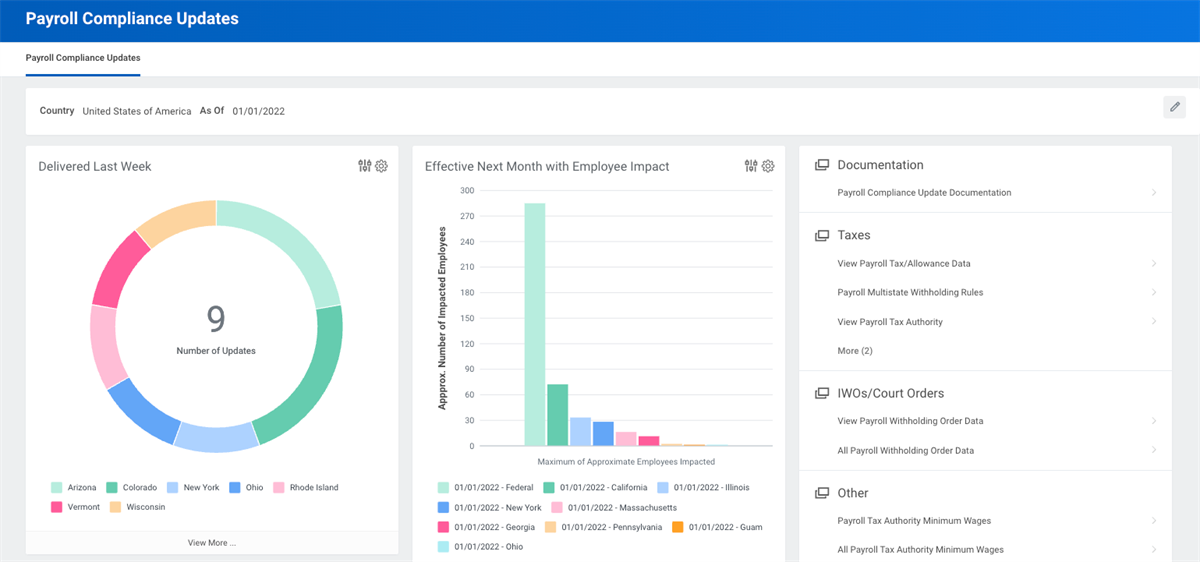
The three default worklets on the dashboard are:
- Delivered Last Week: Provides insight to tax compliance updates delivered in the last seven days.
- Effective Next Month with Employee Impact: Provides insight to tax compliance updates going into effect within the next month that will potentially impact one or more workers.
- Other Updates Delivered Last Week or Effective Next Month: Provides insight into additional tax compliance updates that Workday delivered in the last seven days, or that are effective in the next month.
The dashboard also includes a navigation menu with access to common compliance tasks and reports. You can configure the menu by accessing the
Maintain Dashboards
report.Security Note
: The Payroll Compliance Updates
dashboard displays for users with Set Up: Payroll (Taxes View) domain access in the Core Payroll Functional area.Payroll Year End
The
Payroll Year End
dashboard provides access to year-end tasks, past year-end statistics, and status of year-end forms. The dashboard includes the following worklets:- Payroll Year End Process: You can launch the payroll year-end business process from this worklet. Displays the status of the year-end business process and who is responsible for the next step.
- Last 5 Years (Forms/Employees): Displays employee counts for original and corrected tax forms; percentage forms corrected by type and tax year; and tax forms by employee, company, and tax year.
- Estimated Form Types Needed (Employees): Displays projected requirements for form types and the number of employees requiring each form by company.
Security Note
: The dashboard displays for users with Management Dashboard: Payroll Year End domain access in the CAN Payroll or USA Payroll functional area.Chapter Summary
- You can extend some indexed data sources to include additional nonindexed or calculated fields.
- Workers for HCM Reporting is the most common data source for reporting on Worker data.
- You can use the Completed Staffing Events for HCM Reporting data source to report on staffing events.
- The Lookup Value As Of Date function allows you to explore the value of a field as of two points in time.
- Fields labeled as "current" represent the value coming into the event, while fields labeled as "proposed" represent the values proposed (changes) in the event.
- The Payroll Results business object can have many Payroll Result Lines, showing a one-to-many relationship. Payroll Results contain the totals of all associated Payroll Result Lines.