
Concept: Dataset Workspace
The
Edit Dataset Transformations
task is where you make changes to the dataset definition to manipulate data. This task acts like a single page application, meaning you can interact with elements on the task dynamically as if it were its own application. You can also make all the changes you want, such as adding Prism calculated fields and stages. When you're done, click Save
to save all changes to the dataset.If you have permission to edit a dataset, you can access the
Edit Dataset Transformations
task using these methods:
- On theData Catalogreport, right-click a dataset name and selectEdit Transformations, or open the dataset and selectEdit Transformationsfrom theQuick Actions.
- Access theEdit Datasettask and select the dataset name that you want to edit.
- When creating a dataset for the first time, the workflow leads you to theEdit Dataset Transformationstask.
When you view the
Edit Dataset Transformations
task, you see these components: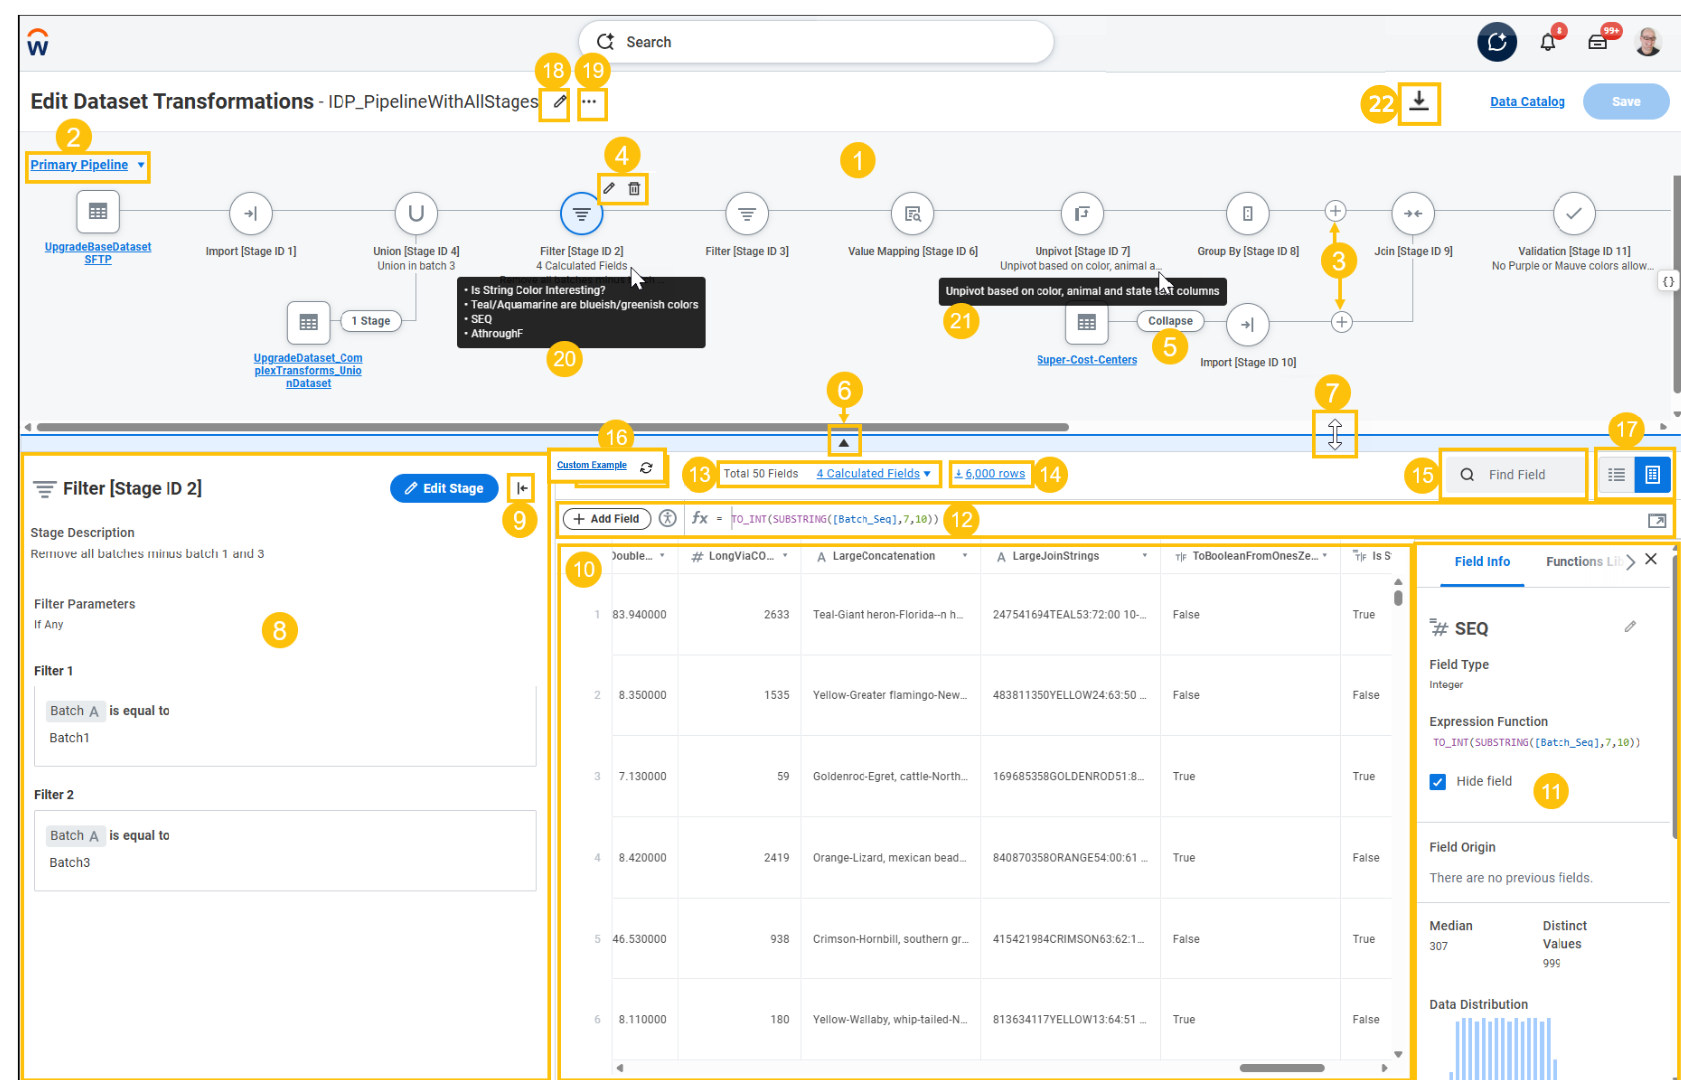
- Transformation canvas. This canvas visually represents the stages in the dataset pipeline, starting with the first stage that created the pipeline. For base datasets, that can be an Import or Parse stage, depending on where the source data comes from. For derived datasets, it's an Import stage. The canvas displays specific icons for different artifact types. You can:
- Add and delete stages.
- View stage descriptions.
- View the number and names of Prism calculated fields in a stage.
- Hide the canvas to increase the available space in the example data table.
- Use the keyboard for navigating the pipeline graph (Tab, Up/Down/Left/Right arrow keys).
- Zoom in and out, and reset the zoom level, to help you navigate large pipelines.
- Expand multiple additional pipelines on the canvas, and collapse all pipelines by clicking a button.
- Pipeline selector. Switch between the primary pipeline and any disconnected pipelines, or add a new disconnected pipeline that can be used in a join or union on the primary pipeline.
- Add a new stage between existing stages.
- Delete or edit a stage.
- Expand/collapse additional pipeline stages.
- Show/hide the transformation canvas.
- Resize the canvas.
- Stage configuration panel. This panel provides detailed information about the selected stage. You can:
- View stage descriptions.
- Edit stages.
- Manage dataset fields.
- Expand/collapse the stage configuration panel.
- Example data table. This table displays the current view of the data (records and fields) for the output of the currently selected pipeline stage.
- Inspector panel. This panel displays when you select a field in the example data table. You can hide this panel to increase the available space in the example data table. This panel has these tabs:
- Field Info. This tab displays detailed information about the selected field, including statistics on the values in the field. All statistics are based on the data currently shown in the example data table. Therefore, to get more precise numbers, increase the number of example rows.
- Functions Library. This tab displays the functions that you can use in a Prism calculated field expression, including description, syntax, and an example. You can search for a specific function. You can click the+icon next to the function name to insert the function at the current location in the Prism calculated field expression.
- Prism calculated field expression bar. ClickAdd fieldto add a new Prism calculated field, and then enter the field expression. You can:
- Use the expression bar later to edit the field expression.
- Expand the expression builder to create and view multiline expressions.
- Edit the field name in the inspector panel.
- Stage statistics and search bar. For a selected stage, you can see the number of:
- Total number of stage fields.
- Stage calculated fields.
- Calculated field-related errors.
You can see the ID for stages. The stage ID is a unique ID that Workday assigns to the stage based on the order you added the stage to the dataset. For each stage you add, the stage ID increases.If you use Microsoft Excel, there are potential limits on the number of characters your cells can contain when you download all values. - Download example data.
- Search for a field and navigate to it directly.
- Example data controls. Use this menu to filter the example data displayed in the dataset. TheRefresh for Custom Exampleicon is available only for custom example data.
- Table and list view. You can view the example data table as a table or a list. The field list view navigator enables you to see distinct, null, median, and top values at a glance. When you edit a new dataset, the default view is table view. Each time you change the view, the last view you select becomes the default view.
- Edit dataset details. Use the configuration icon to open a pop-up where you can:
- Change the dataset display name.
- Create and edit tags.
- Edit the dataset description.
- View the dataset API name.
- Dataset actions menu. Use this menu to quickly access theView Dataset DetailsandView Dataset Lineagereports.
- Hover over a stage calculated field to view the first 10 calculated field names.
- Hover over a stage description to view the complete description.
- Download calculated field expressions for the dataset pipeline. The download option is available once you save the dataset.
If you're new to Workday, you don't have access to create or edit base datasets.
Workday recommends that you use tables to ingest data into Prism Analytics instead of base datasets, to take advantage of the many performance and feature benefits.