
Concept: OfficeConnect for Excel Interface Tour
There are 3 main sections of OfficeConnect for Excel. You can also use the right-click menus to accomplish various tasks depending on where you are in the interface.
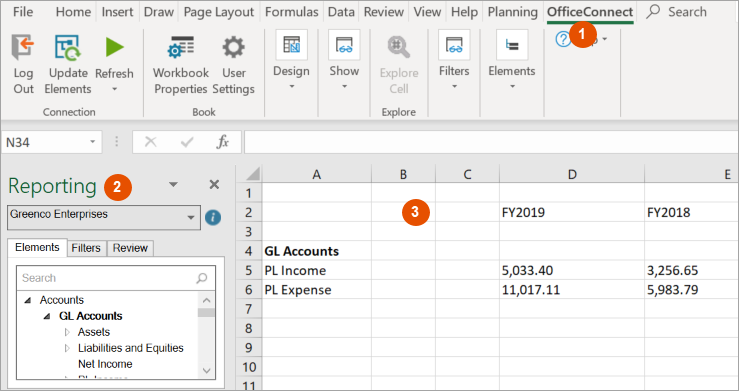
Option | Description |
|---|---|
1 | OfficeConnect Tab on the Excel ribbon |
2 | Reporting pane with data source indicator.
Example: Reporting: Planning or Reporting: Financials |
3 | Excel Worksheet |
OfficeConnect Tab on the Excel Ribbon
OfficeConnect
Tab on the Excel RibbonFind all the tools to format and design your
OfficeConnect
report:- Manage your user settings and workbook properties.
- Design and manage the view of your report.
- Refresh and secure data and refresh the elements in the Reporting pane.
- Add elements to your report.
- Explore cells to drill in to the data.
Notice that you also have all the typical Excel tabs, with all Excel functionality.
Reporting Pane
The Reporting pane displays the data source that you're using (Adaptive Planning or Financials). If you have access to multiple parent-child instances, you can select an instance from the drop-down.
Find all the elements to build a report:
- Elementstab. Click the arrows for the parent elements to see the underlying children elements. Drag and drop elements to rows, columns, and cells. See Add Elements to Columns, Rows, and Cells.
- Filterstab: Add filters and disable or enable them to display variations of data in the reports. See Add Elements to Report Filters.
- Reviewtab: Check the defaults and applied elements of a row, column, or cell. See Check Elements in the Review Tab.
Hide or Move the Reporting Pane
From the
OfficeConnect
tab:- UncheckTask Paneto hide the Reporting pane.
- UncheckReviewandFiltersto hide the Review and Filter tabs in the Reporting Pane.
To undock the Reporting pane, click  on upper right corner of the Reporting pane and select
on upper right corner of the Reporting pane and select Move
. Drop it anywhere on your page, or hover at the top, bottom, left, or right of the worksheet until it docks. Can't find your undocked Planning pane? Click
Show Reporting Pane
from the OfficeConnect ribbon again (even if it’s already checked). Your Reporting pane will display. Excel Worksheet
View data from
Adaptive Planning
:- Drop element to create reports and display the data of your report.
- Drill in to data to understand sources.
- Use Excel functions to create charts and calculations.
If you’ve installed
Excel Interface for Planning
, a Planning tab will display next to the OfficeConnect
tab. You can Connect to Adaptive Planning or Work Offline.