
Concept: Report Element Types and Behavior
The
Reporting
pane shows all the possible elements you can add to your report. You can add elements in the report filters, columns, rows, and individual cells. Every instance includes accounts, time, levels, and versions. Some include currencies, attributes, and custom dimensions.Most elements reflect the setup of your model.
How Elements Work
OfficeConnect
displays data from Adaptive Planning
based on where elements "intersect" in the report worksheet.Each cell is a visible intersection between rows and columns. Filters provide an invisible intersection, as a third dimension, for each cell. The report adds default versions, levels, and currency (when applicable) to every
OfficeConnect
report. These defaults work behind the report, like filters.The element intersection follows precedence rules, based on how and where you have added the elements to the report. To check the elements of a data point and to see the precedence rules at work, go to the Review tab of the Reporting pane.
Element Requirements
To produce valid data, each data point, or cell, must have each of the following elements intersect:
- Accounts or account attributes: Add account elements to the columns, rows, or filters.
- Time: Add time elements to the columns, rows, or filters.
- Level: Let the report use your default level or add any level elements. The default is the highest level that you can access.
- Version: Let the report use your default or add any version elements. The default version is set by yourAdaptive Planningadministrator for all users.
Elements as Filters
Filters are optional. You can add filters to workbooks and to worksheets. Once you add elements to filters, you and others can use them to see different slices of data in the report. Filters need to be added, enabled, and check marked to affect the data.
Filters follow the precedence rules: worksheet filters override workbook filters.
Example: If you have a workbook filter for FY2016 and also a worksheet filter for FY2015, the report displays data for FY2015.
Elements in rows and columns override filters.
Example: If Budget Version is in a column and Actuals is a filter, the cells in the column display Budget data.
Elements in Columns and Rows
For a valid report, you need at least one element in a row and at least one element in a column. See Add Elements.
Elements in rows override elements in columns.
Example: If the Assets account is in a row and the Expenses account is in a column, the intersecting cell displays Assets data.
Elements in Cells
Cells are the combination of all element defaults and elements added to filters, columns, and rows. You can also add elements to a single cell or cells and this element overrides any other element.
If you want to replace the data in a cell to override the elements, add an Excel equation.
Example: Enter =45 instead of 45. Refresh the report and the equation you added overrides the data from
Adaptive Planning
. Basic Element Types
Accounts
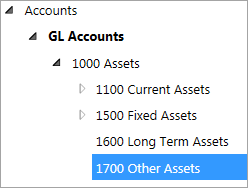
Every instance has GL Accounts. Many have Custom, Metric, Modeled, Cubed and Assumption accounts. You could add Assets to your report and it would show the rollup value of its four sub-accounts. Or, you could expand Assets to add each sub-account. Notice that some of the sub-accounts, like Current Assets and Fixed Assets, also have sub-accounts.
Time
Every instance has contexts, components, and time periods.
Time periods
: You can either add an entire calendar or you can expand each time period to see smaller segments that you can add to the report. The time periods break down according to your calendar configuration. In general, you can expand each year to quarters, then to months. Some instances may have semi-years, weeks, and even days.Components
: Components are time periods organized according to your instance's calendar configuration. Example: You can expand components to quickly drag and drop years, quarters, months and more. Use components that are smaller than a year with year-specific time elements.
Contexts
: Contexts provide contextual information to time elements, like beginning balance or time period to date. Use contexts with year specific time elements.Level
Every instance has level elements. Level elements correspond to the structure of organization in your instance. Adding a collapsed level shows the rollup value. Expanding it to add each sub-element shows the data broken down per level. If you don't have permission to view a level, you don't see it in the Elements tab.
Unless you add organization elements to your report, the report uses your default organization, based on the your online model.
Versions
Every instance has version elements. Versions correspond to the structure of your actuals and planning versions in your instance. Hidden versions don't appear in the Elements tab and can't be used.
Unless you add version elements to your report, the report uses your default version for any OfficeConnect report you create or open.
To use translated currencies in OfficeConnect reports, you can only include versions that enable it. If you add at least one version without translated currency, the entire report uses the exchange rates set up in Modeling for all versions.
Review Added Elements and Defaults in Any Cell, Row, or Column
You can review the default and applied elements of any data point in your
OfficeConnect
report to understand the source of the data.