
Concept: Matrix Report Filters and Parameters
Both filters and parameters limit the data that displays in a report. There's a difference in how they work.
Filters
Add filters to:
- Apply to the whole report and display data specific only to the filters. Example: Filter by the Engineering and USD elements to display data only for that level and currency.
- Improve performance by limiting the data used to run a report.
When you add many of the same elements to the filter, the report returns the rollup values of the filter. Example: Add Expenses and Assets to the filter. The data in the report returns the sum of Expenses and Assets.
Rollups for contra accounts calculate differently:
- When the filter includes only contra accounts in the filter, the rollup is the sum of the contra accounts as a positive integer.
- Where the filter includes a mix of contra and regular accounts, the rollup is the sum of all regular accounts minus the sum of all contra accounts.
Parameters
Add parameters to:
- Specific elements already applied to the report rows or columns. They let you change the data that you can view only for the associated elements, not the whole report. Say you have a report with these columns:
- Actuals
- Working Budget
- VarianceYou can parameterize the budget version and make Working Budget your initial choice. Select other versions as available parameter choices. These choices only impact the Working Budget column. There’s no change to the Actuals column when users rerun the report with a different budget version.
Example: Add a Report Filter
To add filters, drag elements from the
Elements
pane to the Filters
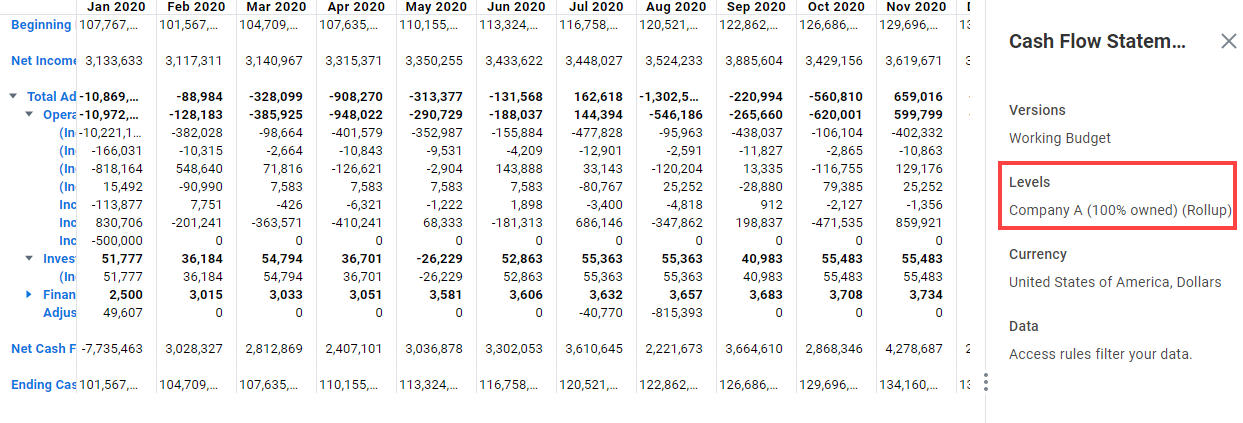
area. Verify that the report isn't already using these elements.The Cash Flow Statement report displays data for the Total Company (Rollup) level by default. In this example, we apply Level as a filter to the report. When you rerun the report, it displays data for the Company A level only.
Do these steps:
- ClickEdit.
- In theElementspane, expandLevelsand then Total Company.
- Drag Company A to the Filters. This level adds as a filter for the whole report.
- Run the report.
- To see the filter, click theShow Informationicon on the toolbar. You can view any filters and other default values applied to the report. Note that the report displays monthly data for only Company A level.
Example: Add a Report Parameter
To add parameters, drag elements that are already in the report rows, columns, and filters to the
Parameters
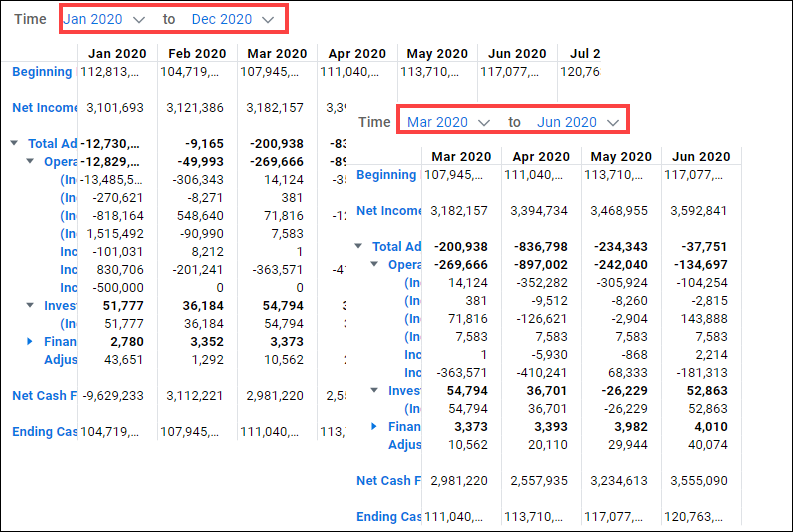
area.The Cash Flow Statement report displays data for the full timespan of the version in the report. In our example, we parameterize Time. When you run the report, it displays data for Jan 2020 to Dec 2020 based on the Initial Range parameter setting. You then select any time range within the report timespan and rerun. The report displays data only for the selected range.
Do these steps:
- ClickEdit.
- From the report column, drag theTimespanelement to theParameters. Time is now a parameter.
- Right-click theTimeparameter and selectProperties.
- UnderChoices, selectFrom Jan 2020 to Dec 2020as the initial data range to display.
- ClickApplyand run the report. The report displays monthly data for the initial time range.
- From theTimeparameter drop-down, select a different range within the report timespan. Example: SelectMar 2020 to Jun 2020and rerun. The report now displays monthly data for the new time range.