
Rollup Cells in Sheets
Rollups sum or average the values of entries according to pre-set structures. Rollup cells represent the rollup value of time, accounts, dimensions, or levels. Not all rollup values are changeable in sheets. Look for blue cells to change rollup values.
Not all rollups are visible in sheets. You may have a
Display Options
setting that hides rollups. Or, your admin may have hidden rollups to improve the performance of cube sheets. See Reference: Sheet Properties for Cube Sheets.How Rollups Work
To change rollup values, you can change:
- The contributing cells and let the sheet calculate the rollup.
- The rollup and choose the breakback method to calculate the data in the contributing cells. For time rollups, you may not have to choose a method. The data you enter may automatically distribute according to the method set up by your admin.
The breakback method determines how the value is distributed to contributing cells. For time rollups the breakback data populates to contributing cells, even if you can't see the contributing cells on the sheet, unless the cells are locked for any reason. For level, dimension, and account rollups, breakback data populates only to contributing cells you can see on the sheet.
Rollups are based on their hierarchies in your model. Your administrator created the different hierarchies when they set up Adaptive Planning for your company.
- The time hierarchy is based on your calendar setup, most typically Month > Quarter > Year. Months contribute to the quarter rollups, which contribute to the year rollup.
- The level hierarchy is typically based on the organization of your company. Levels contribute to parent levels, which contribute to a single top-level, commonly called Total Company.
- The account hierarchies generally reflect your company's accounting books. There may be subtotals in standard sheets that add up values of accounts. Unlike account rollups, they don't follow the account hierarchy and they aren't changeable.
- Each custom dimension is a rollup. Dimension values contribute to the dimension rollup.
- Splits on standard sheets create rollups in the rows. These are data categories created on the sheet. They work like rollups, but they don't follow the structural hierarchies.
When you use Columnar view on cube sheets, rollup values indicate uncategorized values. These rollup values don’t display on the pinned dimension pickers. When you don’t enable rollup values on the sheet definition and use uncategorized values, you can still add rows with the rollup values.
Rollups Limitations by Sheet Type
For modeled sheets, you can enter values in time rollups only.
For standard sheets, you can enter values in time and account rollups.
For cube sheets, rollups of:
- Time and accounts display when they are in the columns, in the rows alone, or in the rows as the last nested dimension.
- Levels and custom dimensions only display in nested rows when they're the last nested dimension.
Rollups in Columns
In modeled sheets with a time span and all standard sheets, time rollups appear in columns after the contributing cells (when visible). Example: The column for Quarter 1 appears after the columns for January, February, and March.
In cube sheets, accounts, levels, or any custom dimensions can be in the columns.
Rollups in Rows
In all sheets, rollups in collapsed rows are gray (read-only). Expand the row to change contributing values or the rollup. When expanded, the rollup, labeled Total
, appears as the last row.
- In standard sheets, accounts are generally the row headers and sheet data is displayed by account.
- When you view standard sheets by level, levels are the row headers and you can't change the value of level rollups.
- In cube sheets, you can drag time, accounts, levels and custom dimensions to the rows. These aren't always changeable.
- For cube sheets, your admin may have hidden total rows to improve the sheet's performance.
Rollups as Filters
When dimensions are filters, any filter with an expand arrow is a rollup. When you choose rollups, you can view, but not change the data. When you choose a "leaf," or a filter that can't be expanded, you can change the data in the sheet. The values contribute to the rollup.
- Filters in Modeled and Standard Sheets
- Level or account filters are available from the drop-down prompt in the toolbar.
- Filters in Cube Sheets
- In cube sheets, any dimension (including time, levels, accounts, and custom dimensions) that isn't in the rows or columns is a filter:
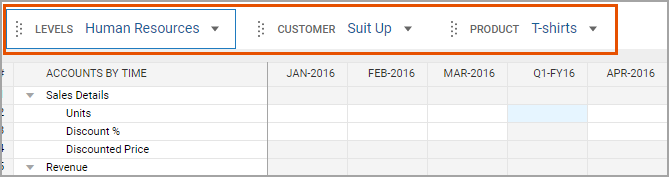
- Dimension Attributes as Filters
- Attribute filters work differently. The sheet may not have all the attribute values available. The example shows a level attribute calledRegionand the levels are in the row.LegalandHuman Resourcesare tagged with theWest Coastattribute value. Notice the totals forG&Aand how they differ based on the attribute selection:
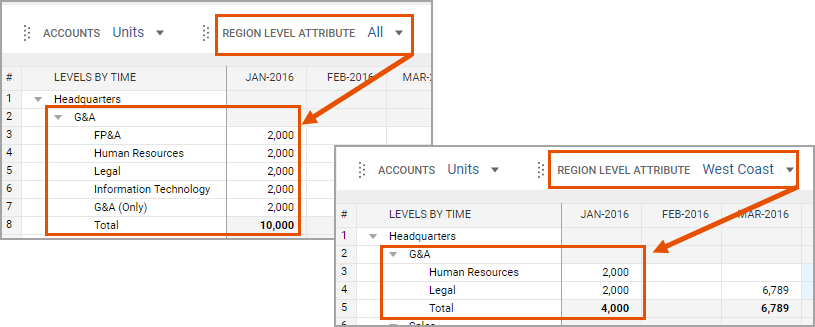 When you selectAllfor an attribute value and view all the unfiltered levels in the rows, the values you enter per level are tagged with their appropriate attribute, even if you can't see or select it from the attribute filter.
Rollups by Calculation Type
Certain rollup calculations types prevent you from entering data in the rollup.
The table defines each calculation type, indicates if it locks the cell for edit in sheets, and indicates which dimensions can have it.
Calculation Type | Unlocked in Sheets | Time Rollups | Levels and Custom Dimension Rollups | Account Rollups |
|---|---|---|---|---|
Sum: The total of the contributing cells. | Yes | Yes (for periodic accounts) | Yes | Yes |
Average: The average counting blanks as zero values. | Yes | Yes | No | No |
Non-blank average: The average of the contributing cells, not counting blanks as zero values. | Yes | No | Yes | No |
Last: The same as the last contributing cell. | Yes | Yes (for cumulative accounts) | No | No |
Weighted average: The average weighted by another account. | No | Yes | Yes | No |
Text: Read-only text as specified by your admin. | No | No | Yes | No |