
Introduction to Reporting
Overview
In this chapter, we introduce the Workday Report Writer tool. You can run standard reports and manipulate the output of a report using this tool. You can also use these standard reports as a starting point for creating new custom reports. We will also explore common terminology used in reporting, and determine the appropriate primary business object and data source for a report.
Objectives
By the end of this chapter, you will be able to:
- Copy a standard report to create a custom report.
- Create a report tag and associate it with custom reports.
- Identify and describe the fields, related business objects, data sources, and reports for a business object.
- Use contextual reporting to view report fields and values.
- Create a custom report using the Advanced report type.
- Add fields from the primary and related business objects to a custom report.
Finding Reports in Workday
You can use the Search box to find and run reports in Workday. Type the name of the report into the Search box and press the Enter key. Your search results are actionable, meaning you can select the search result to run the report. Or, if "Report Definition" appears below the search result, selecting that search result will take you to view the report definition.
Toggle the Simplified Search button, at the top of the search screen, on or off to view the side panel. Toggling this off when searching, allows you to use the categories along the left side to further refine the results.
You can use an object definition's Related Actions icon to act on the given object.
Using Search Prefixes
You can use search prefixes to limit the search results. Type "
?"
in the Search box to access a list of supported search prefixes. To search using a search prefix, type <search prefix>: <specified string>
in the search box. For example, type rd: expense
to search for custom reports using a Search string.The following table lists common reporting search prefixes.
Search Prefix | Search Results |
|---|---|
rd | Searches for custom reports using a search string. |
rdt | Searches for custom report definitions using a report tag. |
field | Searches for fields (including report fields) using a search string. |
Hiding Standard Reports
Use the
Hide Workday Delivered Report
task to make standard reports no longer searchable. This eliminates confusion when you create a custom report to replace a Workday-delivered report.When you hide a standard report, it is no longer available in search results, menus, or Related Actions. Typically, only someone at the central organization level should hide standard reports, since they need to understand the full impact of the change across the entire organization.
Security Note
: You must have access to the Setup: Tenant Setup - General security domain to hide standard reports.Note
: When moving reports from a sandbox to production, Workday does not move the hidden report settings. You need to use the Hide Workday Delivered Repor
t task in production to hide any reports you hid in the sandbox.Workday Standard Reports
Workday delivers standard reports that are available for all customers. If necessary, you can copy many of the Workday-delivered reports to create a custom report and modify it as needed.
You can use the
Workday Standard Reports
report to view Workday-delivered reports.The report displays the following columns:
Column | Description |
|---|---|
Category | The category for the standard report. |
Report | This contains the Related Actions you can take on the standard report. |
Name | Name of the standard report. |
Description | Description of what displays in the report. |
Type | The type of report, either XpressO or Report Writer. Workday creates XpressO reports using a proprietary programming tool that provides special capabilities for building reports. You cannot copy or modify these reports using the Report Writer tool. Workday creates delivered Report Writer reports using the same Report Writer tool that is available to you. You can make a copy of a Report Writer report, change it any way you want, and then save it. |
Schedulable | Indicates if you can schedule a report. |
Domain | Shows the name of the domain that secures the report. Users must have access to one of the security domains to run the report. |
Security Note
:- TheWorkday Standard Reportsreport shows all standard reports and categories, even if you do not have security permissions to access the menu category or the report.
- You must have access to the Analytics Data: Report Fields and Values security domain to run theWorkday Standard Reportsreport.
Copying a Standard Report
There are two ways to copy a standard report:
- From the standard report's Related Actions, select the Standard Report > Copy.
- You can use theCopy Standard Report to Custom Reporttask.
Note:
- You can only copy Report Writer reports, not XpressO reports.
- You cannot copy reports with deprecated data sources and fields.
Security Note
:- By default, the system does not share custom reports with other users. This means only the owner can access and run the report.
- You must have access to the Analytics Data: Report Fields and Values security domain to copy a standard report and create a custom report.
Modifying Report Columns
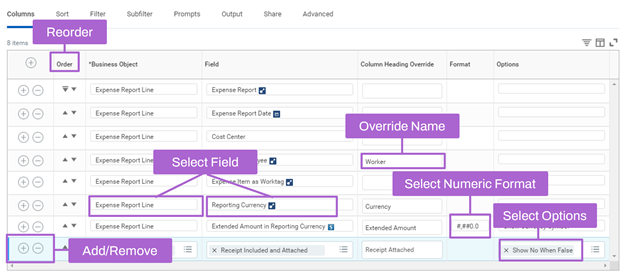
As shown in the image above, you can edit a report and modify the fields that display as columns in the report via the Columns tab.
- Use the + and - icons to add or remove a row.
- Use the up and down arrows to reorder the rows.
- Select the field you want to display.
- Optionally, override the field name displayed on the report.
- Select from a variety of numeric formats (masks).
- Select options for how the data should display.
Freeze Report Columns
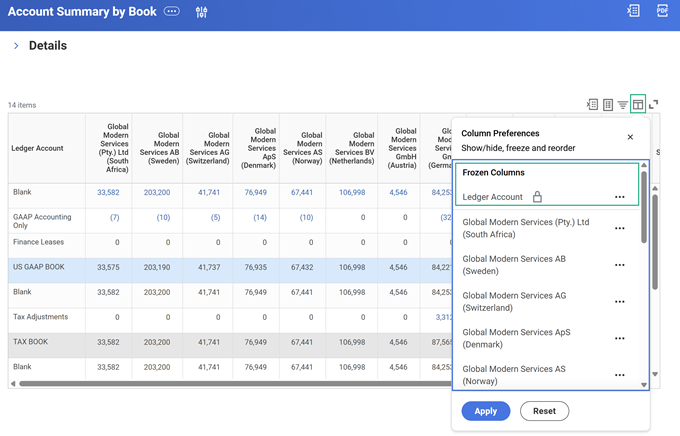
On the report output screen select the View/Edit Grid Preferences icon to drag and drop columns to freeze. This feature is available for Advanced, Composite, Simple, and Transposed report types. By freezing columns this allows you to scroll horizontally without losing the context of the data. The image below highlights the View/Edit Grid Preferences icon and shows the lock icon next to Ledger Account, indicating that the Ledger Account column is frozen.
- Column or row groupings.
- Multilevel column headers.
- Repeating column groups.
If the report does not have columns eligible to freeze, Workday does not display the Column Preferences menu.
Report Tags
You can use report tags to easily categorize and find reports.
Creating Report Tags
You can edit a custom report and create a new report tag. Select Create Report Tag from the Report Tags field.
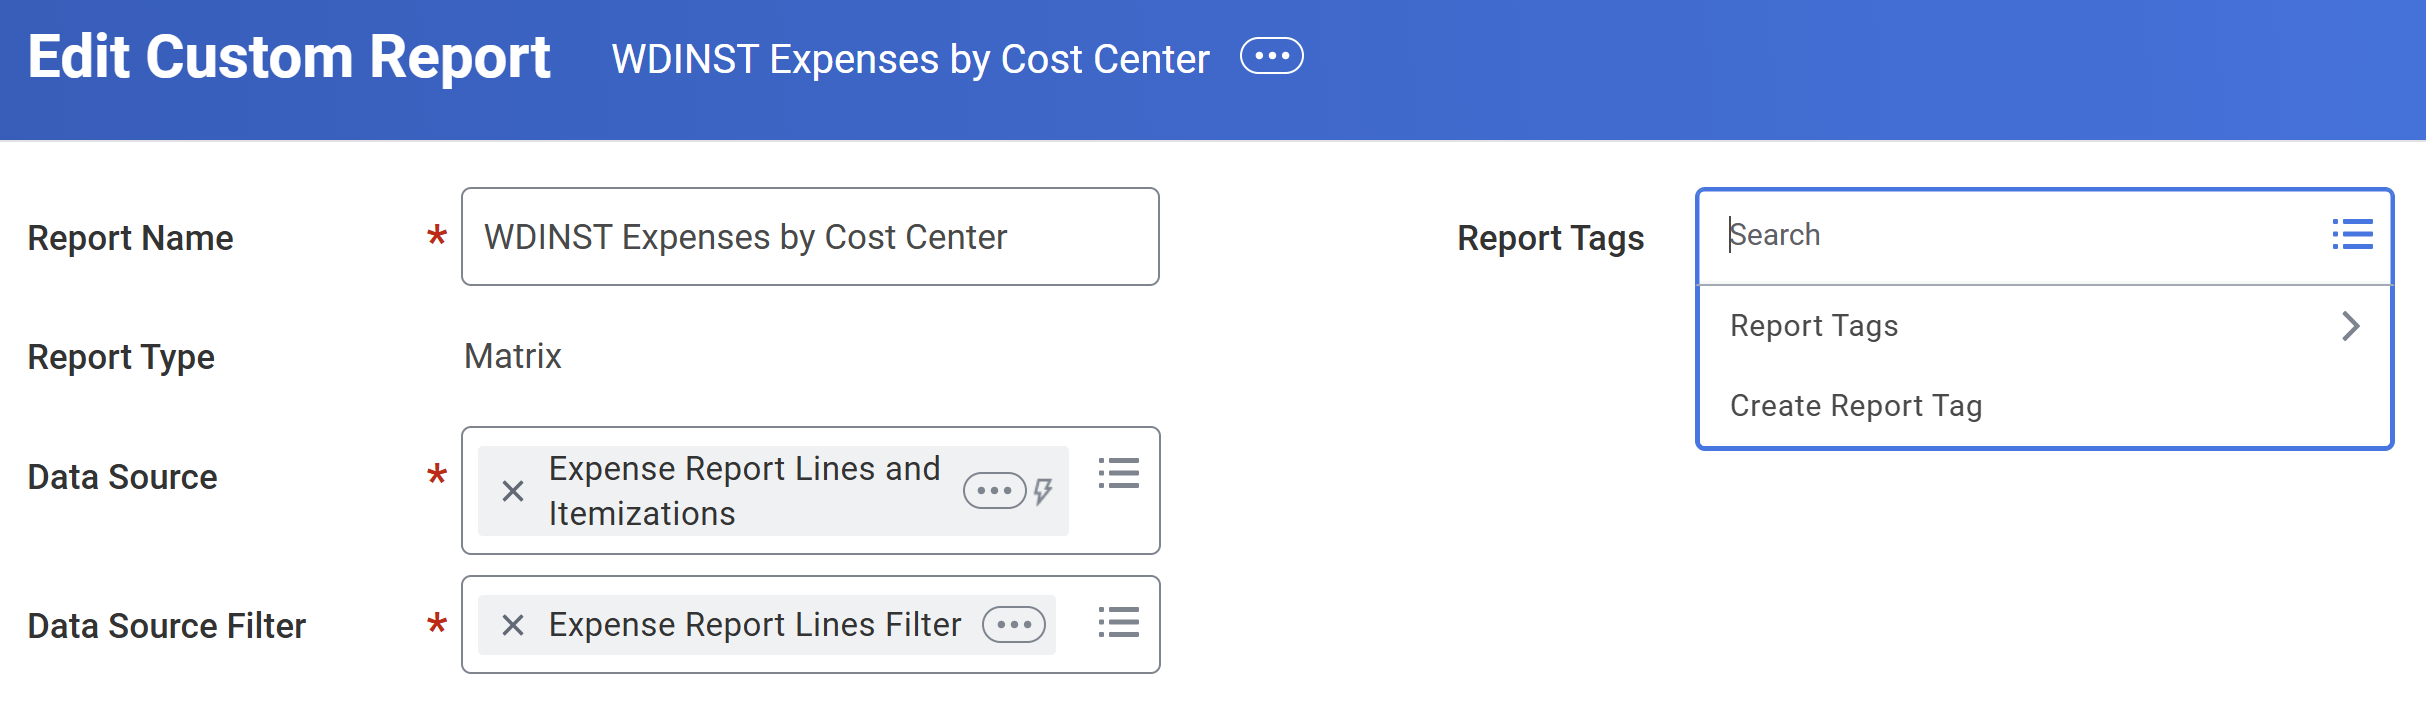
Add a report tag description to easily identify the report tag purpose.
Security Note:
You must have access to the Report Tag Management security domain to create report tags.Searching Using Report Tags
When you search for a report tag name, all associated reports display. You can use the
rdt
prefix to display only custom report definitions in the search results.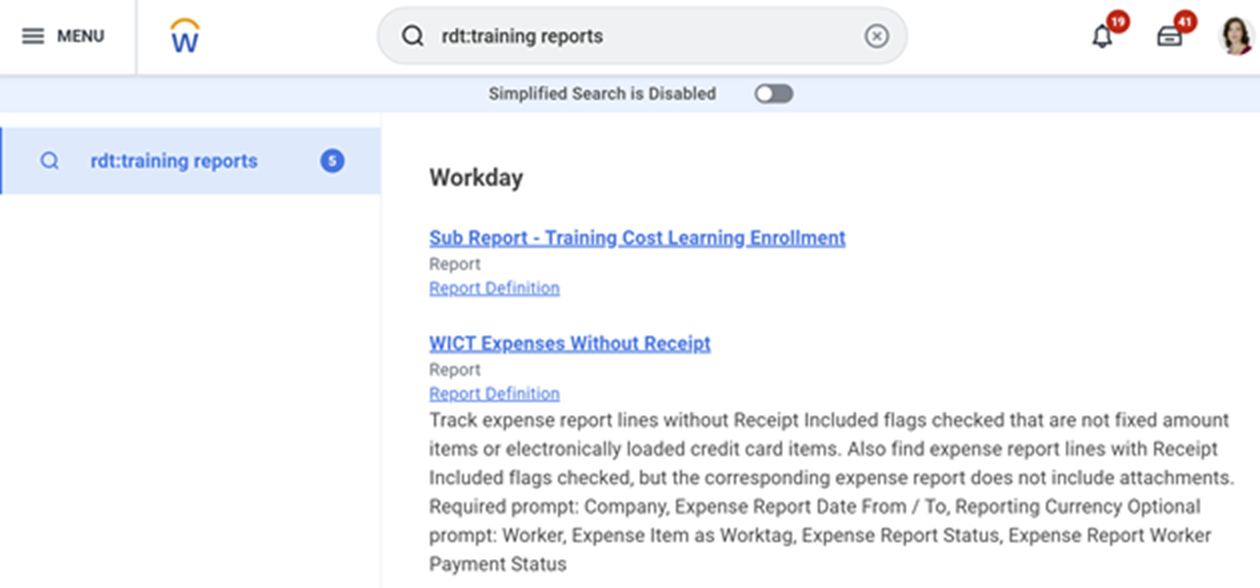
Security Note:
When using report tags to find custom reports, users only access appropriately shared reports with the given tag.Mass Update Report Tags
Report Administrators can mass assign or unassign report tags on multiple reports or report groups. Use the
Mass Update Report Tags
task to perform one of three actions - assign, unassign, or unassign and assign report tags. Either select each instance individually or use the Select All checkbox. After selecting Confirm and Submit, the mass update of report tags has been changed in the report definition.Access the
View Mass Update Report Tags History
task to view the previous mass update report tag changes. Select the count to view each report updated during that instance.Use the
Maintain Report Tags
task and View Report Tags
task to view and edit report tags.All Custom Reports
You can use the
All Custom Reports
report to view all custom reports in the tenant. You can leverage these custom reports as a starting point for new custom reports.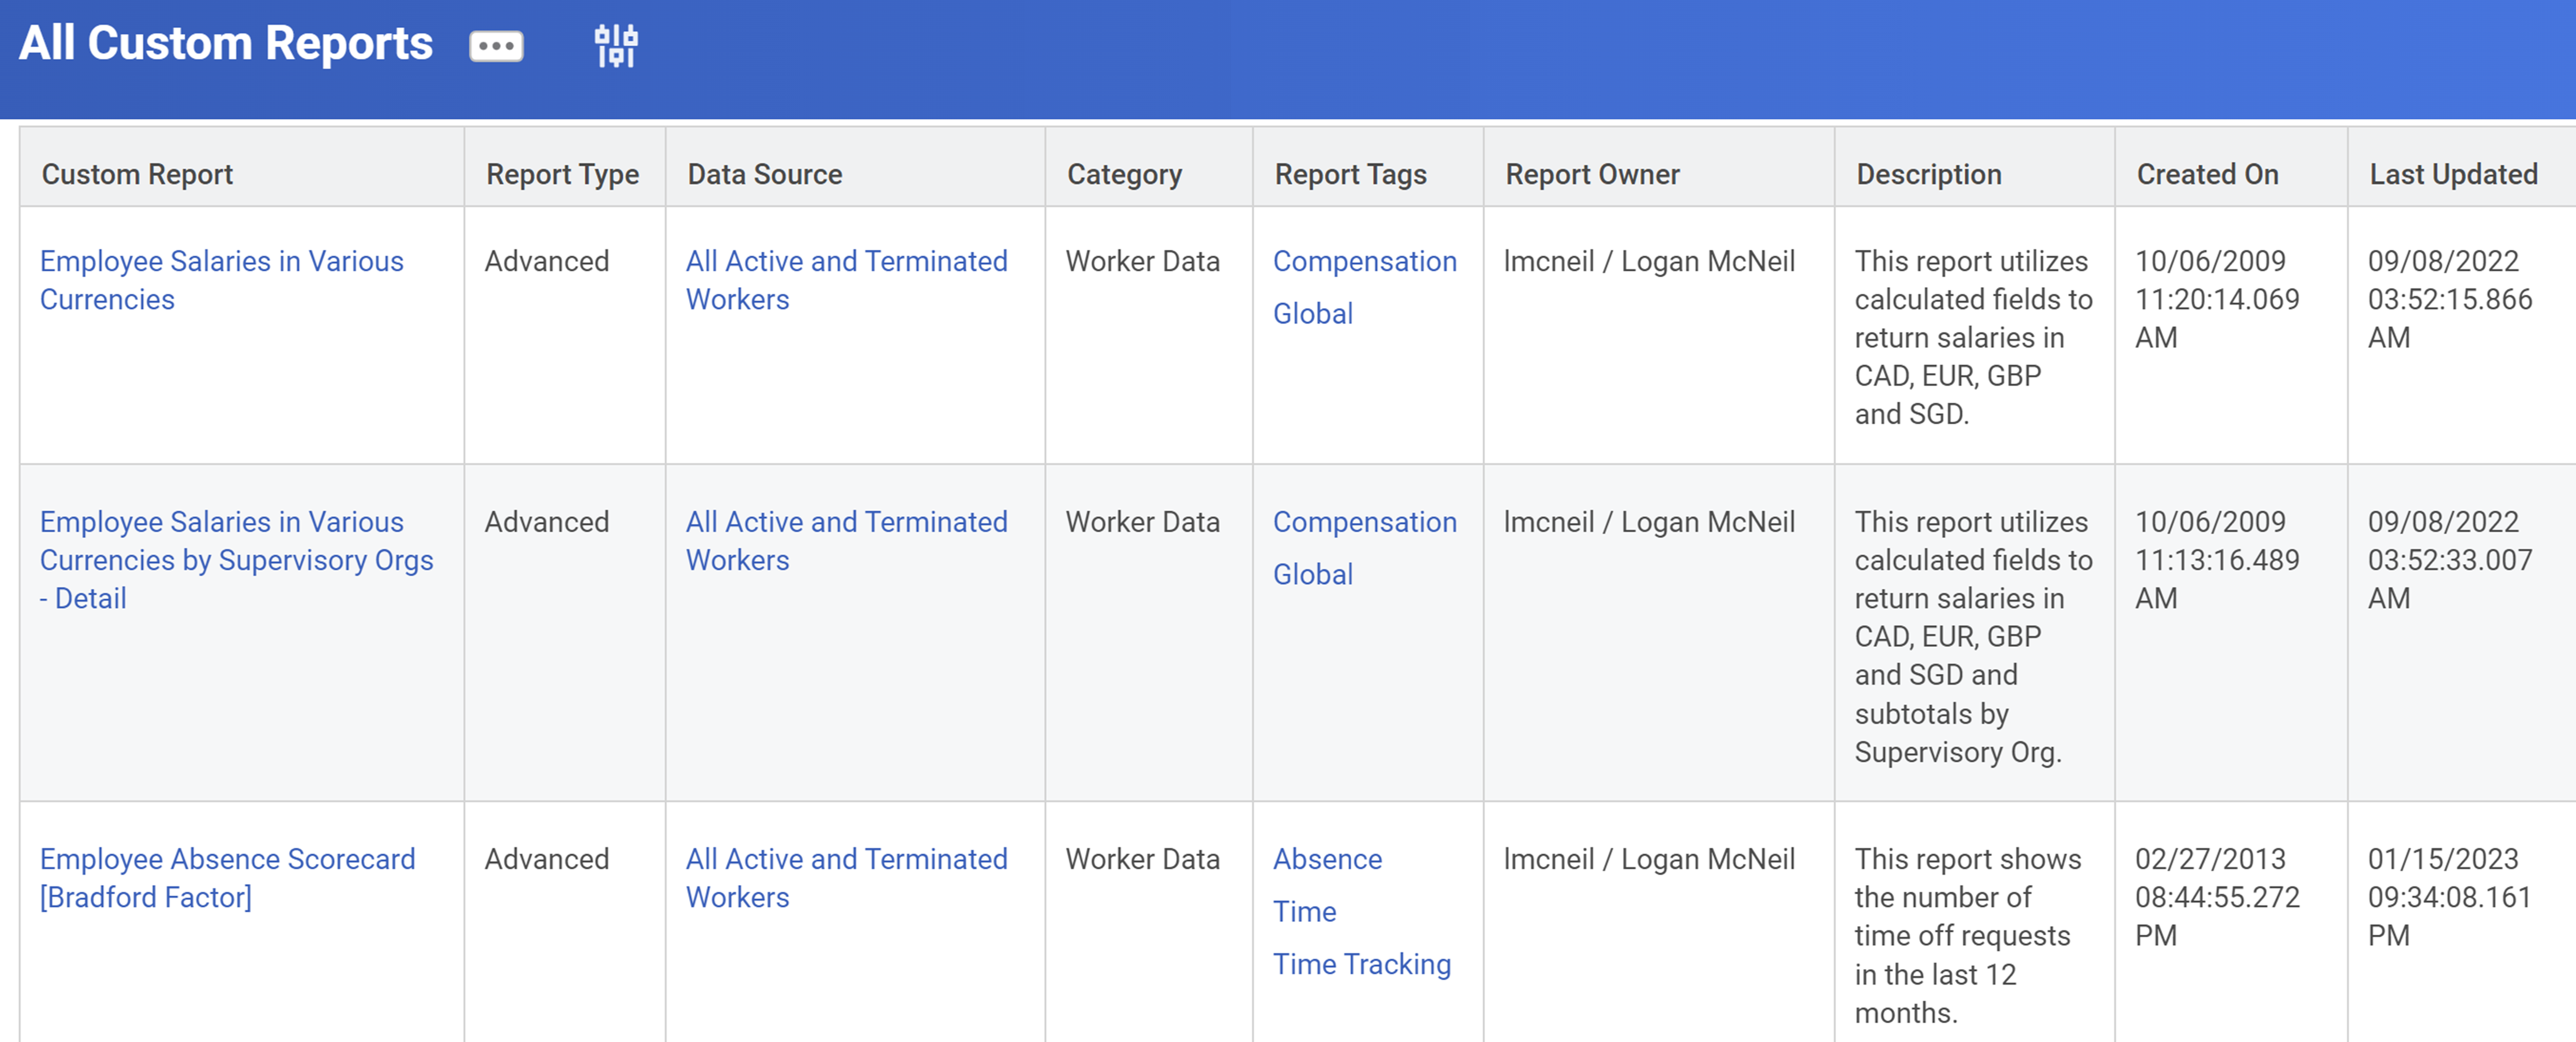
All Workday-Delivered and Custom Reports
Workday delivers the
All Workday-Delivered and Custom Reports
report to view all custom, and standard Report Writer and XpressO reports in a business view. This report allows you to view all reports in the tenant and can be used as a starting point when creating your own custom reports.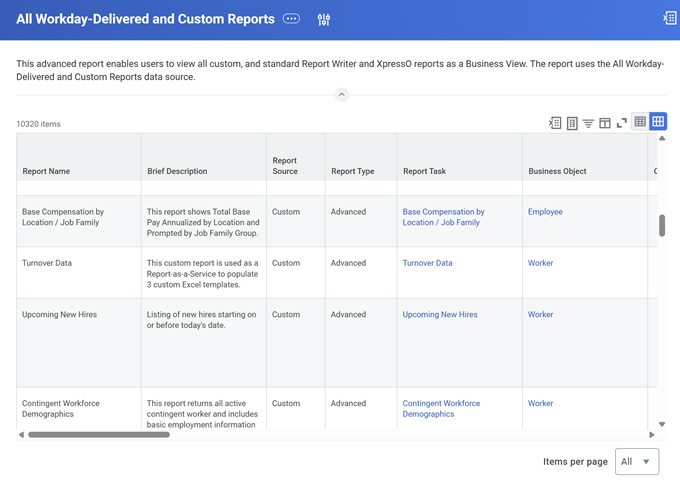
Reporting Terminology
To use Report Writer, you must understand the terminology involved, especially when it comes to business objects and data sources.
Workday stores your data in business objects, similar to database tables or worksheets in Excel. Just as a database table or worksheet has columns and rows, a Workday business object has fields and instances.
The report data source provides a view into the primary business object (PBO). This object gives you access to class report fields (CRFs) as well as links to related business objects (RBOs).
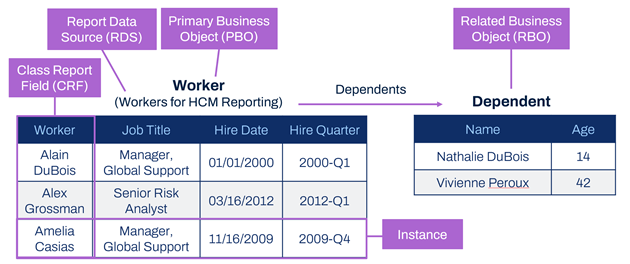
Term | Definition |
|---|---|
Primary Business Object | The main business object for the report. It holds the data that displays in your report. The primary business object determines what fields are initially available to include in the report. |
Related Business Object | Objects that have an association with the primary business object. These can have a 1:1 or 1:M relationship with the primary business object. A field on the primary business object links the two business objects together. |
Report Data Source | Workday delivers data sources for some business objects. You can think of the data source as the 'view' or 'starting filter' for reporting on the given primary business object. |
Class Report Fields | When working with Workday custom reports, you can select available fields (depending on your security). These fields can be Workday-delivered fields, calculated fields, or custom fields. |
Instances | Instances of a business object in Workday are like rows in a table or spreadsheet. Each instance represents a unique occurrence of that type of object, such as a given organization or worker. |
Report Data Sources
Workday defines and delivers the data sources in the system. Workday delivers zero, one, or multiple data sources for each business object. The report data source is the view or selection of instances of a given primary business object; this is essentially the starting data for your report.
With the exception of composite reports, you must select a single report data source when creating a report. This determines the primary business object for the report. The report displays one row for each instance of the primary business object.
For example, let's say you create a report with All Active Employees as the report data source. The primary business object for the report then is Employee. The report shows one row for each instance of Employee. Notice that Alain DuBois only appears once in the table. His dependents display as "sub-rows" and appear as a group under the Dependents heading.
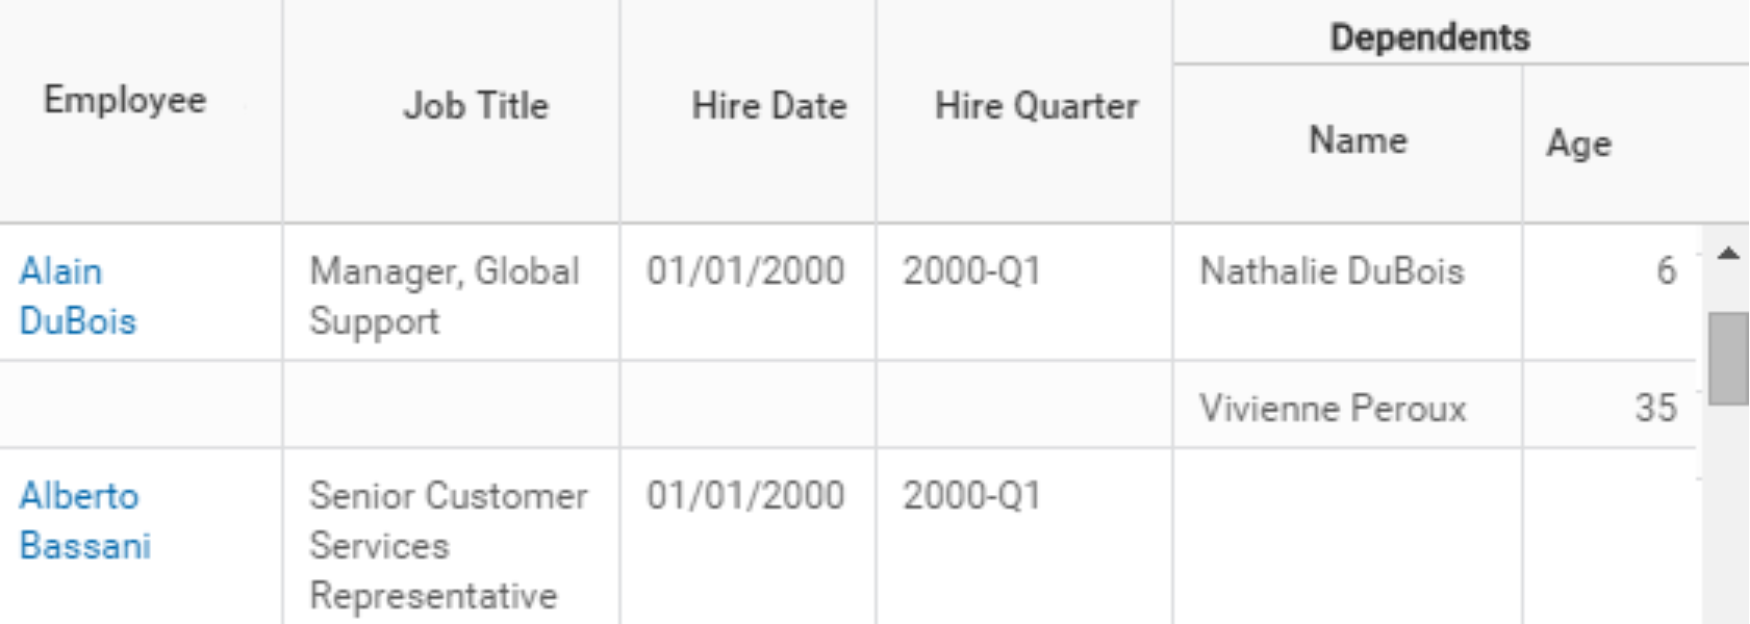
If you create a report with All Dependents as the report data source, then the primary business object is Dependent. The report shows one row for each instance of Dependent. Notice that Alain DuBois appears twice in the table (once for each dependent).
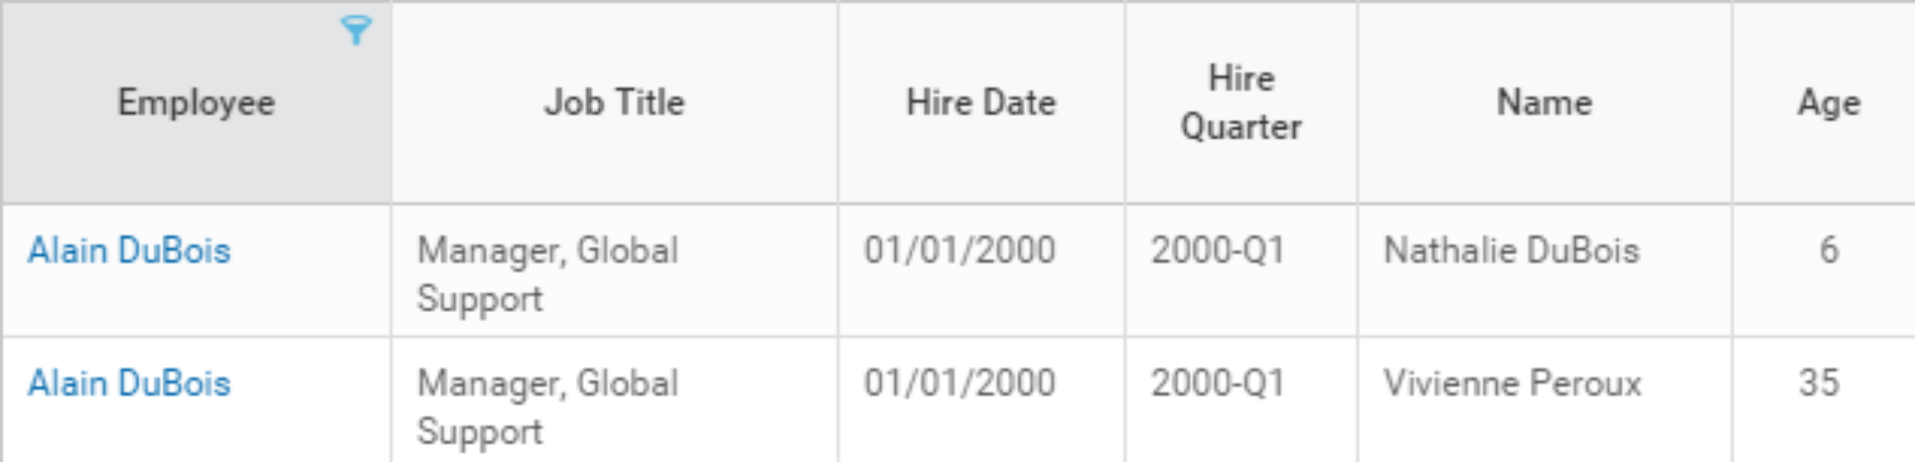
Both data sources let you access the same information, but the information displays differently. You need to understand how users want to view, sort, and filter the data in order to pick the best report data source for the report.
Each data source has an association with a primary business object, and has its own security. The defined access for a data source controls whether a user can create or run a custom report that uses that data source. Each data source has a list of permitted security groups. You must have access to a permitted security group to create a report using the data source or run the report. In addition, you can only share a report with users who have access to the report's data source.
There are four types of data sources:
- Standard
- Indexed
- Business View
- Prism
Standard Data Sources
Most data sources in Workday are standard data sources. A given Workday business object can have several standard data sources associated with it, each representing a different filter or selection into instances of that object. Think of the data source as a starting filter. Choose the data source that returns the smallest dataset that still includes all needed data. This is more efficient than using a data source that returns a larger dataset and applying filters to only display a subset of the data.
A data source can contain all instances of the primary business object (e.g., All Workers), or it can have built-in, Workday-defined filtering logic (e.g., All Active and Terminated Workers). If the data source has built-in filtering, the filter comparison value is either built into the data source (e.g., All Active Employees) or displays as a user prompt. In the prompt, the user enters the comparison value when running the report (e.g., Employees by Organization).
The following example shows different standard data sources for the Worker and Employee business objects. The All Workers data source returns all active, terminated, and future workers. The All Active and Terminated Workers data source returns active and terminated workers, but not future workers. The All Active Employees data source returns active employees, but not contingent, terminated, or future workers. For optimal performance, choose the data source that returns the smallest dataset that contains all needed data. If you only want to report on active employees, then choose the All Active Employees data source for a more efficient report.
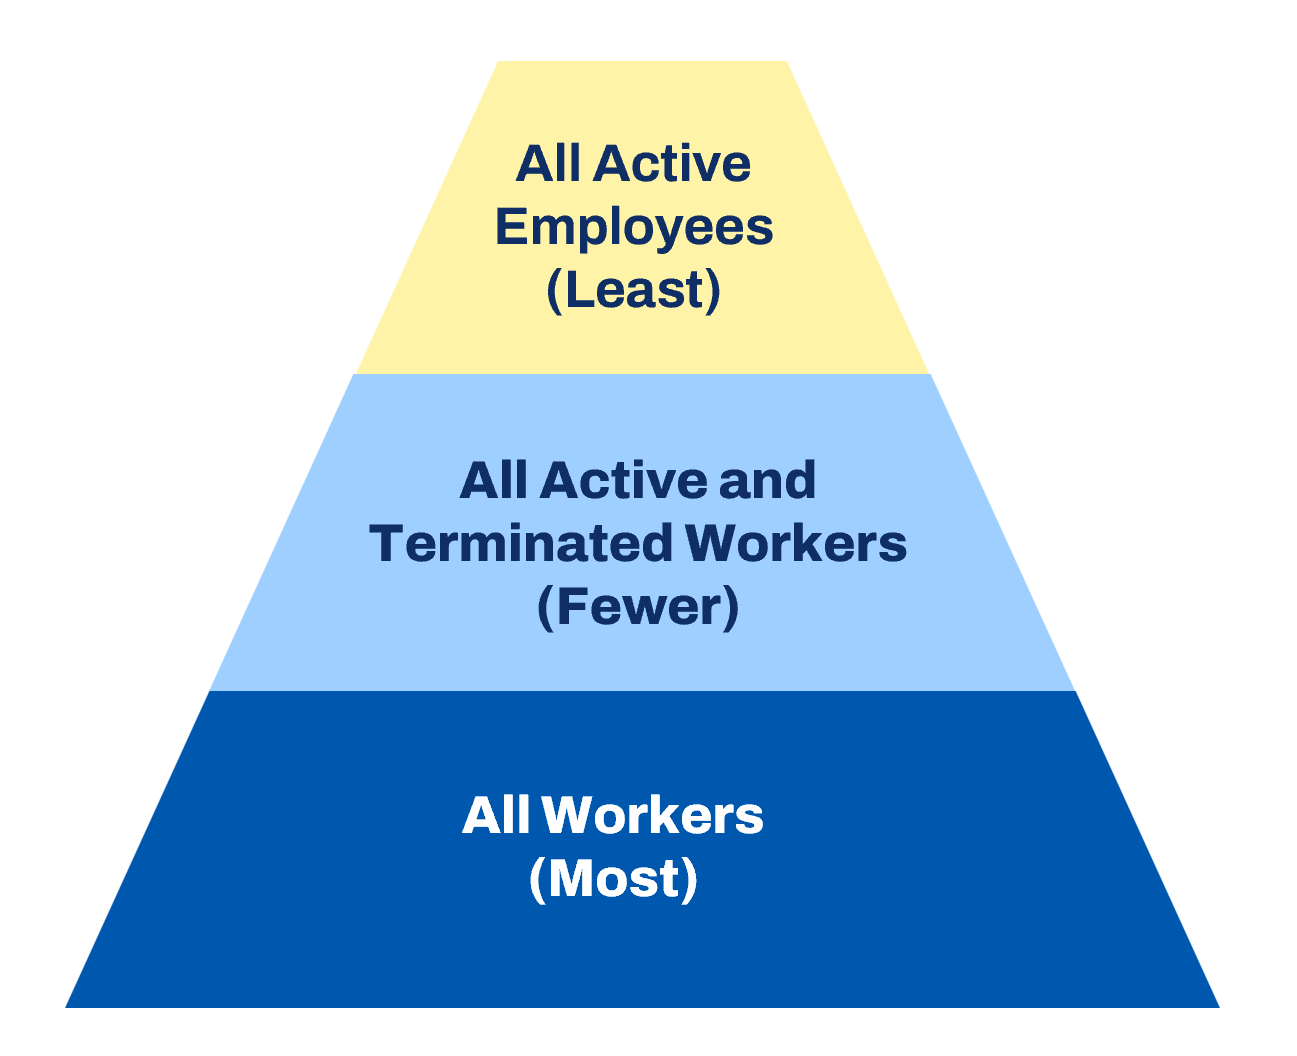
Standard Data Source Performance Considerations
When selecting a data source for your report, be aware of your report's performance. There are a wide variety of standard data sources that range from very broad to very specific. However, all standard data sources cause your report to run slower than an indexed data source does. Therefore, try to select an indexed data source if it includes all the fields you need. This is especially true when reporting on large volumes of data, such as all workers in your organization.
Indexed Data Sources
Indexed data sources are a special type of data source optimized for performance, aggregation, and faceted filtering on large volumes of data. Try to use these whenever possible to get the best performing reports.
When you create a custom report using an indexed data source, a prompt enables you to select from a list of predefined filters (if available for that indexed data source). Data source filters are secured so users can only use filters they have access to.
To gain the performance benefits of indexed data sources, use indexed delivered fields. Nonindexed fields are usable but will not realize indexing benefits. Additionally, fields may be indexed for different purposes. The biggest impact to performance is using a field for grouping, aggregation, or filtering that is not indexed for those purposes. Nonindexed fields in detailed reports do not have as great an impact to the overall performance.
The following is a sample list of indexed data sources available in Workday:
|
|
Just like with standard data sources, a given Workday business object can have multiple indexed data sources associated with it. Each indexed data source provides a different filter into instances of that object. For example, the Journal Line business object has two indexed data sources: Journal Lines and Journal Lines for Financial Reporting. The Journal Lines data source returns more instances than the Journal Lines for Financial Reporting data source. For optimal performance, you should choose the data source that returns the smallest dataset that contains all needed data.
Business View Data Sources
A business view data source is a Workday-delivered data source that blends and curates data from multiple underlying Workday-delivered data sources, known as component data sources. This simplifies reporting by presenting a focused and user-friendly perspective on your data.
Key characteristics of a business view data source include:
- Data Blending: It can either join or union data from its various component data sources.
- Curation: It curates the final list of available fields from the component data sources, which can reduce complexity and potential confusion for report writers.
- Filtering: It can filter the instances (records) of data that are returned.
- Unique Primary Business Object: Although it pulls from multiple sources, the business view data source has its own primary business object, which typically shares the same name as the data source itself.
You can customize these data sources to fit your organization's specific needs using the
Configure Delivered Business Views
task. This task allows you to add, change, hide, or delete fields and update field descriptions.Supported Functionality
You can use business view data sources to create the following types of custom reports, though some limitations apply:
- Advanced: Most features are supported, with the exception of Facets, Enable as Web Service, Enable for Prism, and Enable for Worksheets.
- Matrix: Most features are supported, but Facets, Lookup Prior Value calculations, and Enable for Worksheets are not. Drill Down and Drill By features require configuration.
- Simple: All features are supported.
Business view data sources cannot be used for:
- Scorecard reports
- Drill-to reports
- Workday Query Language (WQL) queries
- Dashboards
- Discovery boards
Prism Data Sources
A Prism data source is a type of data source that gets its data from a Prism Analytics table or dataset. It is typically used to blend Workday and non-Workday data for analysis.
Key characteristics of a Prism data source include:
- User-Created: Prism data sources are created by users within your organization, not delivered by Workday.
- Standalone Primary Business Object: They have their own primary business object that is not linked to other business objects in Workday.
- Can Be Inactivated or Deleted: You can make a Prism data source inactive, which empties it and makes it unavailable for reporting, or you can delete it entirely if it's not in use.
- Security: Access to Prism data sources is controlled by security groups.
- Limited Functionality: They support a more limited set of report types, field types, and calculated fields compared to standard Workday data sources.
Additional Training
:
You can find more information in the Prism Analytics for Administrators
course.Indexed Report Fields
Reports that use indexed data sources typically perform faster than those using standard data sources. However, there are still some things to consider when trying to maximize your indexed report's performance. One example of this is the selection of fields for your report columns and filters. When selecting the fields for your report, you can use a field's Related Actions to display indexing information.
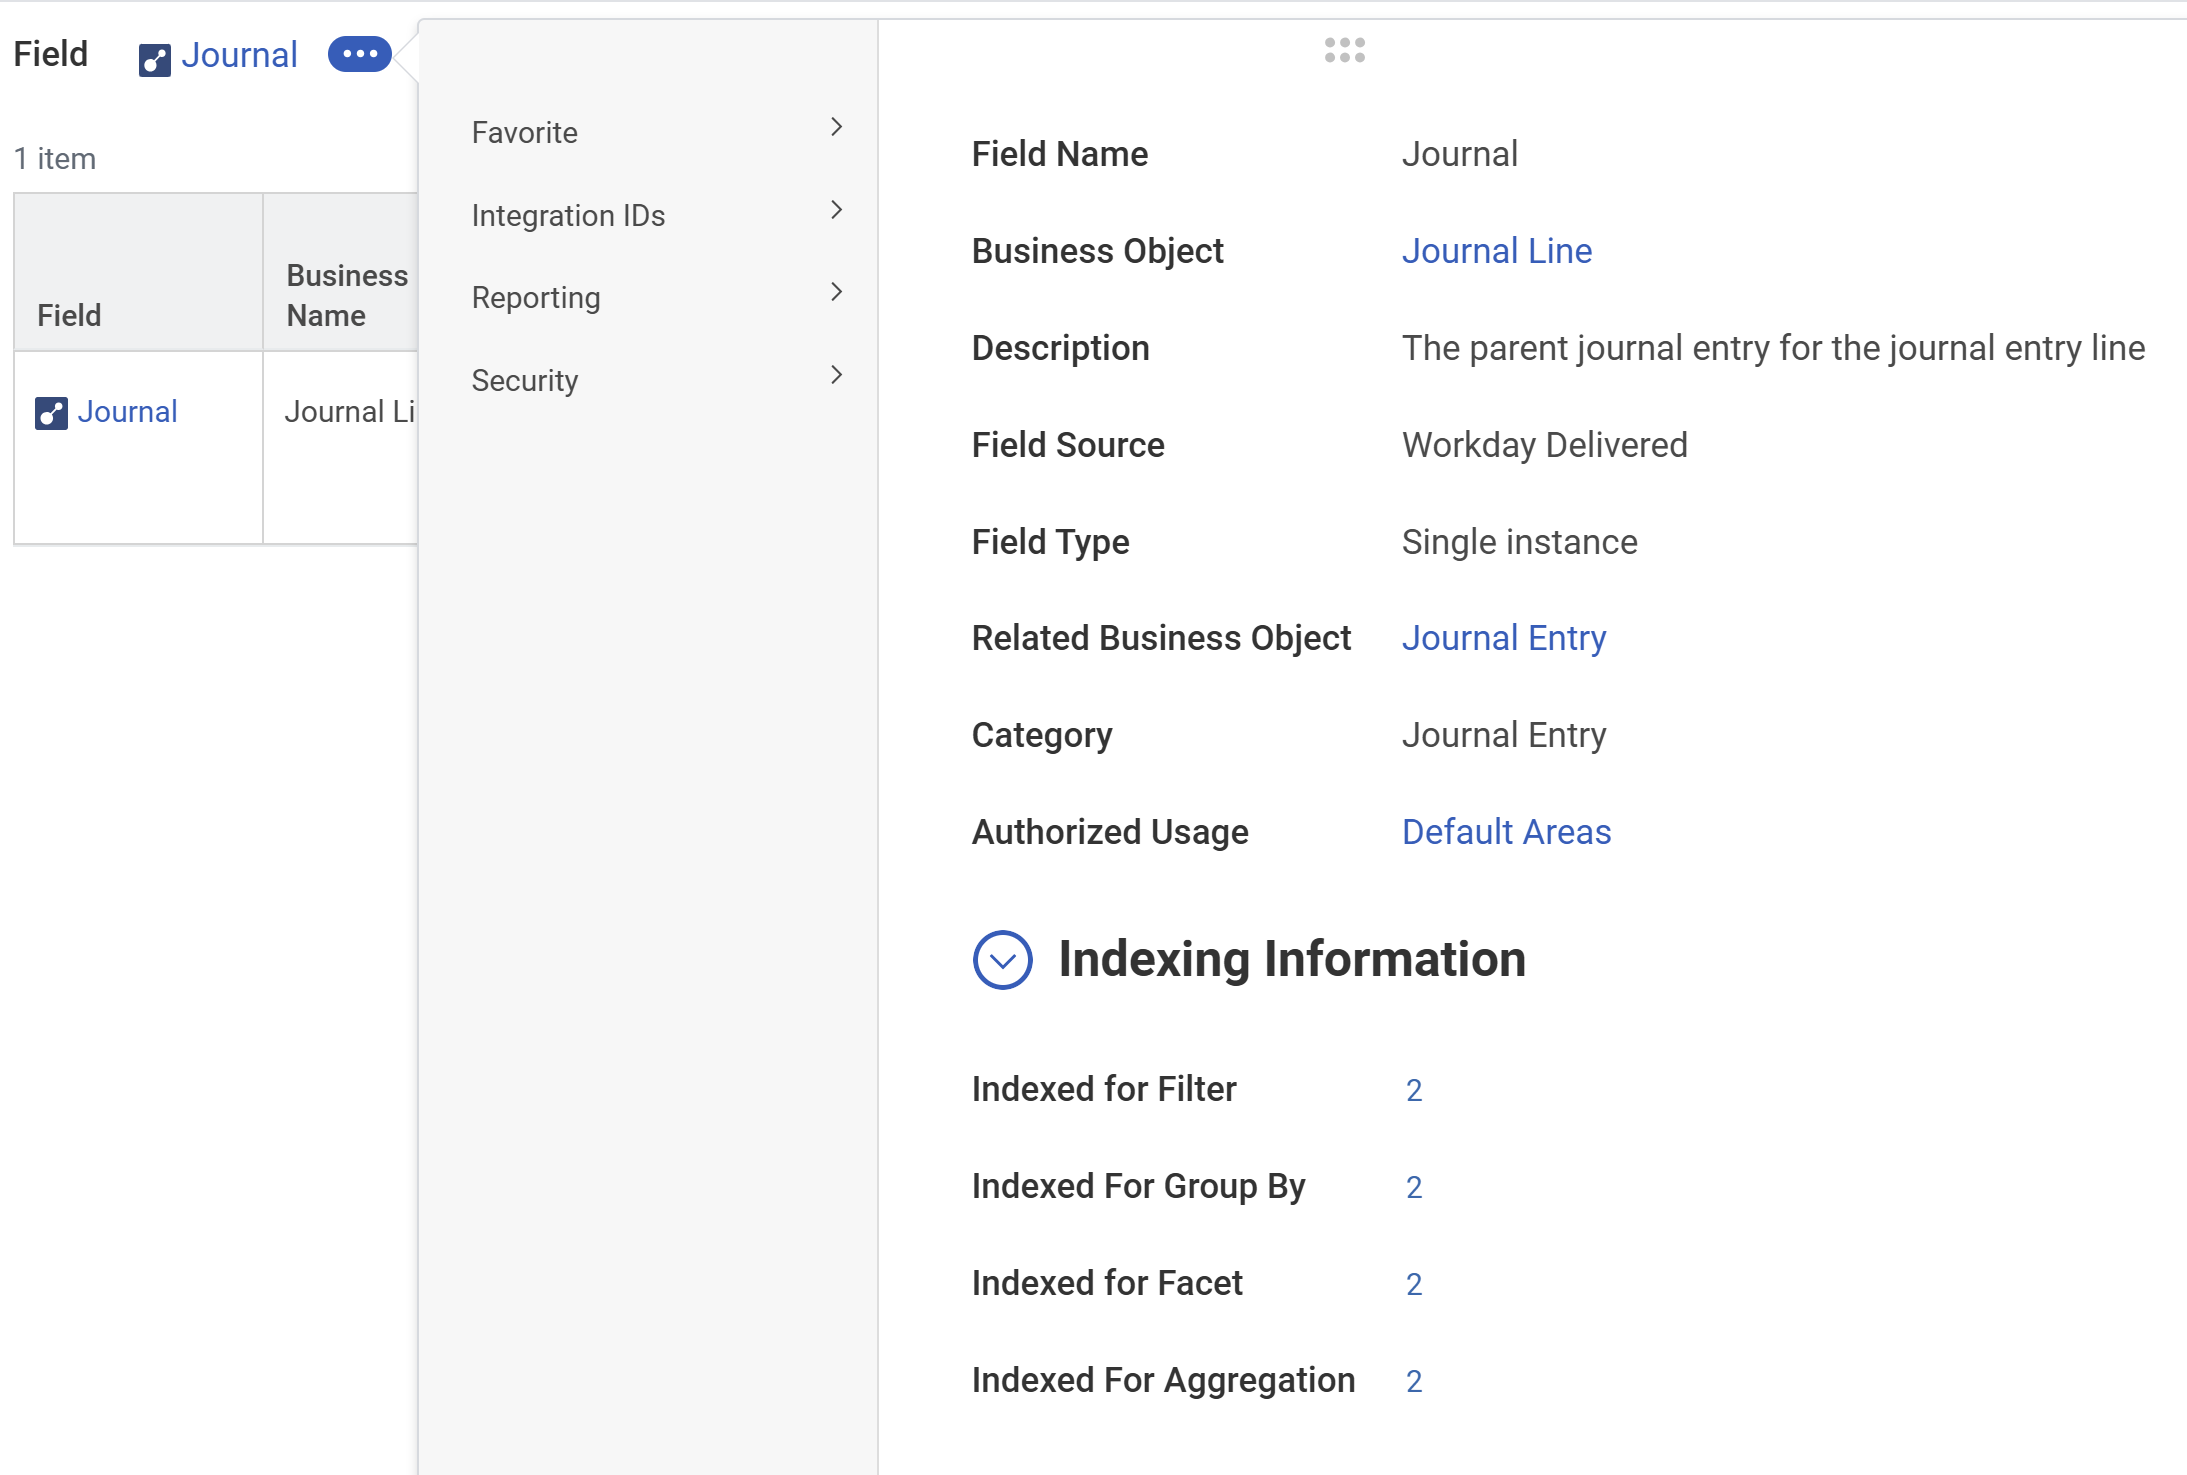
When creating a report with an indexed data source, try to use only fields indexed for that data source. Using nonindexed fields as columns or filters on your report hurts your report's performance and, in some cases, can cause significant slowdown.
Optimized for Performance Option
You may notice the Optimized for Performance checkbox when creating or copying a report with an indexed data source. This option appears on the following report types:
- Advanced
- Matrix
- Simple
- Transposed
- Trending
Selecting this option during report creation restricts you to adding only indexed data sources and fields to your report. This way, you can ensure that your custom report performs in the fastest way possible. Remember, even if you use an indexed data source, including nonindexed fields in your report causes the report to run in the slower hybrid mode.
When you create a custom report, the system enables this option by default. Note that leaving this default setting restricts the fields available for inclusion in your report. Use the
Business Object Details
or Report Fields
report to verify the indexed status of the fields you want to include in your report columns or filters.Data Source Filters
When using an indexed data source for your report, you can identify a data source filter, which also affects your report performance. Just as a data source homes in on the data available from a business object, a data source filter limits or reorganizes data that displays in your report.
An indexed data source may have multiple data source filters. Use the Data Source Filter field to identify a valid data source filter for your report.
For example, when using the Workers for HCM Reporting indexed data source, you can use several data source filters to further refine the report data.
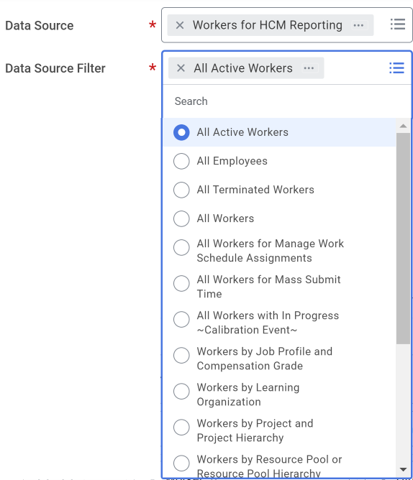
Just like data sources, you can use a data source filter's Related Actions to view a description of the data source filter, along with the data source and security information. These descriptions let you know if the data source filter includes additional prompts. You can also often find tips on how to best apply the data source filter.
If you plan on adding filters to your report definition, consider using a data source filter on your report. At report runtime, the system applies any filters you include on the definition. Including multiple filters can negatively impact your report performance. However, if you use a data source filter to home in on more specific data, you should not need as many filters. The data is pre-filtered before report runtime, which can vastly improve performance and let you access the specific data you need as quickly as possible.
Class Report Fields
Each business object has many Class Report Fields (CRFs). When creating custom reports, you can display, sort, filter, and create prompts for Workday-delivered fields, calculated fields, and custom fields.
Class Report Fields (CRFs) can be simple types or object types. Simple types are not actionable and appear as black text. Object types are actionable and appear as blue text. System security controls access to class report fields.
A field type icon accompanies each Class Report Field (CRF).
Icon | Definition |
|---|---|

| Text - Represents a simple text field, such as First Name. |

| Numeric - Represents a numeric field, such as Employee Count. |

| Currency - Represents a currency field, such as Base Pay. |

| Date - Represents a date field, such as Hire Date. |

| Boolean - Represents a true/false field, such as Active Status. |

| Single instance - Represents a one-to-one (1:1) relationship between two objects. For example, one employee can have one pay group association. |

| Multi-instance - Represents a one-to-many (1:M) relationship between two objects. For example, one worker can have multiple dependents. |

| Self-referencing instance : A reference back to itself. For example, a self-referencing instance of a worker identifies the worker and allows you to drill into the details and access related actions. |
Determining the Primary Business Object and Data Source
To determine the primary business object and data source when creating a custom report, there are several questions to consider:
- Which business objects contain the fields needed in the report?
- If there are multiple business objects:
- Are these business objects related?
- Which should be the primary business object?
- Which should be the related business object?
- Which field links the two business objects together?
- Which data source should I use?
Business Object Details Report
The
Business Object Details
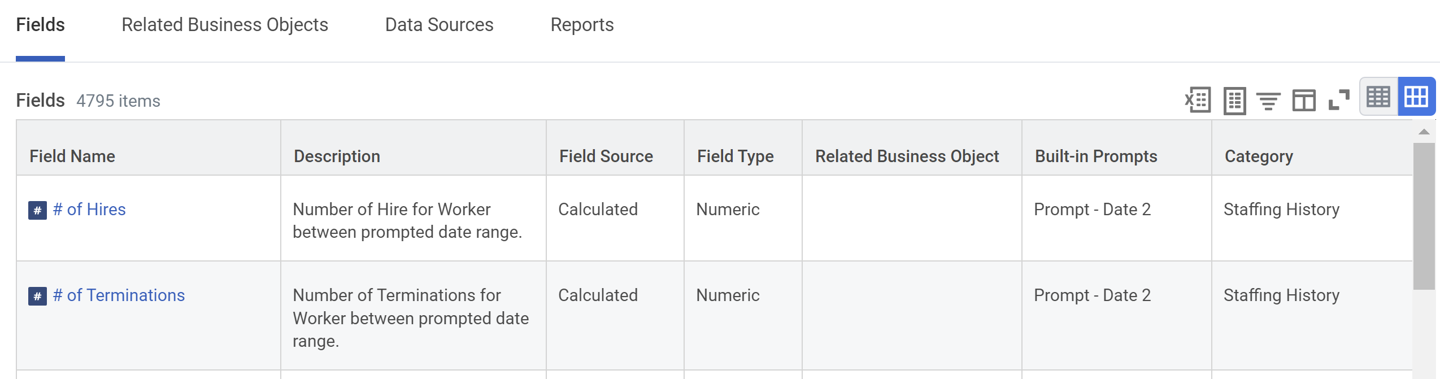
report can help you understand and navigate the Workday object model. Knowing how business objects relate to each other and which data sources are available is invaluable when building reports. We recommend starting with this report first to get an idea of what objects you might use in your custom report. You can also use this report to get a list of data sources.When you run this report, it will first prompt you to select which business object you want to view details for. Then, the report displays up to four tabs: Fields, Related Business Objects, Data Sources, and Reports. If the business object does not contain data for one of these tabs, the system hides the tab.
Fields Tab
The Fields tab in the image below shows all available delivered, calculated, and custom fields for the business object. You can filter by a column in the report to narrow down which fields display. For example, you might filter the Field Source field to only show calculated fields.
Related Business Objects Tab
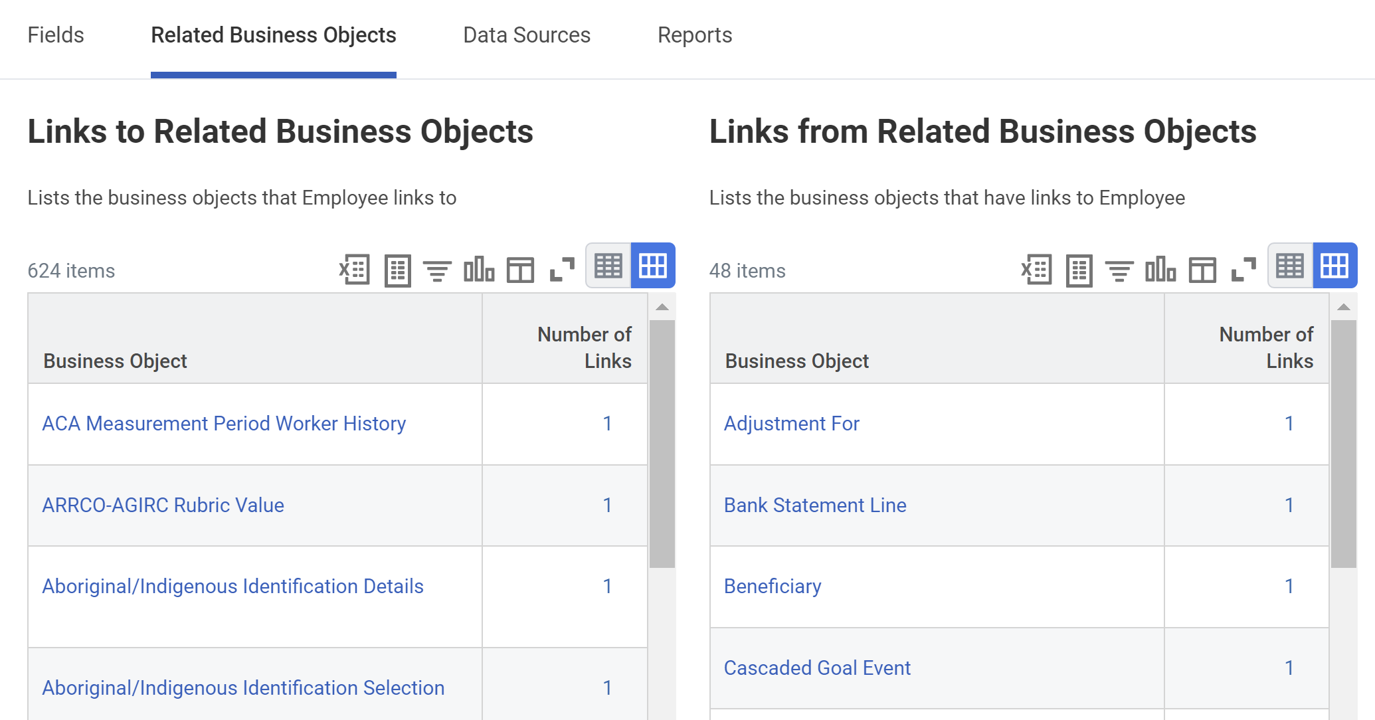
The Related Business Objects tab shows information about the relationships between this business object and other business objects. The tab displays two sections of information. On the left side, displays the list of business objects that this business object links to. On the right side, displays the list of business objects that link to this business object.
Note
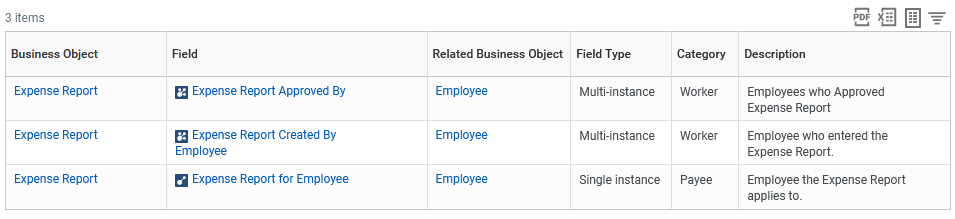
: Depending on your browser width, the Links to Related Business Objects grid may appear above the Links from Related Business Objects grid, instead of side by side.You can select the number in the Number of Links column to check which fields link the business objects together. In the following example, there are three fields that link from the Expense Report business object to the Employee business object.
Data Sources Tab
The Data Sources tab displays available data sources for the business object. You can view more general data sources as well as more specific data sources.
Note
: If the Data Sources tab does not display, then there are no delivered data sources for the business object. This means you cannot use the business object as the primary business object for a report. Consider using a related business object to access the data you need.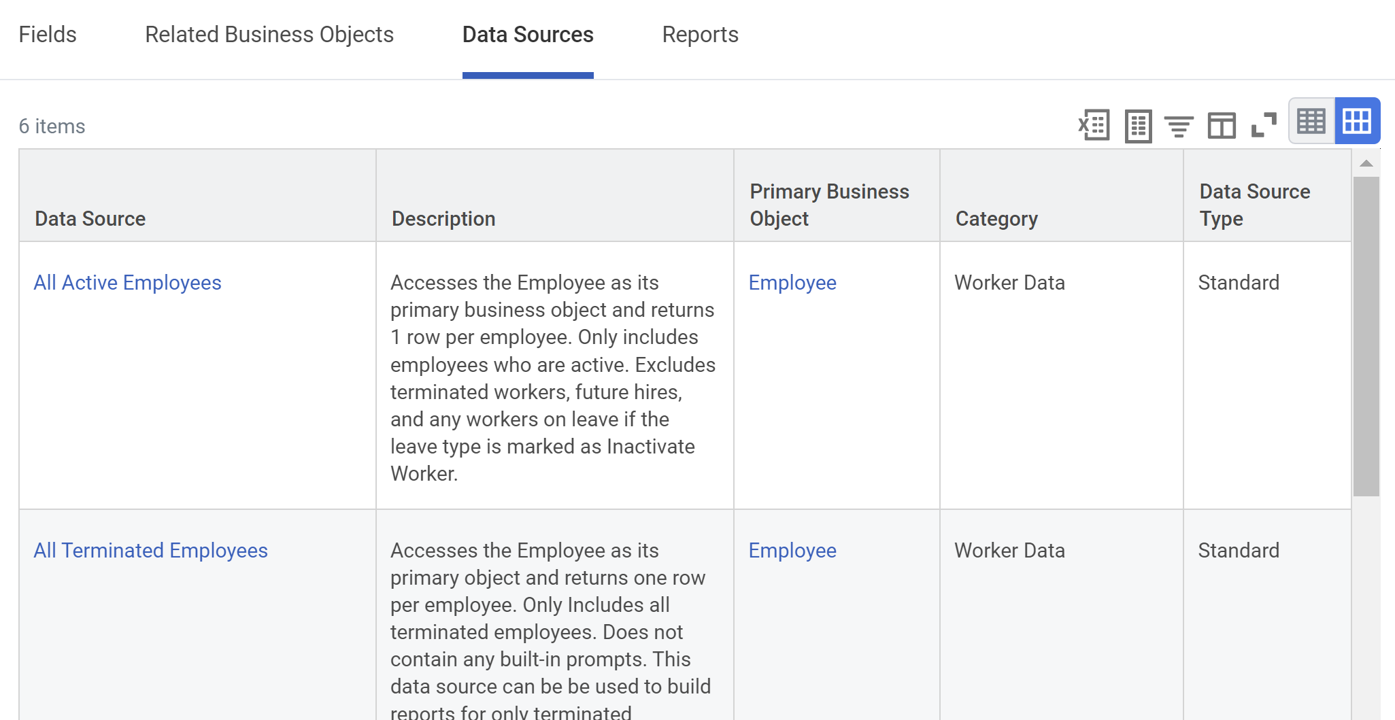
Reports Tab
The Reports tab displays reports in the tenant (both standard and custom) that use the given business object. You can use these reports as a reference when writing reports for this business object.
You can select the Reports Displaying Business Object at Second-Level button to display the reports that include this business object as a related object.
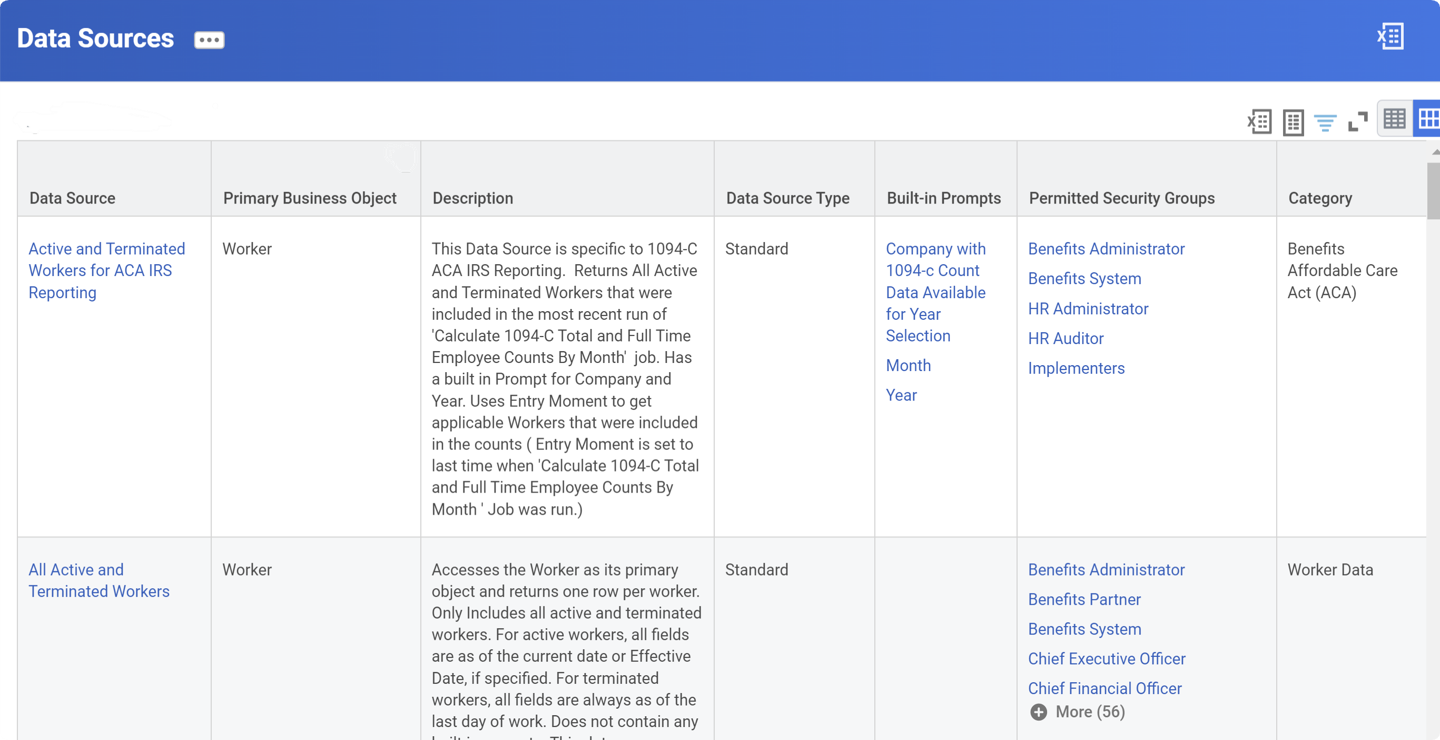
Data Sources Report
Another useful research report is the
Data Sources
report, as shown in the image below. This report helps you understand:- Whether a data source is standard or indexed
- If the data source includes built-in prompts
- Permitted security groups for the data source
You can filter the report by category to narrow down the data sources.
Report Fields Report
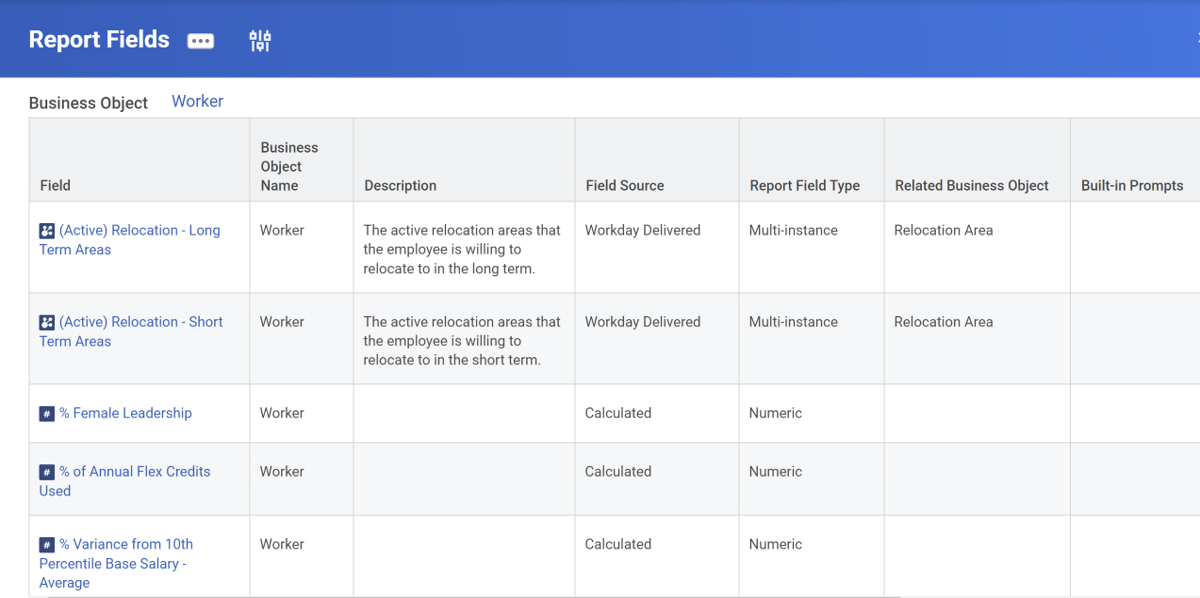
Use the
Report Fields
report to investigate:- What fields exist on a business object.
- What business objects are anchored to a certain field.
- Aspects of a report field including type, description, RBO, built-in prompts, and so on.
Upon running the report, you are prompted for Report Field and Business Object. Neither prompt is required.
Contextual Reporting
You can use contextual reporting in Workday when you are not sure of the business object and report fields for the data you want to report on.
You can also use contextual reporting to view existing reports you may want to repurpose or customize.
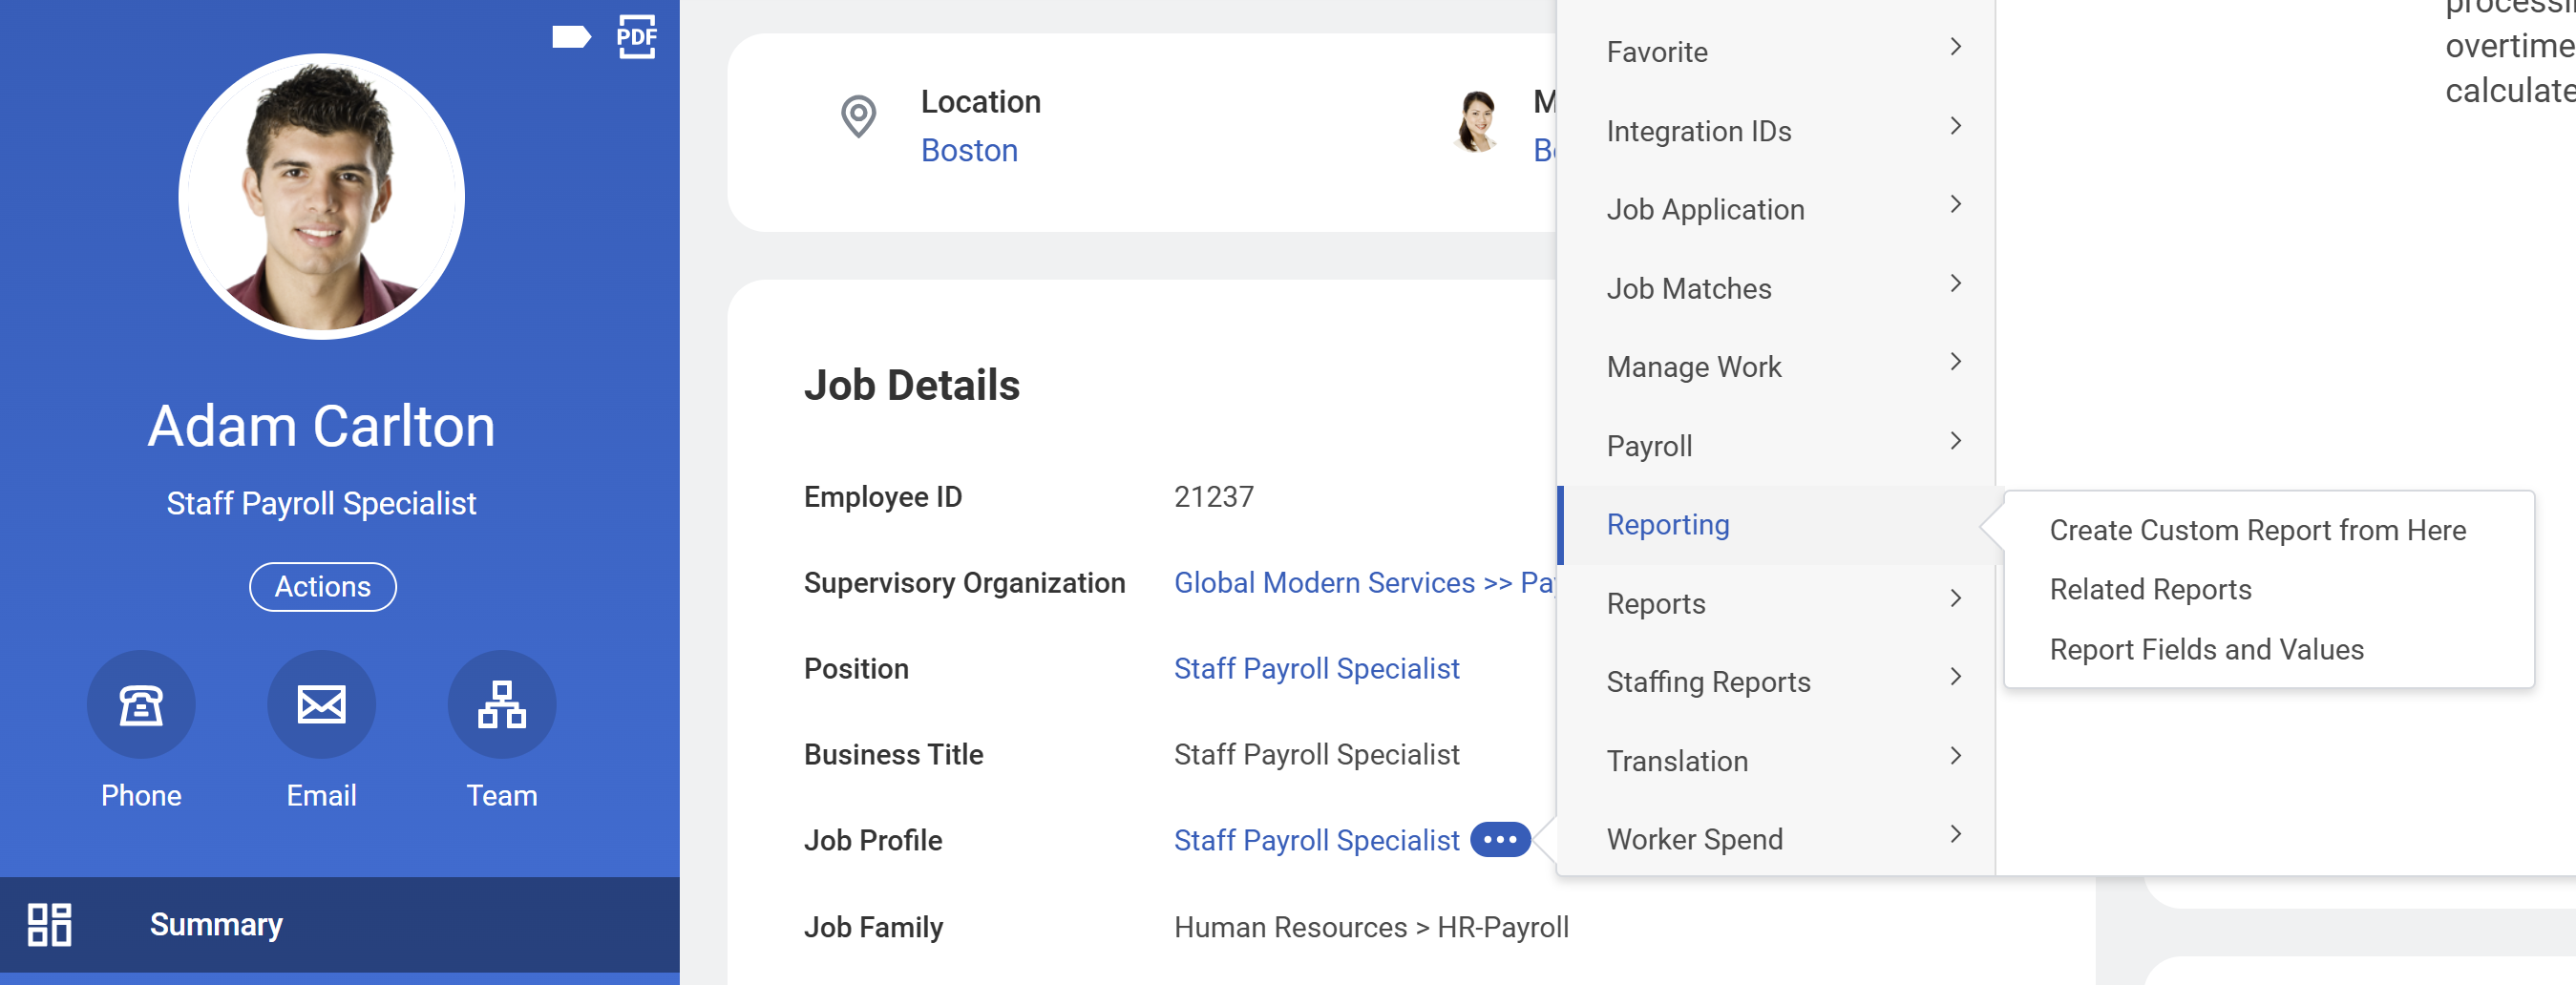
From any object's Related Actions icon, select Reporting to access three choices:
Related Action | Definition |
|---|---|
Create Custom Report from Here | Create a custom Report Writer report with the selected object as the basis for the data available. Workday automatically restricts the data sources available for the report to those associated with the object. |
Related Reports | Displays all reports, whether custom or Workday-delivered, that use the selected business object as the primary object on the report. |
Report Fields and Values | Displays all the report fields and values related to the selected business object. This option only displays fields that you can access. You can sort, filter, and export the fields to Excel. This helps you become familiar with the Workday fields by viewing them within the context of your own data. |
The image below displays the job profile for an employee. Using contextual reporting, you can either (1) create a custom report about compensation changes, (2) see related reports that are about compensation changes, or (3) see all the report fields and values around a compensation change event.
Designing a Custom Report
There are several questions to consider when designing a custom report before building it:
- Where is the data I need?
- What view of the data do I need?
- What fields should display?
- How should the data group or sort?
- How should I filter the data?
- How should the output display?
- Who is this report for? Who should I share the report with?
- Is there an existing report that I can use as a starting point?
You can use the
Create Custom Report
task to create a custom report. When creating a report, you must specify the Report Name, Report Type, and Data Source. You can also select the Temporary Report and Enable as Web Service options, which we explore later in this chapter.Reminder
: A user's access to data sources drives data source selection for the report.Note
: Selecting the data source determines the primary business object for the report. Once you define the primary business object for a report, you can only change the report's data source to another data source on the same primary business object. You cannot change the primary business object for a report.Report Name
You should establish a naming convention as a best practice to make your reports easy to find.
Report Types
Workday Report Writer provides several report types for creating custom reports and custom analytic solutions. You use the advanced and matrix report types most commonly.
Report Type | Definition |
|---|---|
Simple
| Simple reports provide straightforward design options for the occasional user to create reports quickly and easily with limited options. You can display, sort, and filter data from a primary business object. These reports are not shareable. |
Advanced
| Advanced reports allow you to display data from the primary and related business objects. These reports are shareable. You can sort and filter the data, show groupings, and display sub- and grand totals. You can also add charts and enable the report as a worklet or web service. |
Matrix
| Matrix reports allow you to group data, summarize the metrics for each grouping, and drill into the summarizations for further analysis. In addition, matrix reports also provide for filtering, charts, worklets, and report sharing. |
Composite
| Composite reports enable you to combine data from multiple data sources into a single report by using advanced or matrix subreports. |
Search
| Search reports display search results based on facet-filter selection values. |
nBox
| nBox reports count data and display the results in a two-dimensional matrix. |
Trending
| Trending reports enable you to report on and analyze trends in worker data, such as headcount and attrition over a period of time. |
Transposed
| Transposed reports interchange the rows and corresponding columns on the report, allowing you to create reports that enable side-by-side comparisons. |
Data Sources
When creating a custom report, the most important decision is selecting your data source. The data source drives the primary business object and view of the data. Data sources provide the starting filter for your report. You can search for data sources by name, category, business object, or a combination of category and business object.
Workday defines and delivers one or more data sources for most business objects.
Temporary Report
When you create a report, you can select the Temporary Report checkbox to designate it as temporary. When you mark a report as temporary, it has a defined period of time before it expires and becomes eligible for deletion in the tenant. By default, a temporary report expires after seven days. For reports that are not the Simple report type, you can change the expiration information on the Advanced tab.
Use the
Delete Temporary Report Definitions
task to delete temporary reports in a tenant that have expired and are eligible for deletion. You can schedule this task to run once, or on a daily, weekly, or monthly recurrence. This process permanently purges expired reports from your Workday tenant.Security Note
: You must have access to the Analytics Data: Report Fields and Values security domain to schedule reports for deletion.Note
: If you create a custom report and then cancel the report, or if your session times out, your report is saved as a temporary report. Delete the report or change the report options so it is no longer a temporary report.You may not want to give all Report Writers the ability to create permanent reports that consume system resources indefinitely. Therefore, Workday enables you to restrict specific Report Writer users so that they only have the ability to create temporary report definitions. Report Administrators can still access these temporary reports to mark them as permanent or change the expiration dates as needed.
Security Note
: Users associated with security groups configured for the Ability to Create Only Temporary Reports security domain are limited to just temporary reports. This access can support ad hoc reporting needs and can help separate groups of report writers in the tenant.Web Service Enabled
Selecting the
Enable as Web Service
checkbox allows the custom report to be used in an outbound integration (Reporting-as-a-Service (RaaS)), and makes the report available to the Business Intelligence Reporting Tool (BIRT) and PRISM Analytics. You can configure additional web services options on the Advanced tab.Custom Report Tabs
When creating a custom report using the Advanced Report type, configure the report using these tabs:
Option | Description |
|---|---|
Columns | Select the fields to include on the report and specify their sequence. The Columns grid contains one row for each column. In each row, define the business object, field, column heading overrides, and options for how the field should display. Security Note : You can only add fields that you have access to. |
Sort | Control the order to present and group data. This tab applies sorting for data on the primary business object and subsorting for data on related business objects. You can also specify options for displaying subtotals, grand totals, and outlines. Advanced reports sort data based on a unique ID for efficiency. In other report types, if you do not specify sorting or grouping criteria, sorting is based on the first (left-most) column associated with the primary business object. |
Filter | Add conditions to filter the primary business object. |
Subfilter | Add conditions to filter the related business objects. You can add subfilters for multiple related business objects. |
Prompts | Specify prompt-related data about your report, including populating undefined prompt values. You can set default values for prompts, so users do not have to enter values when running a report. You can also hide prompts that have default values, so that they do not appear to users at run time. |
Output | Override the default output options, including output type, worklet options, and help text. By default, a custom report renders as a table. You can change this to display the report as a chart, chart and table, or gauge. By default, the system does not enable custom reports for use as worklets, but you can change this setting. |
Share | Share the report with other users or groups. By default, only the report owner can view a custom report. You can only share a report with users who have access to the report data source. Sharing a report allows other users to run and copy the report. |
Advanced | Defines additional report options. Some include enabling save parameters, enabling a report as a web service, enabling a report for Worksheets, or changing the expiration information for temporary reports. |
Adding Fields from Related Business Objects
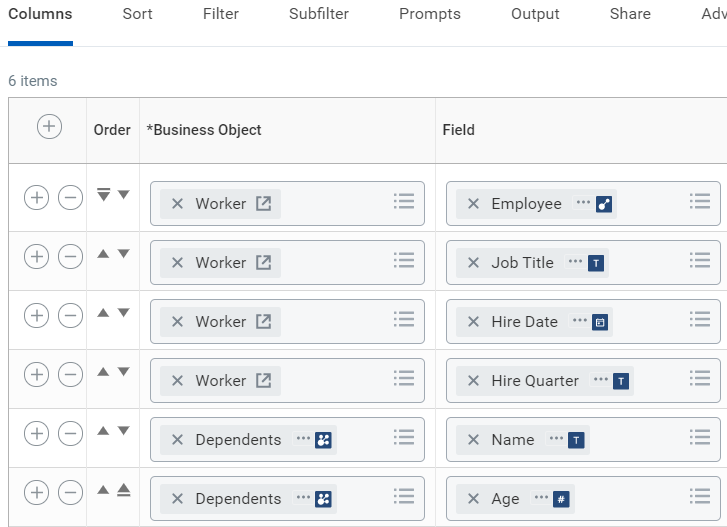
You already know how to add fields from the primary business object. Depending on the report type, you can also add fields from related business objects. On the Columns tab, you specify the business object and field for the related data. A given custom report definition can include fields from more than one related business object. Additionally, you can select a field that links the PBO and RBO together.
In the following example, the Dependents field links a report using the Worker PBO to the Dependent RBO. This allows you to pull fields from the RBO into your report as well.
Note
: When building a report using the Advanced report type, you can only access fields from related business objects that are one level deep. To access fields from RBOs that are more than one level deep, you need to create a calculated field.Chapter Summary
Key Takeaways:
- Reports in Workday are built-in application features.
- You can copy Report Writer standard reports, but not XpressO standard reports.
- You can use report tags to easily find reports.
- The RDS determines which PBO the report uses.
- You can add fields from the PBO and the RBOs to the advanced type report.
- Class report fields can be simple types or object types.