FORECAST.WD.SEASONAL
Description
Returns a predicted sequence of values using patterns in the historical linear and non-linear
data you specify.
Syntax
FORECAST.WD.SEASONAL(
values
,
num_forecast
)
- values: An array of historical values to predict from.
- num_forecast: The number of values to predict.
Example
An analyst wants to predict revenue values for the 12 months of 2017 based on historical revenue
values from 2012 through 2016. The values for 2012-2016 are in cells C2 through C61.
This table excerpt shows the values from 2012:
A | B | C | |
1 | Year | Month | Actual Total Rev per Month (millions) |
2 | 2012 | Jan | 0.984 |
3 | 2012 | Feb | 1.012 |
4 | 2012 | Mar | 1.045 |
5 | 2012 | Apr | 1.109 |
6 | 2012 | May | 1.112 |
7 | 2012 | Jun | 1.458 |
8 | 2012 | Jul | 1.892 |
9 | 2012 | Aug | 2.018 |
10 | 2012 | Sep | 2.203 |
11 | 2012 | Oct | 2.43 |
12 | 2012 | Nov | 1.897 |
13 | 2012 | Dec | 0.894 |
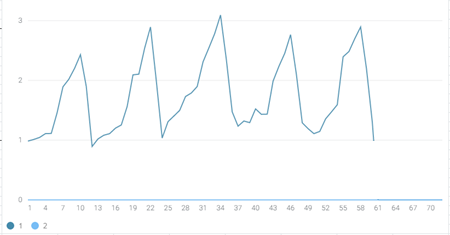
This graph shows the values as a dark blue line:
This formula adds 12 predicted values to the workbook:
=FORECAST.WD.SEASONAL(
C2:C61
,
12
)
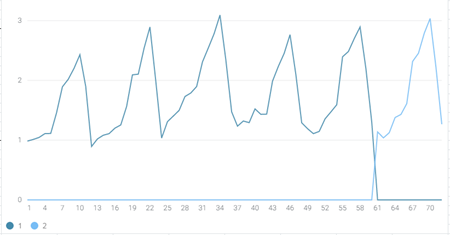
The light blue line in this graph shows the forecast values: