
Change Sheet View
Choose from these options to change your view of sheets. Be mindful of the sheet type you have open (learn to identify sheet types). These functions are available only when you're connected to
Adaptive Planning
:- Swap Axes
- Filter by Time Spans
- Filter Rows by Content
- Suppress Zeros and Blanks
- Change Dimensions, axes, and Coordinates
Swap Axes in Standard Sheets
This option is only available for standard sheets. You can swap the row and Planning pane filter in standard sheets.
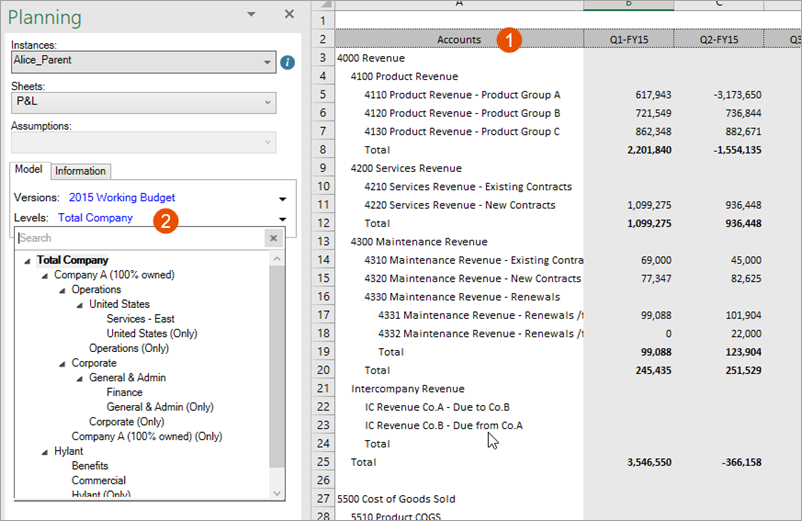
Option | Description |
|---|---|
1 | By default, you see the accounts listed down the rows of the first column |
2 | By default, you choose the levels from the drop-down in the Planning pane. |
To swap the filter and rows, right-click in the first column of the grid, and select
Planning
> View by level
.Now, you see the levels down the rows of the first column. You choose accounts in the Planning pane.
Change and Filter Time Spans in All Sheets
These display options are available to any sheet that has time ranges. To filter the time span on the grid:
- Verify that you are connected toAdaptive Planning.
- From the Planningtab ribbon, clickDisplay Options
 .
. - Click theTimetab.
- Select the start and end of the time range you want to view on the sheet.
- Select the columns to display for each year listed (which is based on the options selected for Start and End). You can make different selections for each year listed.
Learn more about the options and settings available.
- Examples of Time Span Displays
- Assume it's May of 2017:FieldCurrent Year Start, Current Quarter End, Display MonthsCurrent Year Offset Start, Current Quarter End, Display MonthsMonth Start, Current Month End, Display MonthsMonth Start, Current Month End, Display CombinationStart Selection:Current YearOffset: 0Current YearOffset: -1Month and select April 2016Month and select April 2016End Selection:Current QuarterOffset: 0Current QuarterOffset: 2Current MonthCurrent MonthColumn Displays:Months for all yearsMonths for all yearsMonths for all yearsFor 2016, select quarterFor 2017, select monthResult:Start: January 2017End: June 2017Start: January 2016End: December 2017Start: April 2016End: May 2017Q2, Q3, and Q4 for 2016, followed by January, February, March, April and May of 2017
Filter by Content in Modeled Sheets
This option is only available in modeled sheets. Modeled sheets often have many rows of content. Use the filters to:
- Find relevant data
- Reduce the size of your sheet
- Eliminate scrolling
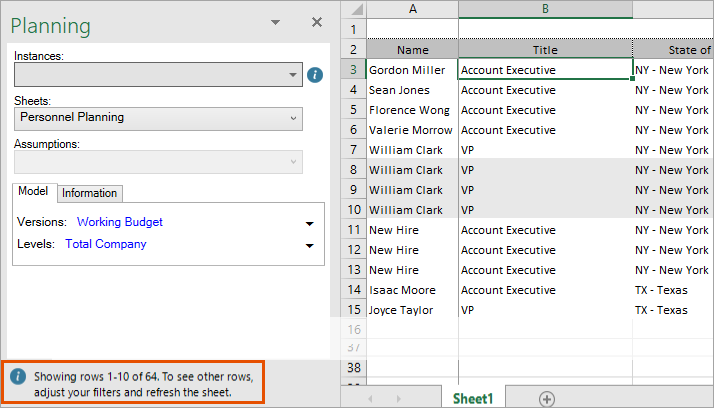
- See different sets of data if your admin has limited the amount of rows a modeled sheet can display (you see an information note at the bottom if this is true)
If you're logged into
Adaptive Planning
online, using the filter will log you off. Save your work online before using the filter in Excel Interface for Planning
.- Verify that you are connected toAdaptive Planning.
- From the Planning ribbon, clickSheet Filters
 .
. - Select a column to filter. For example, if your sheet lists employees, you can select Name to filter by name.
- Select the operator for the filter rules: begins with, ends with, contains, does not contain, and so on.
- Enter the letters, words, or numbers in the empty field. For example, you can chooseNameandbegins with,and enter T. When you clickOK, the sheet shows only employees with names that begin with T.
- Click the plus icon to add more rules to the filter. You can select a different column or the same column and a different operator to further filter the sheet. For example, you can selectName,ends withand enter E. Now when you clickOK, the sheet shows only employees with names that begin with Tend with E.and
- ClickAdd Groupto add OR rules to your criteria. For example, you can selectNameandbegins withagain. Then, enter R. Now when you clickOK, the sheet shows employees whose names begin with T and end with Eemployees whose name begins with R.as well as
- ClickOK.
Add AND rules with the plus icon and OR rules with
Add Group
button.Suppress Zeros and Blanks in Standard and Cube Sheets
This option is only available for standard and cube sheets. To suppress zeros and blanks or to reveal zeros (especially if you're trying to enter new data):
- Verify that you are connected toAdaptive Planning.
- From the Planningtab ribbon, clickDisplay Options.
- Click theTimetab.
- At the bottom of the window, select or clearSuppress rows if all zeros or blanks. If zeros and blanks are suppressed, you won't see rows that have blank cells or cells that equal zero and you won't be able to enter new data in them.
Change Dimensions, Axes and Coordinates
These options are only available to cube sheets. Cube sheets have more options available in the Planning pane than other sheets, and you can further customize how the data of these sheets appear. Don't know if you're looking at a cube sheet? Learn how to identify sheet types.
Dimensions are built into cube sheets by your modeling admin.
Verify that you are connected to
Adaptive Planning
, and change any of the available display options for cube sheets from the Planning pane: Revert to the original display and undo all any display changes you have made.
 Swap rows and columns. For example, if you have time displayed across the columns and accounts displayed down the rows, click this button to display accounts across the columns and time down the rows.
 - Filter the data by dimensions: select various dimension values from the dropdown menus in the Planningpane. The data changes to reflect only the information related to that dimension.
- Add dimensions to the grid. Drag and drop any dimension listed in the Dimensionsbox to either the Columnsor Rowsbox to display the values of data for those dimensions.
Learn more about how to use Dimensions in
Excel Interface for Planning
.