
Concept: Scorecards
A scorecard helps to answer "how are we doing?" You can add a scorecard to a dashboard to present business performance in a concise visualization.
The following is an example of a scorecard showing to-date actuals, forecast, and quarter results for revenue, net income, and gross margin:
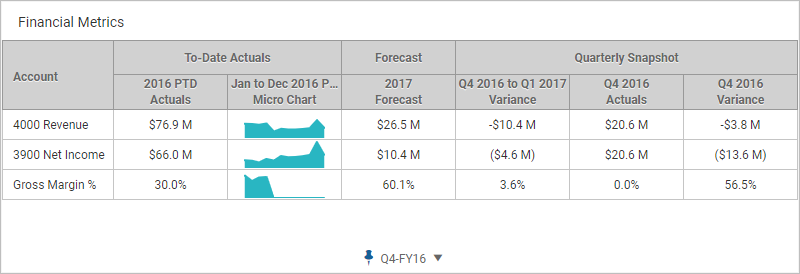
Layout of a Scorecard and Starter Columns
A scorecard is composed of rows and columns in sections, where:
- A row represents an data series.
- A column represents a slice of data based on data type, time alignment, version, and data range.
- A section groups like sets of data, such as actuals, budget, and variance for a period.
- Each section and column in the scorecard are settings in the Appearance Settings tab.
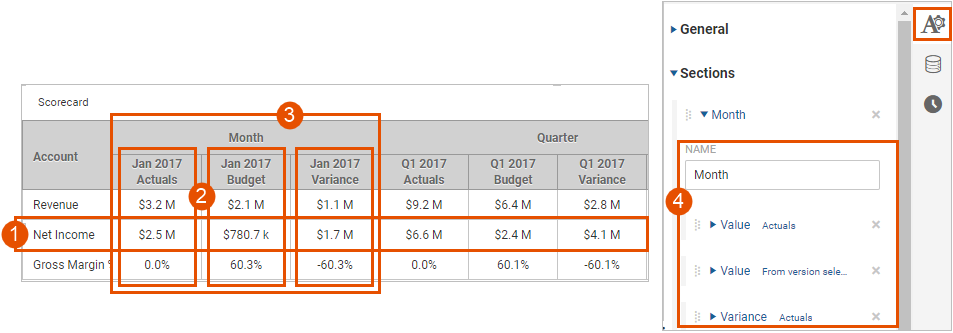
Scorecard Template Defaults
Once you add accounts to the scorecard, you see default sections and columns.
- Sections that are based on the calendar configuration of your instance. Example: If your instance calendar includes Month > Quarter > Year, your scorecard has three sections called Month, Quarter, and Year.
- The current time setting. Example: If the date is May 5, 2016, the data on the scorecard is for May, Q2, and FY 2016.
- A set of starter columns for each time period section. Thestarter columns represent common scorecard settings. Starter columns include:
Starter Column Header |
Appearance Settings for Starter Columns | Starter Column Defaults |
|---|---|---|
[Period] Actuals | Value Actuals | Shows actuals data as a numeric value for the time alignment, period, and date set relative to the time settings. |
[Period] [default version] | Value From Version Selector | Shows data from the default version as a numeric value for the time alignment, period, and data range set relative to the time settings. The column title varies based on your default version. |
[Period] Variance | Variance Actuals | Shows the difference between actuals (reference version) and the default (comparison version) as a numeric value for the time alignment, period, and date range set relative to the time settings. |
[Period] Micro Chart | Micro Chart From Version | Shows data from the default version as a micro line chart for the time alignment, period, and data range set relative to the time settings. The chart shows increments of the smallest time period on the chart. Does not show for the smallest time period on the chart. For example, the month section won't have a micro-chart if month is the smallest time period on your instance calendar. |