
Add Elements to Columns, Rows, and Cells
Every report requires that you add at least a time element and an account element. For a basic report,drag and drop elements into columns, rows, or cells. There's different techniques to use. You can add:
- A single element into a single column, row, or cell
- Multiple elements into a single column, row, or cell to display rollup data.
- Multiple elements into multiple columns, rows, or cells.
Before You Begin
Review Report Elements to understand what they are and how they work in
OfficeConnect
reports.Review Defaults Types and Precedence Rules to understand the defaults in place, such as Version and Organization level.
Basic Steps to Add Elements
Add elements to rows and columns instead of single cells. If you do add a different element to cells, be sure to label properly and add notes.
- In the grid, select the cells, rows, or columns where you want to apply reporting elements.
- In theReportingpane, select theElementstab.
- Click through the list of element types to see the elements you want to add. When you apply a bolded element to a single row or column, the report adds the underlying children too, each to its own row or column.
- Add the element to the highlighted selection:
- Drag and drop elements into selected cells, rows, and columns.
- Right-click an element and chooseApply to Selection.
- Click an element and clickApply to Selection
 in the toolbar.
If you add an element to a single cell, you receive a prompt from
OfficeConnect
asking you to confirm that you want the element to only be added to the cell and not the corresponding row or column:Expand All Option
In the
Elements
pane, right-click an element and select Expands All
to show all the items within an element. You can see everything that rolls up to the item you expanded. In the example, you expand all the Custom accounts to see all the custom accounts and their child accounts too.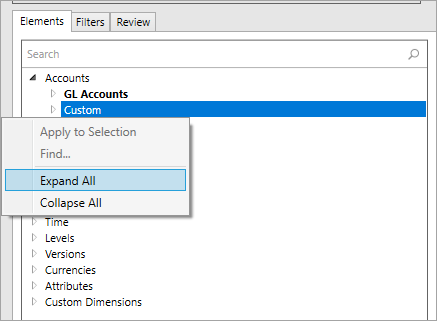
Collapse All Option
In the
Elements
pane, right-click an element and select Collapse All
to hide all the items of an element. You see only the top-level item and its siblings (if any). In the example, you collapse Assets to hide it's children. Now you can see its sibling accounts: Liabilities and Equities, Net Income, PL Income, and Non-Operating Income. 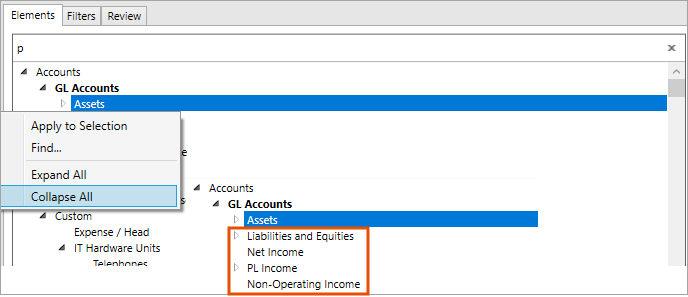
Add Single Element to Single Column, Row, or Cell
- Highlight an entire column, row, or cell.
- Drag and drop the element into the highlighted area.
- ClickRefresh.
If you add reporting elements or labels in merged cells of a reporting workbook, you can't update or refresh these cells using
OfficeConnect
.Add Multiple Elements to Single Column, Row, or Cell
- Highlight an entire column, row, or cell.
- Hold down the Ctrl key and click as many elements as you want.
- Drag the elements into the highlighted area.
- ClickRefresh.
- All the elements populate the one single column, row, or cell.
- Data rolls up the elements, displaying the total.
When you add more than 1 contra account, or a mix of contra accounts and regular accounts, the rollup calculates like this:
- Returns the sum of all contra accounts a positive number when all the accounts are contra accounts.
- Returns the sum of all regular accounts minus the sum of all contra accounts when there's a mix of accounts.
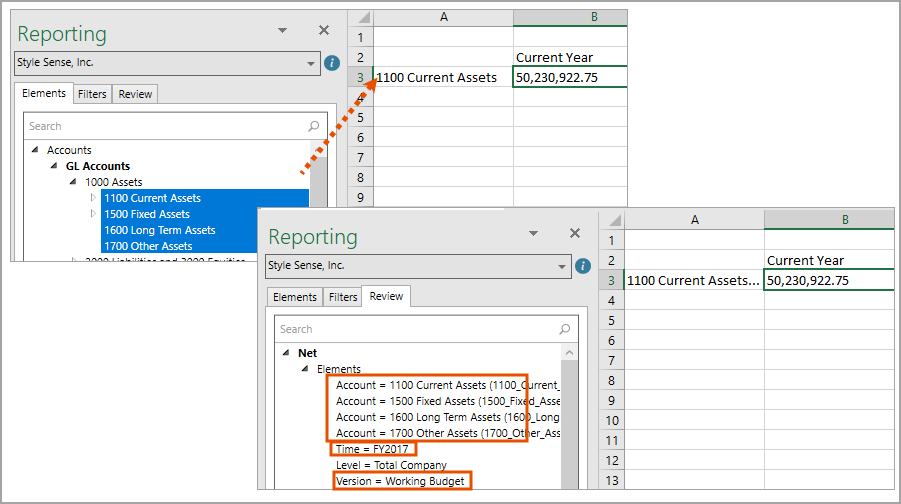
Example of Row: Add multiple accounts to a single row. The row displays the rollup value of all the accounts. Highlight the row and go to the Review tab. In the row section, you see all the accounts.
Example of Column: Drop the Working Budget version and 2017 into a single column. The column displays working budget data for 2017. Highlight the column and go to the Review tab. In the column section, you see both the Working Budget Version and 2017.
Add Multiple Elements to Multiple Columns, Rows, or Cells
- Highlight at least two columns, rows, or cells.
- Hold down the Ctrl key and click as many elements as you want. It does not need to match the amount of highlighted rows exactly.
- Drag the elements into the highlighted area of the worksheet.
- ClickRefresh.
- You only need to select at least two columns, rows, or cells andOfficeConnectdistributes the elements each to its own column, row or cell.
- You can drag and drop a collapsed bold element into a single column, row, or cell and the report adds the expanded values, each to its own column, row, or cell.
Example: Select two rows, then drop four accounts into the last of the two rows. Click
Refresh
and the report populates an account for each of four rows. In the Review tab, the report applied only one account to each cell. 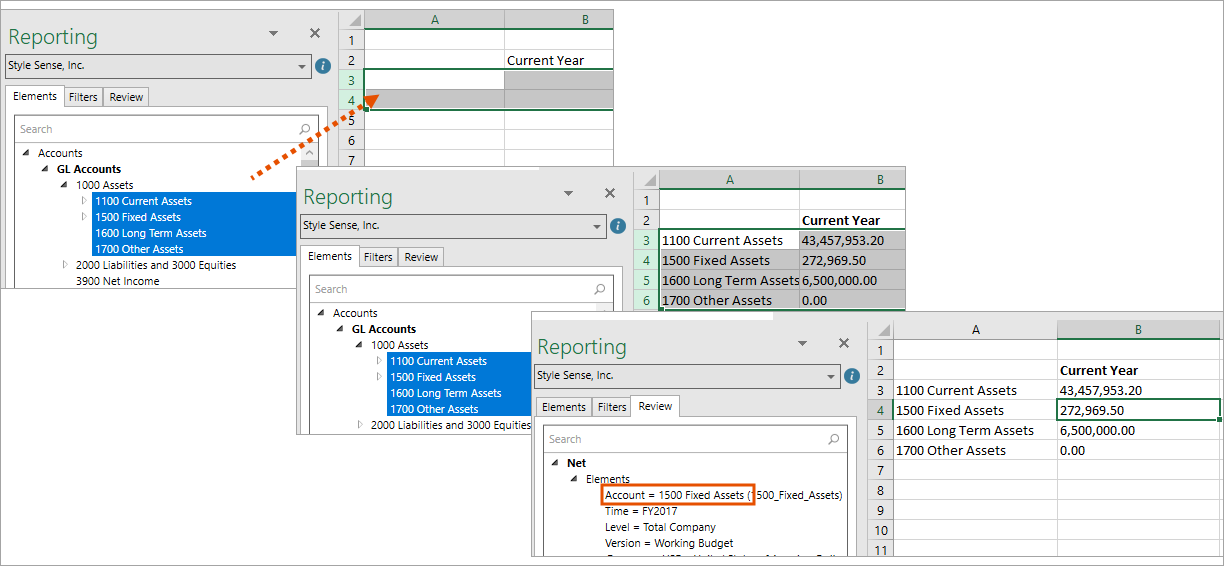
Add Level and Version Elements
The report adds Level and Version elements by default. See Default Version and Organization Defaults .
There are three methods for adding Levels and Versions to an
OfficeConnect
report:- Leave the defaults in place.
- Add to filters in the workbook or worksheet. See Add Elements to Filters.
- Add to rows, columns, or cells. This is useful if you want to compare financial data between level and/or versions.