
Change Element and Report Properties
Any time you change properties, it overrides previous properties set at any level. For example, if you change the font color to red for a single element, and then change the font color to black for the entire report, all fonts will be black. The reverse is also true: if you change the font color to red for the entire report and then change the font color to black for the one element, the one element will have a black font and the rest of the report will have a red font.
Change Properties at Different levels
To enhance the look and feel of your report, change the properties for the entire report, each element, or a group of elements.
- Open the properties menu in the report builder:
- For entire report, click theReport propertiesbutton.
- For single elements, right-click an element and selectPropertiesorFormatdepending on the type of report.
- For multiple elements, control-click to select multiple elements on the same axis and in the same tier. Right-click and selectPropertiesorFormatdepending on the type of report.
- Click through the tabs and change the properties. The tabs and options available depend on the type of report and how you have accessed the properties.
- ClickApplyonce to apply all the changes you've made across the tabs.
- ClickSave and Runto see your changes.
Change Report Display
Change the display options in a report to make it more readable. For example, focus on the real values by hiding rows and columns with zeros or blanks.
Click the
Report properties
button and click the Display
tab:- Provide a title for the generated report.
- Show report information, such as filter conditions and sorting.
- Show vertical lines.
- For HTML output only, freeze row and column headers for reports with many columns.
- Manage the Display of Zeros and Blanks
- Zeros appear when the value entered on the corresponding sheet cell is zero or the value has not been entered on the corresponding sheet cell yet.Blanks appear when the data cross sections don't exist. This could happen because the account has a coarser time configuration than the column. For example, the account Intern Expense has monthly data. Because there is no weekly data for the account, it displays a blank for the weekly columns.
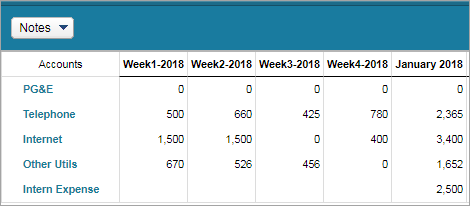 To manage how a report displays zeros:
- From the Display tab, click the checkbox for:
- Suppress rows if all zeros or blankstohide rows that have no data or that have all zeros.
- Suppress columnsif all zeros or blankstohide columns that have no data or that have all zeros.
- Click theNumberstab and from the Display Zeros dropdown, choose toUse accounts' format,0,-, orBlank.
- ClickApply.
- Save and run the report.
The element properties in column and rows overrides the report settings. To manage zeros for each element:- Right-click the element and clickProperties.
- Click the Numbers tab and from the Display Zeros dropdown, choose toUse accounts' format,0,-, orBlank.
- ClickApply.
- Save and run the report.
Best Practice: Display zeros as0or-to differentiate zero values from invalid data points.
Set the Formatting for Columns and Data
Set the display options for columns in a report. Click
Report properties
from the toolbar and click the Style
tab. You can also right-click the column and select Properties
from the menu.For all columns and their data elements, you can:
- Set the column width in pixels.
- Format the column header and body (data) by setting the font size, style, background and font color.
- Format the Total cell if the selected column is numeric.
Set Date Display Options
For columns with dates, you can specify the date format. For example, you can display the posting dates in a transaction report as Jan 18, 2020 or 1/18/20.
Click
Edit properties
from the toolbar and click the Display Date Format
tab. Or, right-click the column and select Date Display Format
from the menu to display this dialog.Set Numeric Display Options
You set display options for a report from the Element Properties dialog. For columns with numeric data, you can:
- Specify how to display data with zero values.
- Show or hide the thousands separator.
- Set precision for the decimal point and magnitude to show the true value or in thousands, millions, or billions.
- Set the display format for negative numbers.
Click
Report properties
from the toolbar and click the Numbers
tab. You can also right-click the column and select Properties
from the menu to display this dialog.You can set display options for total cells on columns with numeric values, such as total for transaction amounts. Right-click the Total cell for the numeric column and click
Format
or Currency
. The display options for Totals are the same as numeric columns. On the Currency tab, you can set the currency.
Set up Filters
When creating a model or transaction report, you can set up filter conditions to narrow the results to a particular subset of data. For example, filter the report on customers who's name starts with the letter a AND a service that is Fixed Bid.
The text that you enter as part of a filter is not case-sensitive.
Click
Filters
from the toolbar. The Manage Filter dialog is displayed. The filter criteria for a report type can vary but the steps are basically the same.- (Model report only) From the Report Version drop-down, select any version that is not hidden.
- (Model report only) If using more than one modeled sheet in the report, select the sheet you want to filter from the drop-down.
- Select the column you want to filter by, select the filter criteria, and enter the value. For example, define a filter on the Customer column that begins with "a".
- To add another filter condition, click thePlusicon. A new filter row appears as an and statement. Define the additional filter condition.
- To add another set of filters, clickAdd Group. A new filter appears as an or statement.
- ClickApply.
No error message is displayed if the filter condition results in no valid data. When you run the report, no data will be displayed. Refine your filter to get the desired results.