Modeled Sheet Display Column Settings
Question
How do I know what month of data is being displayed in a modeled sheet?Answer
This depends on three settings: the reference month
, rollup range
, and the start of rollup range
. These settings can be customized for each individual column in the modeled sheet.
To edit the settings:
Go to
Admin
> Manage Sheets on Levels
> Sheet Name
> Columns and Levels
. After clicking on a Display Column
, you can access the display columns properties on the right side of the page as shown in the image below.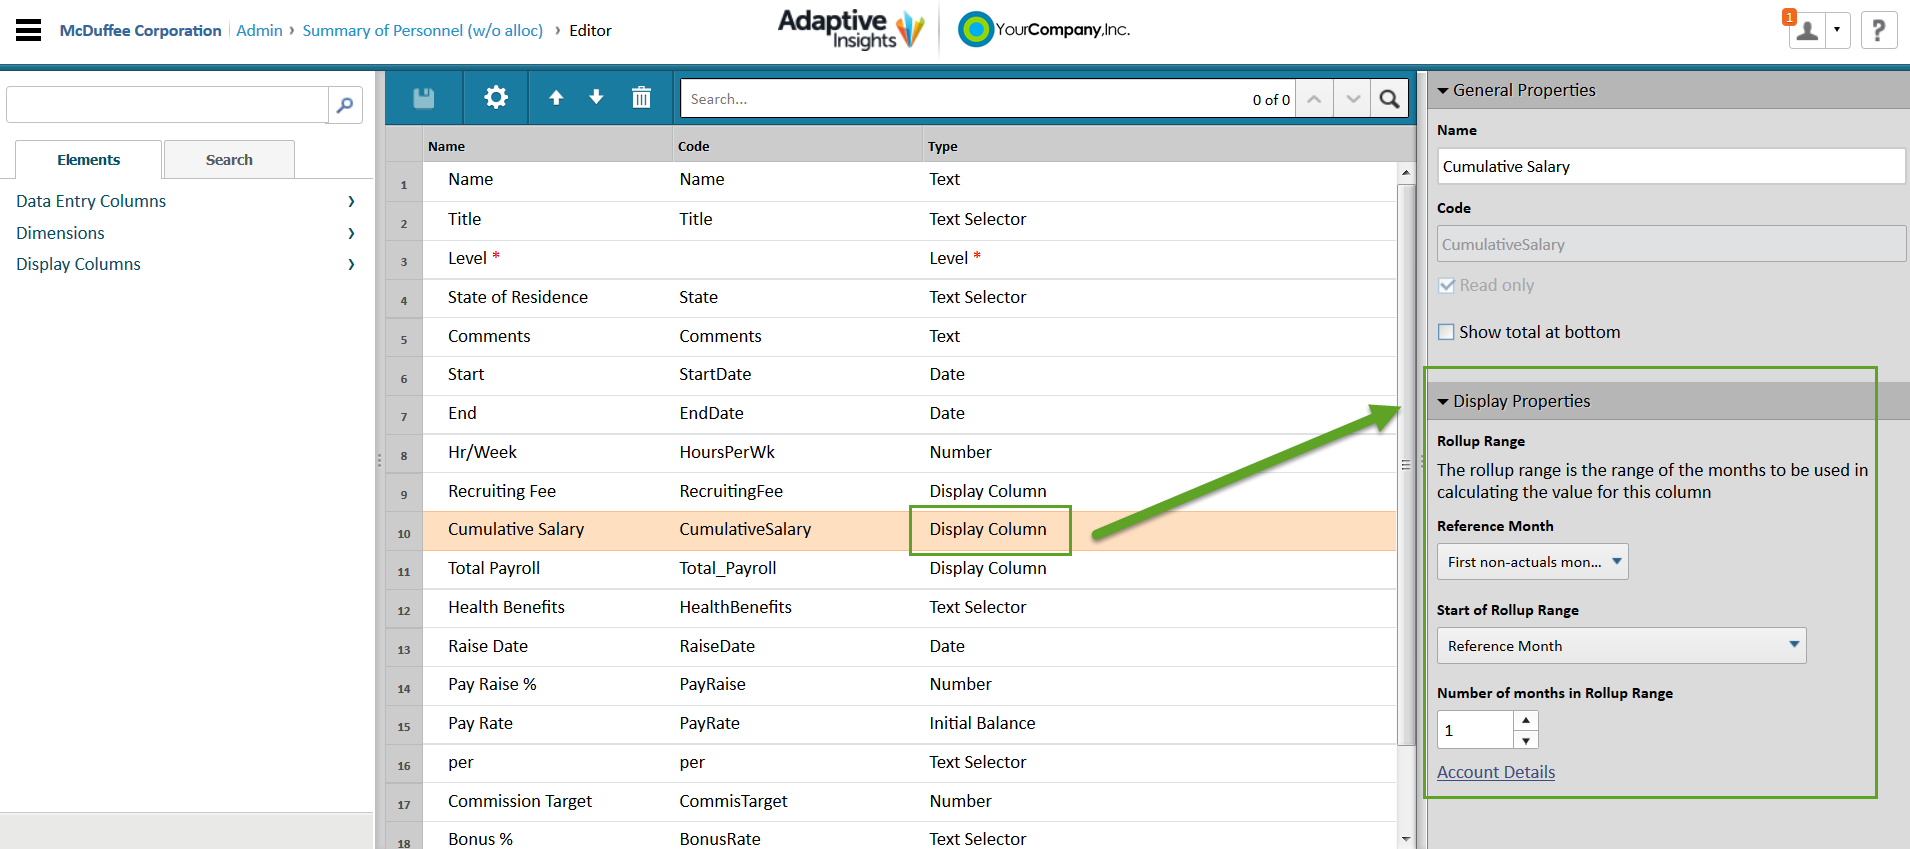
Here's what the options mean:
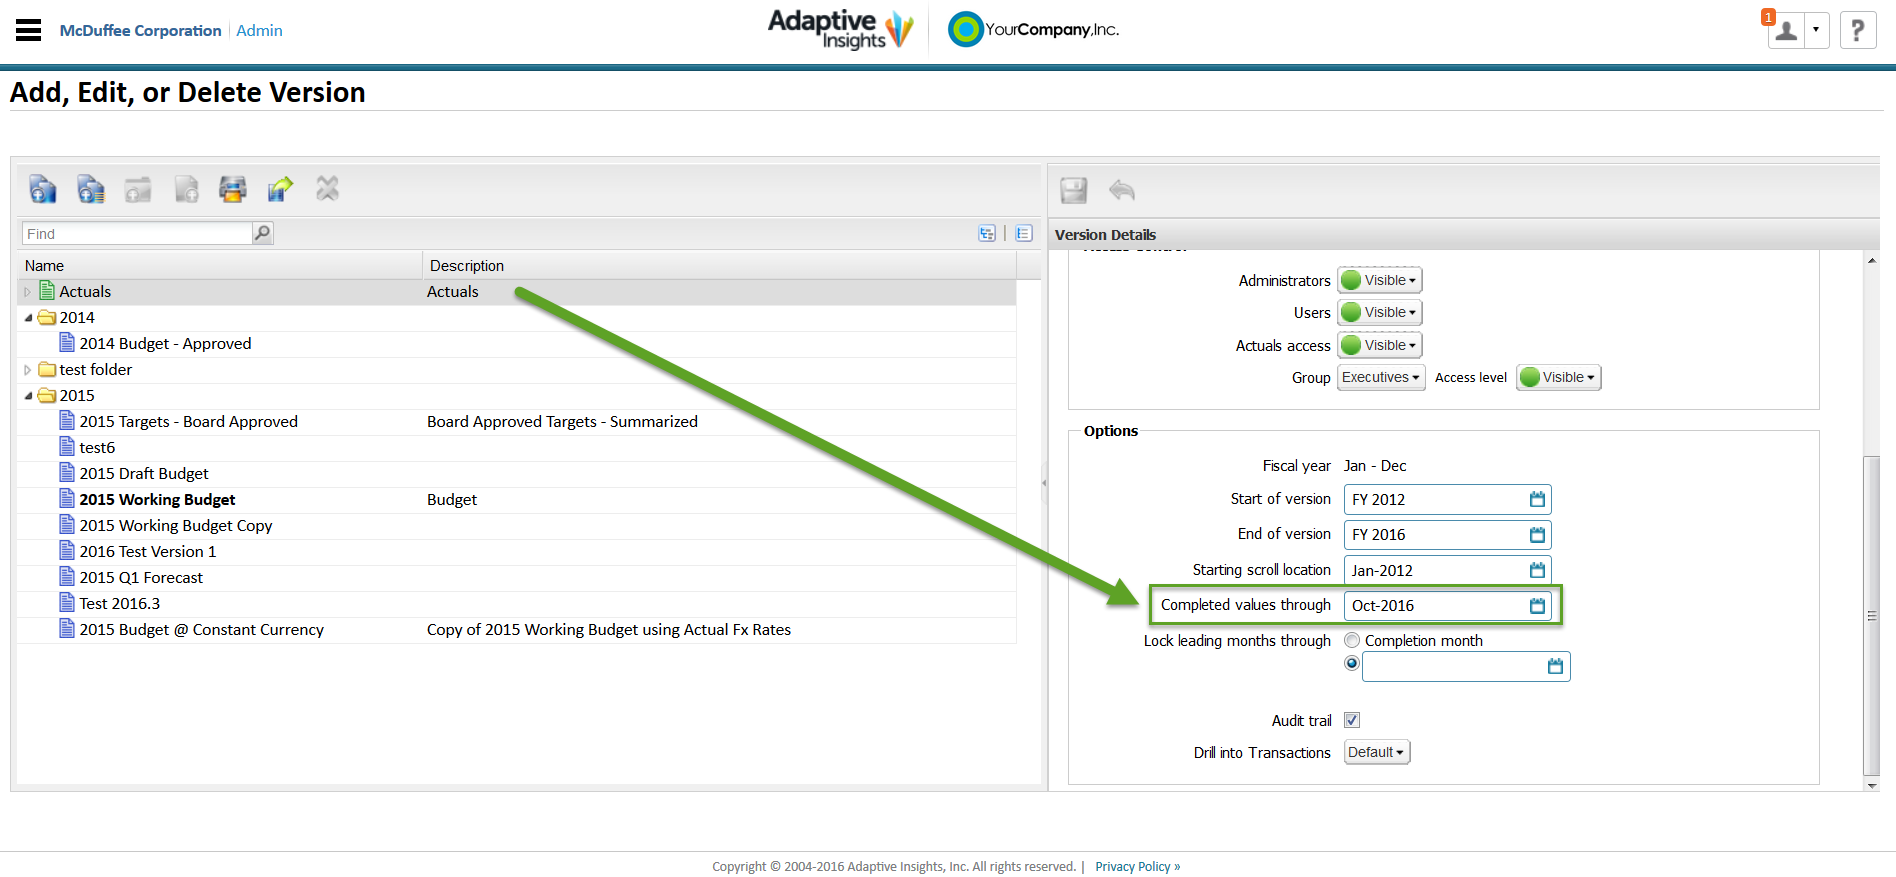
- Reference Month: First non-actuals month: This is the month after the month set for the Completed Values Through field in the Actuals version in Admin > Manage Versions.
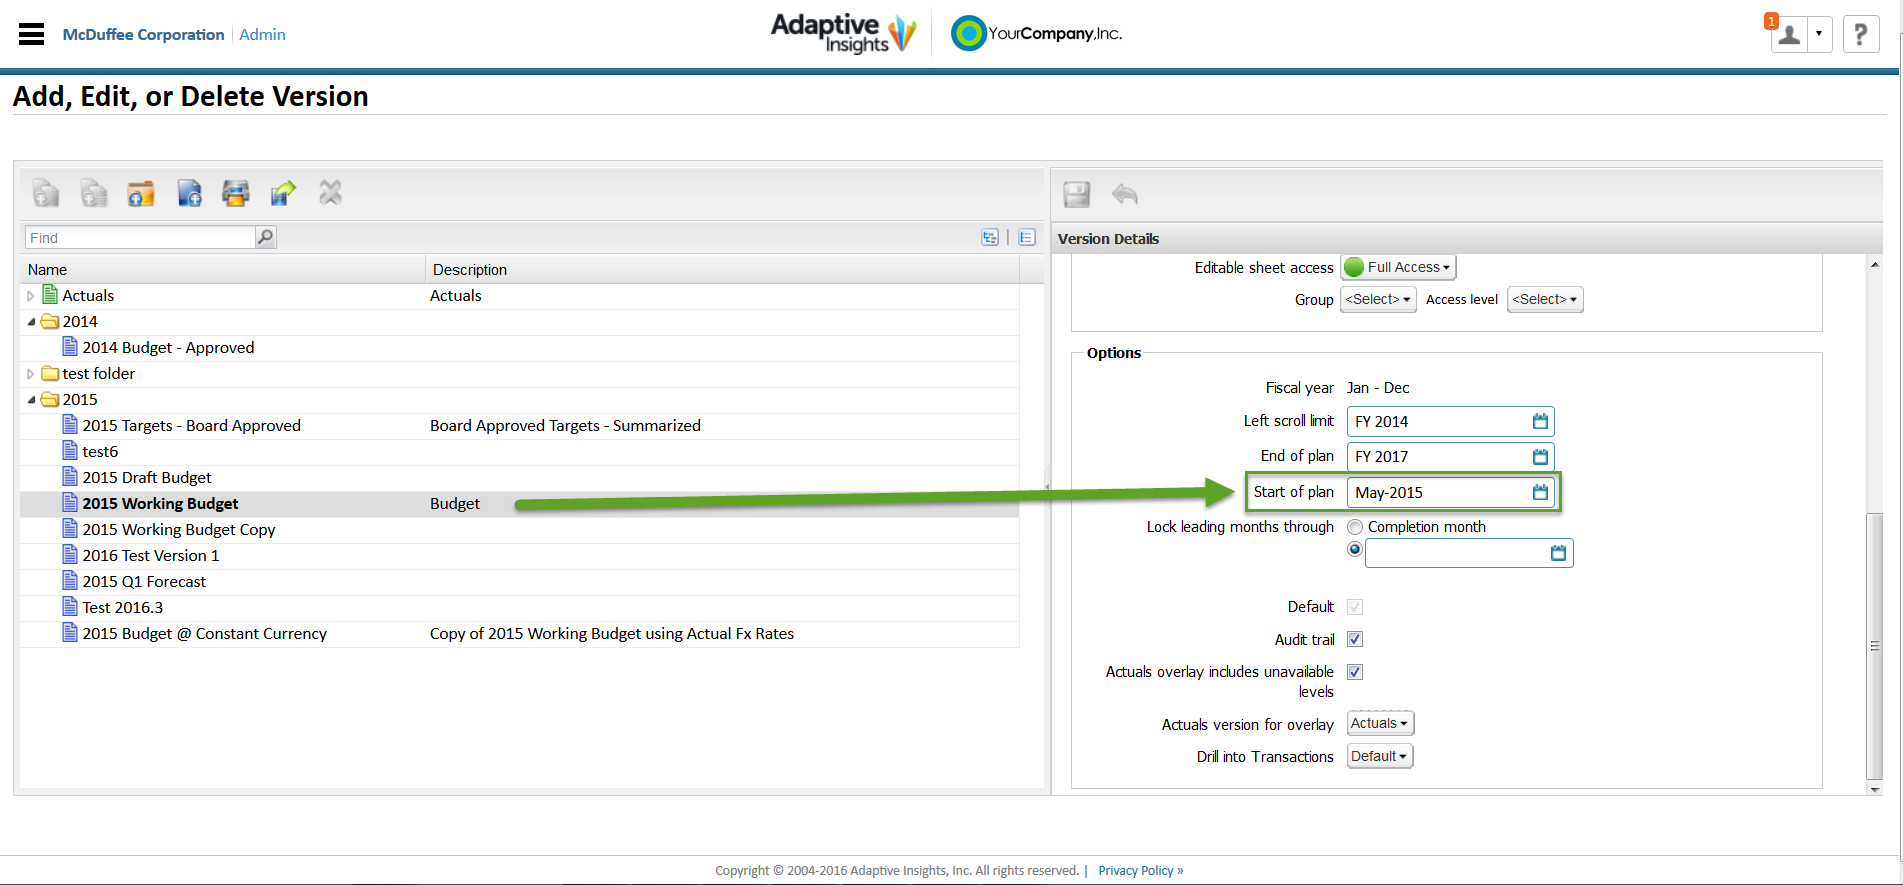
- Start of Plan:This represents the month that is set as the Start of Plan for the particular version that is shown.
- Rollup Range:This setting determines how many months will be summed together for the display column. It is commonly set to 1 or 12 to represent a month or year of data respectively.
- Start of Rollup Range:This represents the beginning of a Rollup Range and each option is relative to the Reference Month. The options are as follows:
- Reference Month
- Start of quarter containing Reference Month
- Start of fiscal year containing Reference Month
- Month before Reference Month
- Start of quarter that ends before Reference Month
- Start of fiscal year that ends before Reference Month
- Month after Reference Month
- Start of quarter after Reference Month
- Start of fiscal year after Reference Month