
Use Excel Charts
When working with
Adaptive Planning
sheets in Excel, you can use Excel features, such as functions and charting tools outside the planning cell range to perform local reporting or analysis if required. This section provides two examples of using Excel with Adaptive Planning
data: Excel charts and Excel formulas.Create an Excel Chart with Adaptive Planning Data
Adaptive Planning
DataYou can insert a line chart that shows Net Income trends:
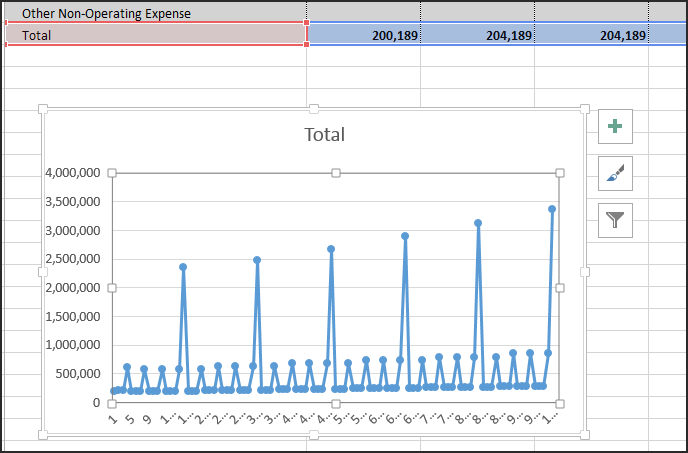
- Select the data from a row from theAdaptive Planningsheet range. For example, select the Net Income row from the P&L sheet.
- Insert a line chart in an Excel range and format as desired using Excel Chart Tool options.
Note:
Switching levels or version can extend the range of the Adaptive Planning
grid area and can override any local Excel analysis or reporting.Create an Excel Calculation with Adaptive Planning Data
Adaptive Planning
DataPerform a local calculation using Excel and data from the planning sheet. Insert any Excel function or formula outside the planning sheet and reference
Adaptive Planning
data or a combination of Adaptive Planning
data and data entered with in the Excel range.For example, calculate the delta net income between the Q1 and Q2:
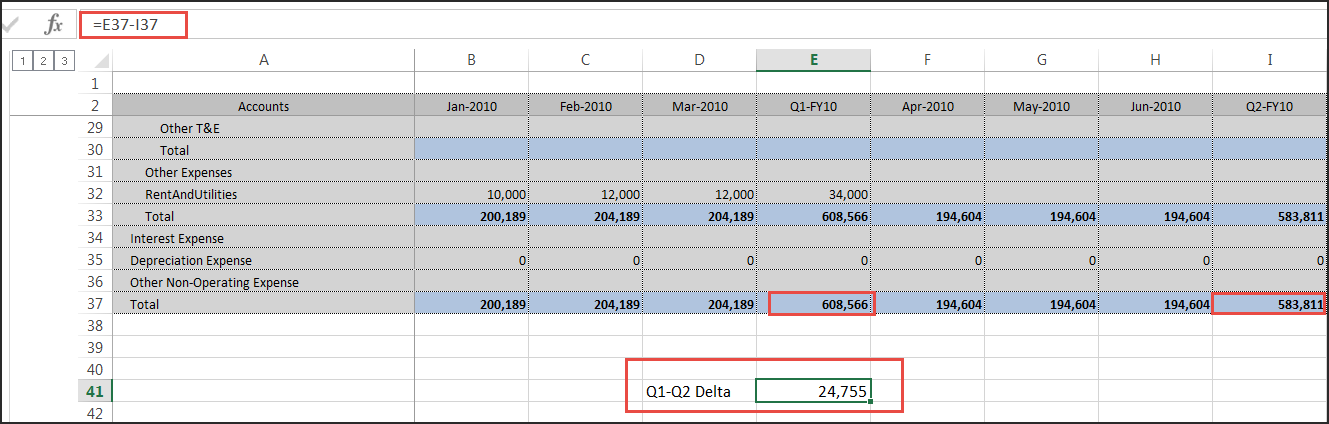
Insert an Excel function or formula in a cell within the Excel cell range and reference
Adaptive Planning
cell ranges in the calculation.