
Concept: Calculations in Charts
A calculation, also known as a calculated metric, enables you to apply ad hoc analysis to your charts. You can create calculations that are basic mathematical expressions or that contain complex conditional logic. Examples:
- Sum liquid assets:[110_cash] + [120_account_receivables] + [130_shortterm_investment]
- Commission based on deal size:iif([dealsize] >= 100000, [commission] * .05, [commission])
Where to Manage Calculations
In edit mode, you can create, edit, and organize calculations from the
Accounts
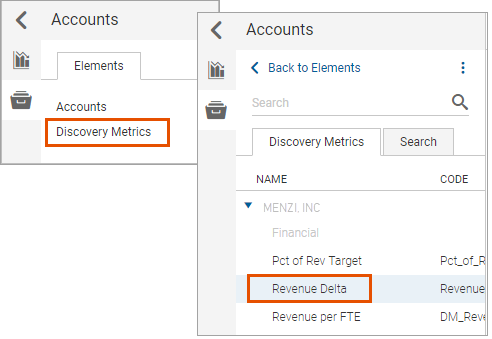
tab.You can view your metrics by navigating to . Only calculations have a name and a code.The following shows set of calculations for Menzi, Inc:
You can perform these actions on folders by clicking the
More
menu on a folder:- Add folder: You can nest folders inside other folders.
- Rename folder: You can rename any folder, including the<my instance> Metricfolder.
- Add calculated metric: See Create calculations for Charts.
- Delete: You can't delete the<my instance> Metricfolder.
You can also perform these actions on calculations by clicking the
More
menu on a calculation: - Edit: Change the settings, expressions, or drill-down selections on a calculation.
- Delete.
Any calculation that you create is available to anyone who can edit perspectives. They can add your calculation to their charts.
Where to Use Calculations
Calculations in Charts
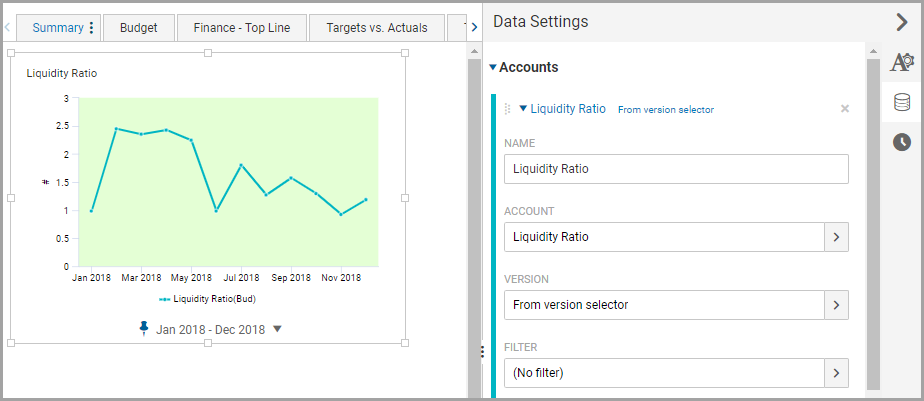
When you add a calculation to a chart, it becomes a data series. You can edit the appearance, data settings, and time settings on the series. Examples: You can:
- Apply a filter.
- Change the color.
- Rename it.
The data settings in the chart changes automatically without breaking the reference to the source calculation.
Calculations Within Other Calculations
You can reuse a calculation in another calculation to build complex expressions by referencing the calculation code in the expression. Example: You can use the Quick Ratio calculation in a capital planning calculation:
iif([quick_ratio] > 2.5, [hardware] * 1.05, [hardware])
Version Overrides and Precedence
The version in a data series on a chart automatically references the
default version
set at your instance. You can override the version default by specifying a version on the:- Calculation that's added as a data series.
- Data series itself.
Outermost (Lowest) | Innermost (Highest) | |
Instance | Data Series in Chart | Calculation within a Calculation |
Enclose the version name in square brackets when it contains a space. Example:
(Version=[Working Budget])
. Brackets are optional for single-word names. Example: (Version=Actuals)
.Examples:
Is Version In Calculation? | Does Data Series Override Default Version? | Data Series in Chart Uses |
|---|---|---|
No. The Total Revenue calculation uses the default version: [4100_Product_Revenue] + [4200_Services_Revenue] | No. Total Revenue as a data series defaults to the version selector. 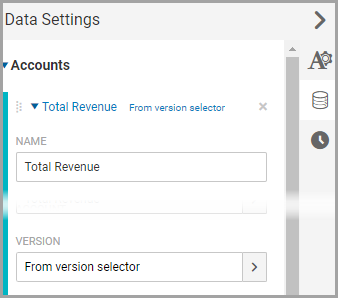 | The version in the calculation, Working Budget , is the instance default.The Total Revenue in the chart shows data values based on Working Budget . |
No. The Total Revenue calculation uses the default version: [4100_Product_Revenue] + [4200_Services_Revenue] | Yes. The Total Revenue as a data series has version set to Forecast .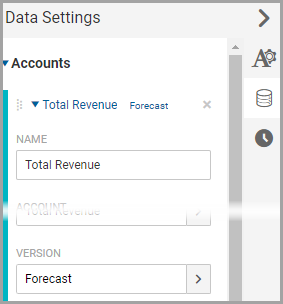 | The version in the calculation is Forecast The Total Revenue in the chart shows data values based on the version set in the data series. |
Yes. The Total Revenue calculation references the Actuals version:[4100_Product_Revenue](Version=Actuals) + [4200_Services_Revenue](Version=Actuals) | Yes: Total Revenue as a data series has the version set to Forecast : | The version in the calculation is Actuals . The Total Revenue in the chart shows data values based on the version referenced in the calculation, not the data series setting. |
Yes. The Net Income calculation references the Total Revenue calculation and a general ledger account: [Total_Revenue](Version=[Working Budget]) -[6000_Expenses] Where the expression in the Total Revenue is: [4100_Product_Revenue](Version=Actuals) + [4200_Services_Revenue](Version=Actuals) | No: Net_ Income as a data series defaults to the version selector: 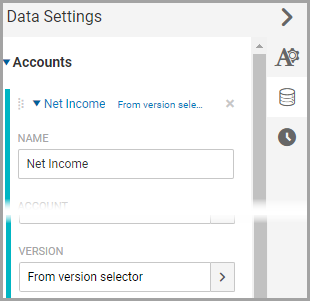 | The version in used in the calculation is Actuals . The source expression in the Total Revenue references the Actuals version and overrides the reference in the Net Income calculation.The Net Income in the chart shows data values based on the Total Revenue Actuals less Expenses from the Working
Budget, the default version set on the instance. |