
Konzept: Tabellenblattarten
Sie können die Tabellenblattart am Inhalt der Symbolleiste, den Zeilen und Spalten des Tabellenblatts erkennen. Es gibt drei Tabellenblattarten mit jeweils unterschiedlichen Funktionen:
- Standard
- Modelliert
- Cube
In Tabellenblättern können Sie Daten anzeigen, eingeben und aktualisieren, einschließlich Ist-Hauptbuch-Daten, Prognosen und Budgets.
Standardtabellenblätter
Standardtabellenblätter enthalten ein einfaches Grid mit Konten und Zeitperioden.
Beispiele:
- Bilanzen
- Tabellenblätter für Cashflow
- Tabellenblätter für Aufwand
- Tabellenblätter für Gewinn- und Verlustrechnung
- Tabellenblätter für Ertrag
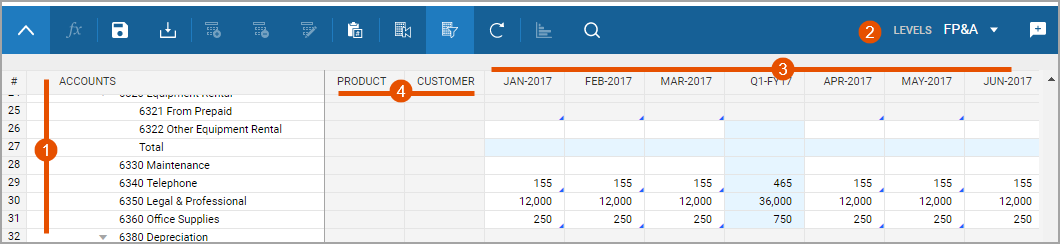
Option | Description |
|---|---|
1 | Accounts or levels populate down the rows. |
2 | Levels or accounts exist in the drop-down menu. Swap the rows with the drop-down menu. |
3 | Time populates across the columns. Change the time periods with Display Options . |
4 | Dimensions exist as columns with cells that have drop-down values. Not all standard sheets have dimensions. In order to select dimension, add a split. |
Standard sheets also have the
Add Split
, Delete Split
, and Rename Split
buttons in the toolbar. Modellierte Tabellenblätter
Sie können modellierte Tabellenblätter zum Eingeben von datensatzbasierten Daten verwenden. Diese Tabellenblätter enthalten benutzerdefinierte Feldnamen in den Spalten und Datensätze als Zeilen. Modellierte Tabellenblätter enthalten die zugrunde liegende Geschäftslogik für die Modellierung von Finanzereignissen. Beispiele:
- Abschreibung von Investitionsaufwendungen
- Monatsgehälter für Personal
- Aus Verkäufen generierte Erträge

Option | Description |
|---|---|
1 | Add Row and Delete Row buttons display in addition to, or instead of, the add, delete, rename splits buttons. |
2 | Labeled columns exist across the top and records list down the rows. The column types determine how you enter data. You can type in fields, or select from drop-downs. There are no row headers, only column headers. |
You can enter new information into existing rows or add new rows. Your admin can set a maximum number of rows a modeled sheet can display at once. If the sheet has a maximum, a message states how many rows of the total you can see. Use the filters to uncover different sets of data.
Cube-Tabellenblätter
Cube-Tabellenblätter ermöglichen mehrdimensionale Dateneingaben in
einigen Konten für eine potenziell große Gruppe von Dimensionen.
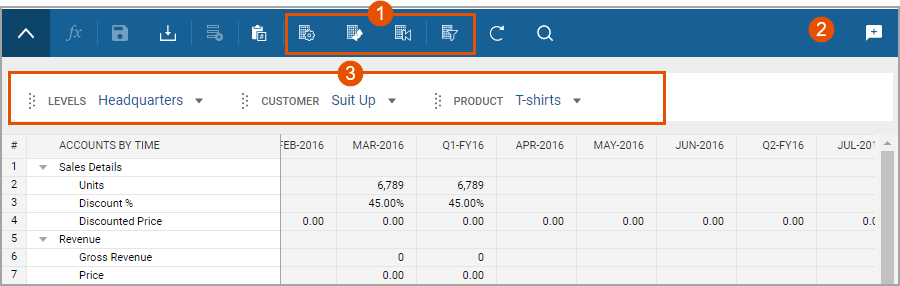
Option | Description |
|---|---|
1 | More display options exist in the toolbar. You can pivot the sheet to view data in multiple ways. |
2 | No level drop-down list exists in the toolbar. Levels are a dimension to use as filters, columns, or rows. |
3 | Alternative dimensions enable you to filter data, drag and drop into the columns and rows, and nest up to 5 dimensions in the rows. |
Merged cube sheets are entirely read-only. These sheets combine the data presence of other sheets to display calculated data.
Although the use case for cube sheets is modeling complex, multidimensional sales forecasting, you can use them for planning almost any multidimensional model.